Portland State University Portland State University
PDXScholar
PDXScholar
Dissertations and Theses Dissertations and Theses
Fall 12-8-2017
Exploring the Determinants of Vulnerable Road
Exploring the Determinants of Vulnerable Road
Users' Crash Severity in State Roads
Users' Crash Severity in State Roads
Àlvaro Alfonso Caviedes Cómbita Portland State University
Follow this and additional works at: https://pdxscholar.library.pdx.edu/open_access_etds Part of the Transportation Commons
Let us know how access to this document benefits you.
Recommended CitationRecommended Citation
Caviedes Cómbita, Àlvaro Alfonso, "Exploring the Determinants of Vulnerable Road Users' Crash Severity in State Roads" (2017). Dissertations and Theses. Paper 4062.
https://doi.org/10.15760/etd.5946
This Thesis is brought to you for free and open access. It has been accepted for inclusion in Dissertations and Theses by an authorized administrator of PDXScholar. For more information, please contact [email protected].
Exploring the Determinants of Vulnerable Road Users’ Crash Severity in State Roads
by
Álvaro Alfonso Caviedes Cómbita
A thesis submitted in partial fulfillment of the requirements for the degree of
Master of Science in
Civil and Environmental Engineering
Thesis Committee: Miguel Figliozzi, Chair
Christopher Monsere Avinash Unnikrishnan
Portland State University 2017
ii © 2017 Álvaro Alfonso Caviedes Cómbita
ABSTRACT
Pedestrians and bicyclists are the most vulnerable road users and suffer the most severe consequences when crashes take place. An extensive literature is available for crash severity in terms of driver safety, but fewer studies have explored non-motorized users’ crash severity. Furthermore, most research efforts have examined pedestrian and bicyclist crash severity in urban areas. This study focuses on state roads (mostly outside major urban areas) and aims to identify contributing risk factors of fatal and severe crashes involving pedestrians and bicyclists in state roads. Two ordinal regression models were developed (one for pedestrian and the other for bicyclist crashes) to examine crash severity risk factors. Additional models were developed to investigate road and traffic characteristics that could increase the likelihood of fatal crashes. In the model for pedestrian crash severity risk factors such as age, vehicle type and movement, light conditions, road classification, traffic control device, posted speed limit, location of the pedestrian and wet road surface during clear weather conditions are statistically
significant. The bicyclist crash severity model indicates that age, crash location, vehicle movement and alcohol intoxication during dark conditions are statistically significant. In terms of road characteristics and traffic conditions, the models suggested risk factors such as arterials, light conditions, posted speed limit, roadways, and high heavy vehicle
volume, increased the odds of a crash being fatal.
The results seem to suggest that besides improvements in roadway characteristics, additional countermeasures to reduce crash severity for vulnerable users should include
ii separation of vulnerable users from traffic, educational campaigns, more strict control of alcohol intoxicated drivers, and protection strategies of senior pedestrians.
ACKNOWLEDGMENTS
I would like to express my sincerest appreciation to Dr. Figliozzi for all his support and academic guidance in this research and my time in Portland State University. I would also like to thank Dr. Monsere and Dr. Unnikirshnan for their assistance, collaborators and members on the supervisory committee for this thesis. The author also recognize the support of members of the TTP laboratory at PSU College of Engineering who
contributed with their feedback. Any errors or omissions are the sole responsibility of the authors. I would like to thank Alexa Johnson for her continued support and assistance as a reviewer of the document. Finally, I would like to thank my family who unconditionally supported me during this long process back in Colombia.
iv
TABLE OF CONTENTS
ABSTRACT ... i
ACKNOWLEDGMENTS ... iii
LIST OF TABLES ... vi
LIST OF FIGURES ... viii
1 INTRODUCTION...1 2 RESEARCH OBJECTIVES ...3 3 LITERATURE REVIEW ...4 3.1 Location characteristics ...4 3.2 Environmental conditions ...6 3.3 Crash characteristics ...8 3.4 Demographic characteristics ...10 3.5 Traffic conditions ...12 3.6 Road characteristics...14 3.7 Studies in Oregon ...20 3.8 Summary ...25 4 DATA SOURCES ...30 5 DESCRIPTIVE ANALYSIS ...35 5.1 General Trends ...35
5.2 Pedestrian and bicyclist characteristics ...39
5.3 Road characteristics...46
5.4 Environmental conditions ...61
5.5 Summary ...68
6 EXPOSURE ANALYSIS ...70
6.1 Posted speed limit...73
6.2 Number of Lanes ...74
6.3 Width ...75
6.4 Road classification ...77
6.5 Neighborhood Concepts ...78
6.6 Summary ...82
7 DATA ANALYSIS AND RESULTS ...84
7.1 Single variable models ...91
7.1.1 Location characteristics ...91 7.1.2 Environmental conditions ...91 7.1.3 Crash characteristics ...94 7.1.4 Demographic characteristics ...96 7.1.5 Traffic conditions ...97 7.1.6 Road characteristics ...98 7.2 Pooled models ...100
7.3 Road characteristics and traffic conditions models ...109
8 DISCUSSION ...114
9 POLICY IMPLICATIONS ...120
v
11 CONCLUSION ...125
12 REFERENCES ...127
APPENDICES ...153
Appendix A: risk ratio by neighborhood concept ...153
Appendix B: Pooled Models ...168
vi
LIST OF TABLES
TABLE 1: Research questions ... 3
TABLE 2: Summary of location characteristics review ... 6
TABLE 3: Summary of environmental conditions review ... 7
TABLE 4: Summary of crash characteristics review ... 9
TABLE 5: Summary of demographic characteristics review ... 12
TABLE 6: Summary of traffic conditions review ... 13
TABLE 7: Summary of road characteristics review ... 18
TABLE 8: ODOT Pedestrian and Bicycle Safety Implementation Plan findings ... 21
TABLE 9: Literature review summary ... 27
TABLE 10: KABCO severity scale ... 31
TABLE 11: Neighborhood concept characteristics ... 33
TABLE 12: Statewide pedestrian crashes by neighborhood concepts and year ... 36
TABLE 13: Statewide bicyclist crashes by neighborhood concepts and year ... 38
TABLE 14: Statewide pedestrian crashes (2007-2014) by severity level, neighborhood concept and vulnerable user age. ... 40
TABLE 15: Statewide bicyclist crashes (2007-2014) by severity level, neighborhood concept and vulnerable user age. ... 42
TABLE 16: Statewide pedestrian crashes (2007-2014) by severity level, neighborhood concept and vulnerable user gender. ... 44
TABLE 17: Statewide bicyclist crashes (2007-2014) by severity level, neighborhood concept and vulnerable user gender. ... 45
TABLE 18: Statewide pedestrian crashes (2007-2014) by severity level, neighborhood concept and road classification. ... 47
TABLE 19: Statewide bicyclist crashes (2007-2014) by severity level, neighborhood concept and road classification. ... 49
TABLE 20: Statewide pedestrian crashes (2007-2014) by severity level, neighborhood concept and posted speed limit. ... 52
TABLE 21: Statewide bicyclist crashes (2007-2014) by severity level, neighborhood concept and posted speed limit. ... 53
TABLE 22: Statewide pedestrian crashes (2007-2014) by severity level, neighborhood concept and number of lanes ... 55
TABLE 23: Statewide bicyclist crashes (2007-2014) by severity level, neighborhood concept and number of lanes. ... 57
TABLE 24: Statewide pedestrian crashes (2007-2014) by severity level, neighborhood concept and road surface ... 59
TABLE 25: Statewide bicyclist crashes (2007-2014) by severity level, neighborhood concept and road surface ... 60
TABLE 26: Statewide pedestrian crashes (2007-2014) by severity level, neighborhood concept and weather conditions ... 61
TABLE 27: Statewide bicyclist crashes (2007-2014) by severity level, neighborhood concept and weather conditions ... 63
TABLE 28: Statewide pedestrian crashes (2007-2014) by severity level, neighborhood concept and light conditions ... 64
vii TABLE 29: Statewide bicyclist crashes (2007-2014) by severity level, neighborhood
concept and light conditions ... 67
TABLE 30: Pedestrian and bicyclist crashes in Oregon ... 70
TABLE 31: Pedestrian crash frequency and posted speed limit exposure ratio ... 73
TABLE 32: Bicyclist crash frequency and posted speed limit exposure ratio ... 73
TABLE 33: Proportion of road segment by posted speed limit... 74
TABLE 34: Pedestrian crash frequency and number of lanes exposure ratio ... 74
TABLE 35: Bicyclist crash frequency and number of lanes exposure ratio... 75
TABLE 36: Proportion of road segment by number of lanes ... 75
TABLE 37: Pedestrian crash frequency and width exposure ratio ... 76
TABLE 38: Bicyclist crash frequency and width exposure ratio ... 76
TABLE 39: Proportion of road segment by road width ... 77
TABLE 40: Pedestrian crash frequency and road classification exposure ratio ... 77
TABLE 41: Bicyclist crash frequency and road classification exposure ratio ... 78
TABLE 42: Proportion of road segment by road classification ... 78
TABLE 43: Crash frequency and neighborhood concept exposure ratio summary ... 79
TABLE 44: Proportion of road segment by neighborhood concepts ... 82
TABLE 45: Exposure analysis summary ... 83
TABLE 46: Distribution (%) of risk factors for different severity levels ... 86
TABLE 47: Single variable model – location characteristics (odd ratios) ... 91
TABLE 48: Single variable model – environmental conditions (odd ratios) ... 92
TABLE 49: Single variable model – crash characteristics (odd ratios) ... 95
TABLE 50: Single variable model – demographic characteristics (odd ratios) ... 97
TABLE 51: Single variable model – traffic conditions (odd ratios) ... 98
TABLE 52: Single variable model – road characteristics (odd ratios) ... 99
TABLE 53: AADT only trucks cut-points... 101
TABLE 54: AADT cut-points ... 104
TABLE 55: Ordinal regression model. Crash severity for pedestrians and bicyclists ... 105
TABLE 56: Predictive power rank ... 108
TABLE 57: Ordinal regression model. Road and traffic characteristics ... 111
TABLE 58: Predictive power rank (road and traffic characteristics) ... 113
TABLE 59: Impact of risk factors on severity level ... 117
viii
LIST OF FIGURES
FIGURE 1: (a) Pedestrian and (b) Bicyclist crashes by location. This figure is adapted from Kittelson & Associates, Inc. (2014) ... 23 FIGURE 2: (a)Pedestrian and (b)Bicyclist crashes by road characteristics and intersection type. This figure is adapted from Kittelson & Associates, Inc. (2014) ... 24 FIGURE 3: Crash event processing ... 31 FIGURE 4: Neighborhood Concept Types, adapted from Currans et al. (2015)... 32 FIGURE 5: Oregon Neighborhood Concept, (a) State of Oregon, (b) Portland Metro Area ... 34 FIGURE 6 Odd ratios for (a) Pedestrian and (b) Bicyclist models ... 107 FIGURE 7 Odd ratios for (a) Pedestrian and (b) Bicyclist models (only road and traffic characteristics) ... 112
1 INTRODUCTION
There is a growing interest in increasing non-motorized transportation in the state of Oregon as a strategy to improve public health, air quality, and to reduce traffic
congestion. With an expected increase of 30% in the total population by 2040, the state of Oregon expects to continue its growth in walking and biking (Oregon Department of Transportation, 2016). As residents in Oregon choose non-motorized modes, safe walking and biking facilities become a priority.
At the national level, 41% of trips under three miles are made by walking or bicycle (U.S. Department of Transportation, 2015), unfortunately there have been an increase in
fatalities and serious injuries for bicyclists and pedestrians (U.S. Department of Transportation, 2015).
Pedestrians and bicyclists are among the most vulnerable users on the road and in crashes with vehicles they tend to suffer the most severe consequences due to their lack of protection. Risk factors associated to crash severity for pedestrians and bicyclists have been understudied in suburban and rural roads, making it difficult for Department of Transportation agencies (DOT) to implement countermeasures and policies to improve safety for vulnerable road users.
This study aims to identify contributing risk factors of fatal and severe crashes involving pedestrians and bicyclists in Oregon DOT (ODOT) roads. Identification of these factors will provide ODOT with the ability to implement appropriate countermeasures to reduce crash severity for pedestrians and bicyclists.
This research used pedestrian and bicyclist crash data for the years 2007 to 2014 collected from the Oregon Statewide Crash Data System. Additional information on the
2 ODOT’s highway network, traffic conditions and road characteristics was gathered from the Oregon Department of Transportation’s TransGIS database.
The remainder of the paper is structured as follows. First, we discuss the main objectives of this study and the extent of the research. Second, we show a literature review of risk factors and crash severity for pedestrian and bicyclists. Then, a description of the data sources used on this study is presented. In section 5 we present a descriptive analysis of risk factors for severity, and its relationship with different land uses. This section is followed by an exposure analysis, intended to uncover crash severity patterns by controlling by VMT and land use. Section 7 presents a brief overview of the statistical model used in this research. Then, in section 8 we present the data analysis performed, split by single variable models and pooled modes (using all the variables, and then only road and traffic risk factors). Finally, we discuss the findings and then we close with limitations and conclusions.
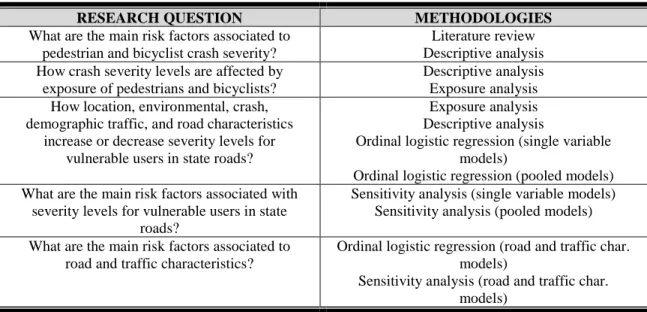
2 RESEARCH OBJECTIVES
TABLE 1 outlines the research questions this thesis addresses and the different methodologies used to explore them.
TABLE 1: Research questions
RESEARCH QUESTION METHODOLOGIES
What are the main risk factors associated to pedestrian and bicyclist crash severity?
Literature review Descriptive analysis How crash severity levels are affected by
exposure of pedestrians and bicyclists?
Descriptive analysis Exposure analysis How location, environmental, crash,
demographic traffic, and road characteristics increase or decrease severity levels for
vulnerable users in state roads?
Exposure analysis Descriptive analysis
Ordinal logistic regression (single variable models)
Ordinal logistic regression (pooled models) What are the main risk factors associated with
severity levels for vulnerable users in state roads?
Sensitivity analysis (single variable models) Sensitivity analysis (pooled models) What are the main risk factors associated to
road and traffic characteristics?
Ordinal logistic regression (road and traffic char. models)
Sensitivity analysis (road and traffic char. models)
4
3 LITERATURE REVIEW
Although there is extensive research in crash severity in terms of driver safety, studies on non-motorized users is more limited. Researchers who have studied vulnerable users identified several main risk factors that contribute to severity. These factors were classified into six major categories: location characteristics, environmental conditions, crash, demographic characteristics, road, and traffic conditions. This section reviews different risk factors that several researchers have identified. Furthermore, we mentioned some of the methodologies they have used as a reference for the present study.
3.1 Location characteristics
Zahabi et al. (2011) developed several models to determine the effects of road design, build environment, speed limits, and other factors on crash severity with pedestrians and cyclists involved. Data on crashes, land use (50 to 400 meters from the crash location), and road characteristics were collected for the city of Montreal. The authors found that after including land use variables in the model, the overall power of the explanatory variables increased. Pedestrian crashes that occurred near a park tended to be more severe than crashes at other locations, while pedestrian crashes that occurred near a school tended to be less severe. This finding can be attributed to the safety measures that were taken near schools.
Opposite results were found by Kim et al (2007). For bicyclist crashes, the findings suggested that areas with a school increased the probability of incapacitating injury; however, it decreases the likelihood for other severity levels (Kim, Kim, G., & Porello, 2007).
Abdul-Aziz et al. (2013) found that land use designated as industrial is associated with less severe and fatal pedestrian crashes. This finding is not surprising if we consider the low levels of pedestrian activity in these zones. On the other hand, the authors found a significant effect of commercial neighborhoods in crash severity.
Islam and Hossain (2015) explored the influence of different risk factors in severity of crashes involving non-motorized users. The authors employed a mixed-logit model approach. Severity was defined used the KABCO scale, but adding C and O in one category itself. A total of 2,442 and 789 observations for pedestrian and bicycle crashes, respectively, were analyzed. The findings suggested that occurrence of crashes in
residential areas tended to increase the probability of a severe injury for both pedestrians and bicyclists. Commercial land use was also statistically significant; however, for bicyclist crashes, it had an opposite direction, crashes at commercial areas tended to be less severe and fatal than in other areas.
TABLE 2 summarizes the studies that found relationships between pedestrian and bicyclist severity levels and vulnerable user’s characteristics. The arrows show the direction of the relationship between the independent variables and pedestrian severity. When an upward pointing arrow symbol (↑) is used, the probability for the crash to be fatal or severe increases due to the variable studied. When a downward pointing arrow symbol (↓) is used, the probability for the crash to be fatal or severe decreases. When the symbol is a dash (-), the study did not find a statistical difference.
6
TABLE 2: Summary of location characteristics review
PEDESTRIAN STUDIES Author (year) Transit
access Commercial land use Park presence School presence Clifton et al. (2009) ↓ Zahabi et al. (2011) ↑ ↑ ↑ ↓ Seyed et al. (2011) ↓ Abdul-Aziz et al. (2013) ↑
Islam and Hossain (2015)
↑
BICYCLIST STUDIES
Zahabi et al. (2011) - - - -
Islam and Hossain
(2015) ↓
Kim et al. (2007) ↑
3.2 Environmental conditions
As expected, lighting conditions were associated with crash severity. Good lighting conditions resulted in less severe pedestrian injuries (Zheng, 2014 ). Similar findings were found in New York (Abdul-Aziz, Ukkusuri, & Hasan, 2013). Chen et al. (2016) compared severity risk factors for crashes sustained by pedestrians in facing-traffic and back-to-traffic. A binary logit mode was used to evaluate the outcome of the injury, where the injury was located (e.g. head), and if the road was built or not built. The
findings of this study suggested that pedestrian crashes during dark conditions and during morning peak hours were more likely to result in an injury. For bicyclist crashes the trend was similar, better lighting conditions improved visibility, which reduced the likelihood of a severe and fatal crash (Allen-Munley, Daniel, & Dhar, 2004).
Several studies have demonstrated that inclement weather conditions, such as rain, snow and fog, were strongly associated with crash severity levels. Li et al. (2016) explored the impact of pedestrian and driver characteristics on crash severity under
different weather conditions. Crash data from Great Britain was used for this analysis. A total of 14,174 crashes were assessed. The authors used nonparametric methods
(classification and regression tree) to develop a model of crash severity. Under fine weather conditions, high-posted speed limits, older pedestrians, and poor light conditions, the likelihood of a severe crash increased. Under inclement weather conditions, only posted speed limit and older pedestrians were found to be predictors of severe crashes.
Inclement weather conditions were significantly associated with bicyclist injury severity as well (Kim, Kim, G., & Porello, 2007). Similar to lighting conditions variables, the authors suggested that weather was a confounding effect for other unobservable variables, such as visibility and bicycle brake failures.
In terms of the day of the week, the study conducted by Kim et al. (2007) revealed that bicyclists were more likely to be injured during the weekend than on weekdays. Additionally, for crashes occurring on weekday peak hours, the severity levels tended to be higher as well.
TABLE 3: Summary of environmental conditions review
PEDESTRIAN STUDIES Author (year) Inclement
weather conditions Night time/ poor lighting conditions Peak hours Weekend days Tay et al. (2011) ↑ ↑ ↑ Zheng (2014) ↑ Zhang et al. (2014) ↑ ↑ Jang et al. (2013) ↑ ↑ Haleem et al. (2015) ↑ ↑ Chen et al. (2016) ↑ ↑ Eluru et al. (2008) ↑ Li et al. (2016) ↑
Islam and Hossain (2015) ↑ ↑
Abdul-Aziz et al. (2013) ↑
McIntyre (2016) ↑
8
TABLE 3: Summary of environmental conditions review, continued
BICYCLIST STUDIES Author (year) Inclement
weather conditions Night time/ poor lighting conditions Peak hours Weekend days Kim et al. (2007) ↑ ↑ ↑ ↑
Islam and Hossain (2015) ↑ ↑
Allen-Munley et al.(2004) ↑
McIntyre (2016) ↓
Eluru et al. (2008) ↑
3.3 Crash characteristics
There was a consensus between the different studies in terms of crash severity and type of vehicles. A crash that involved a pedestrian (or a bicyclist) and a heavy vehicle was more likely to be fatal or severe than a crash with a lighter vehicle. Zheng (2014 ) also revealed that heavy vehicles had a higher crash rate than light vehicles, which increased the overall risk for pedestrians. Zahabi (2011) found that vehicle size was positively associated with pedestrian and bicyclist severity; however, the coefficient was only statistically significant for pedestrian crashes. On the other hand, Kim et al. (2007), Eluru et al. (2008), and Allen-Munley et al. (2004) found that heavy trucks increased the probability of severe and fatal crashes compared to other types of vehicles. Eluru et al. (2008) explained that non-motorist crashes with heavy vehicles tended to be fatal or severe due to higher bumper heights and impact areas.
Multiple studies have also explored the impact of alcohol on crash severity; however, most of these studies did not consider pedestrians and bicyclists exclusively. Kim et al. (1995) found that the odds of a head-on or rollover collision were much greater
in the presence of alcohol or drugs. Additionally, young people were less likely to crash under alcohol effects than old people were.
Eluru et al. (2008) developed a mixed generalized ordered response logit to explore severity in crashes involving pedestrians and bicyclists. The authors found that pedestrians and bicyclists who were hit by an alcohol-intoxicated driver were more prone to be severely injured. Similarly, Kim et al. (2008) found that intoxicated drivers
increased the probability of fatal injury by 17% and incapacitating injury by 24%. Lee and Abdel-Aty (2003) explored the interaction between lighting conditions and impaired drivers and found that people who were driving under alcohol effects in dark conditions tended to be involved in more severe crashes than people driving during dark conditions with street lighting are.
TABLE 4: Summary of crash characteristics review
PEDESTRIAN STUDIES
Author (year) Size of the vehicle Alcohol intoxication
Lee and Abdel-Aty
(2003) ↑ ↑
Tay et al. (2011) ↑
Zheng (2014) ↑
Seyed et al. (2011) ↑
Tarko and Azam
(2011) ↑ Haleem et al. (2015) ↑ Eluru et al. (2008) ↑ ↑ Allen-Munley et al. (2004) ↑ Eluru et al. (2008) ↑ Matsui and Oikawa (2016) ↑ Zahabi et al. (2011) ↑ Sasidharan et al. (2015) ↑ Kim et al. (1995) ↑
10
TABLE 4: Summary of crash characteristics review, continued
BICYCLIST STUDIES
Author (year) Size of the vehicle Alcohol intoxication
Zahabi et al. (2011) - Kim et al. (2007) ↑ ↑ Allen-Munley et al.(2004) ↑ Eluru et al. (2008) ↑ ↑ 3.4 Demographic characteristics
Two variables were used for pedestrian characteristics, age and gender. Most of the studies classified age into different categories, defining elder pedestrian as people over the age of 65.
Tay et al. (2011) used a multinomial logit model to estimate the likelihood of a pedestrian being involved in a fatal, severe and non-severe crash. The authors chose this approach because it allowed them to model an unordered response and a non-monotonic effect of the independent variables on the dependent variable. A 2006 database from the South Korean Police agency was used for this purpose. The findings suggested that elder pedestrians had a greater likelihood of being involved in a fatal and severe crash than younger pedestrians. Kim et al. (2008) studied police reported crash data between 1997 and 2000 to investigate the relationship of age in the severity of the crash. The authors found that as the people get older, the probability of fatal or severe injuries after a crash increased. Similarly, Zheng (2014 ) showed that elder pedestrians are at a higher risk of a severe crash than younger pedestrians. These findings were attributed to the fact that walking speed, visibility reaction time, and body resistance tend to be lower for this demographic group. Kim et al. (2007) explored the factors that contributed to bicyclist
severity levels due to a crash with a motorized vehicle. A total of 2.937 bicyclist crashes from the North Carolina police report database (1997 to 2002) were used. Bicyclists with an age of 55 and over had a greater likelihood of being involved in a fatal or injury crash than younger bicyclists.
Zhao et al. (2014), a team of engineers and medical experts, collected crash data (2006) in the city of Beijing and Northern China. Only 121 crashes were studied. The study controlled for impact speed, which was estimated from the vehicle’s breaking distance before the collision. Additional to the data regarding the crash, the researchers included injured body region, treatment type after the crash and surviving time. Severity was measured based on the Abbreviated Injury Scale 2005, which goes from AIS 1 (minor injury) to AIS 6 (currently untreatable). After controlling severity for the
pedestrian’s body impact location, the authors did not find a difference in severity levels between male and female pedestrians. Sze and Wong (2007) evaluated injury risk factors of pedestrian fatalities in Hong Kong. This study measured the associations between the injury level of pedestrian causalities and all possible contributory factors such as gender, crash characteristics, location, crash time, traffic characteristics, road environment, speed limit, road type, traffic conditions and junction controls. Furthermore, the authors
included a variable to control for the temporal variation of road infrastructure and vehicle technology improvements. The findings suggested that being a male increased the
chances of a fatal or severe crash. Islam and Hossain (2015) found similar results, bicyclist and pedestrian males tended to be involved in more severe and fatal crashes as well. On the other hand, it is interesting to notice that driver age had an opposite effect on
12 the severity of the crash (not shown in (TABLE 5). Senior drivers tended to be more cautious than young drivers, which resulted in less fatal crashes (Zheng, 2014 ).
TABLE 5: Summary of demographic characteristics review
PEDESTRIAN STUDIES Author (year) Young
pedestrians (<15) Older pedestrians (>65) Male pedestrian Alcohol effects Wazana et al. (2000) ↑ Tay et al. (2011) ↑ ↓ Zhao et al. (2014) - Kim et al. (2008) ↑ ↑ Zheng (2014) ↑ Zhang et al. (2014) - Haleem et al. (2015) ↑ Islam and Hossain (2015) ↑ Eluru et al. (2008) ↑ ↑ ↑ McIntyre (2016) ↑ ↑ Li et al. (2016) ↑
Sze and Wong (2007) ↓ ↑ ↓ Abdul-Aziz et al. (2013) ↑ - Islam and Hossain (2015) ↑ ↑ McIntyre (2016) ↑
Lee and Abdel-Aty (2003) ↑ Kim et al. (1995) ↑ BICYCLIST STUDIES Kim et al. (2007) ↑ Islam and Hossain (2015) ↑ ↑ McIntyre (2016) ↓ Eluru et al. (2008) ↑ ↑ 3.5 Traffic conditions
The impact of traffic volume and speed was also statistically associated with non-motorized crashes and severity. Zheng (2014 ) suggested that as speed increased, the
severity of the crash increased as well. The study revealed that severity increases more rapidly if the impact speed goes from medium speed (25-50 mph) to high speed (>50 mph) rather than from low speed (<25 mph) to medium speed.
Kim et al. (2007) found that the likelihood of bicyclist fatalities and severe crashes increased with increases in the speed before the impact. As the impact increased beyond 20 mph, the probability of a severe or fatal crash increased substantially (Kim, Kim, G., & Porello, 2007).
In terms of traffic volume, Halem et al. (2015) found that an increase of AADT at signalized intersections significantly increased the probability of severe injuries.
Allen-Munley et al. (2004) developed an urban bicycle route safety rating model based on crash severity and risk factors. The authors developed a new injury index created from detailed New Jersey police crash reports, for the period 1997 to 2000. An ordinal logistic model was used to estimate the strength of the predictors on severity levels. The findings suggested that as AADT increased, severity decreased. This result is explained by another potential underlying effect, speed. When traffic volumes are high, the overall traffic speed is low, resulting in less severe crashes.
TABLE 6: Summary of traffic conditions review
PEDESTRIAN STUDIES
Author (year) Traffic volume Speed
Zhao et al. (2014) ↑ Zheng (2014) ↑ ↑ Halem et al. (2015) ↑ Christie (1995) ↑ Oh et al. (2005) ↑ Haleem et al. (2015) ↑ Allen-Munley et al. (2004) ↑ Li et al. (2016) ↑ Aziz et al. (2013) ↑
14
TABLE 6: Summary of traffic conditions review, continued
BICYCLIST STUDIES
Author (year) Traffic volume Speed
Kim et al. (2007) ↑
Allen-Munley et al. (2004) ↓
3.6 Road characteristics Number of lanes
Zheng (2014 ) used crash data (4,126 observations) from the Florida DOT to understand how different road and traffic characteristics were useful to predict crash severity. The authors used an ordered probit model to assess their hypothesis. Severity was defined according to the KABCO scale. The authors found that when a crash occurred in a four lane or six lane road, it was more likely to be severe or fatal than one occurring in a two lane road.
Abdul-Aziz et al. (2013) found that the number of lanes was a statistical significant predictor for severity level of crashes involving vehicles and pedestrians as well. Crashes on single lane roads in New York neighborhoods were less severe than crashes on
multilane roads.
Road width
Allen-Munley et al. (2004) found that wider streets resulted in more severe bicyclist crashes. This road typology was associated with higher operating vehicle speeds, which can cause dangerous interactions with the bicyclists.
Posted speed limit
Eluru et al. (2008) developed an ordered logit model to understand the effect of
bicyclists). Furthermore, an elasticity study was conducted to evaluate impact of the predictors on the probability of each level of severity. Data was collected from the general estimates system obtained from the National Highway Traffic Safety
Administration. The authors classified speed limit as a set of dummy variables (<25 mph, 25-50 mph, >50 mph) to understand its effect on non-motorized crash severity. Crashes tended to be more severe at roads with high posted speed limits. Zahabi et al. (2011) found that posted speed limit was not a statistically significant variable to explain bicyclist crash severity. The authors explained that drivers did not follow posted speed limits, making road geometry a better predictor. McIntyre (2016) also found that posted speed limit was only significant to predict pedestrian crash severity but not bicyclist crash severity. Pedestrian crashes that occurred on roads with a posted speed limit above 25 mph tended to be more severe and fatal than on roads with a lower speed limit.
Road classification
Findings suggested that pedestrian and bicyclist severity levels increased with arterials and freeways designated roads. Crashes at arterials were more dangerous than crashes at local roads (Zahabi, Strauss, & Miranda-Moreno, 2011). On another study, the authors found that bicyclists riding on roadways designated for high AADT and speeds (such as highways), were more likely to be severely injured if a crash occurred (Allen-Munley, Daniel, & Dhar, 2004).
McIntyre (2016) explored the pedestrian and bicyclist severity determinants in San Francisco. Built environment variables such as crosswalks and bicycle facilities were considered in the analysis. Severity was classified into four categories: complaint of pain, other visible injury, severe and fatal. The study used a logistic regression model to
16 determine the likelihood of a bicyclist or pedestrian severity level. The findings
suggested that crashes on major roads (highways) tended to be more severe than on other roads.
Road surface
Abdul-Aziz et al. (2013) used pedestrian crash data collected from New York City (2002-2006). A total of 4,666 observations were considered. The study classified severity in three categories: fatal, severe injury and property damage and injury. For a few
neighborhoods in New York, a wet surface was strongly associated with severe crashes (for the rest of the neighborhoods the findings were not significant). On the other hand, Halem et al. (2015) found that dry surfaces increased the likelihood of severe and fatal crashes possibly due to the increase on speeding and risky maneuvers.
Rural location
Even if there were more crashes in urban areas, crashes in cities are less likely to be fatal or severe than in rural areas. This finding can be attributed to the low speed limits
(Abdul-Aziz, Ukkusuri, & Hasan, 2013).
Intersections
Zahabi et al. found that pedestrian crashes at intersections were less severe than crashes at other sections of the roads. The finding was attributed to the low vehicle speeds at these locations. Islam and Hossain (2015) also found that crashes at intersections were found to increase the probability of non-injury crashes, for both pedestrians and bicyclists. The authors explained that users on the road were more cautious before making a decision.
Signalized intersections
Abdul-Aziz et al. (2013) suggested that crashes are less likely to be fatal at unsignalized intersections since drivers and pedestrians were more cautious while crossing.
Correspondingly, Zahabi et al. (2011) found that crashes at signalized intersections tended to be more dangerous for bicyclists due to the high number of conflicts with drivers. Sze and Wong (2007) found similar results.
Crosswalk
Haleem et al. (2015) assessed pedestrian crash severity levels at signalized and non-signalized locations. The authors analyzed a total of 4,923 pedestrian crashes in state roads in Florida. Data was verified and completed based on police reports and sketches. Severity was defined based on the KABCO scale. The findings suggested that standard crosswalks at unsignalized intersections were associated with 1.36% reduction in pedestrian severe injuries (Haleem, Alluri, & Gan, 2015). On the other hand, Sze and Wong (2007) findings suggested that crashes that occurred at a crosswalk or within 15m of it led to higher risk of mortality and severe injury compared to pedestrians walking on the sidewalk. This result was intuitive, even if pedestrians were somehow protected in crosswalks; they interacted with vehicles, increasing the risk of a crash. Similarly, Tay et al. (2011) found that crosswalks were conflict points of pedestrians and vehicle
interactions, resulting in a higher probability (compared to other road segments) of pedestrians getting severely injured.
18
TABLE 7: Summary of road characteristics review
PEDESTRIAN STUDIES Author (year) Major road classification Presence of a crosswalk Rural location Road width Number of lanes Wet road surface Posted speed limit Intersection location Signalized intersection Tay et al. (2011) ↑ ↑ ↑ ↑ ↑ Zheng (2014) ↑ Clifton et al. (2007) ↓ Seyed et al. (2011) ↑ ↓ Torbic et al. (2010) ↑ Tarko and Azam (2011) ↑ ↑ Haleem et al. (2015) ↓ - Li et al. (2016) ↑ Eluru et al. (2008) ↑ ↑ Sze and Wong (2007) ↑ ↑ ↑ Beck et al. (2016) ↑ 18
TABLE 7: Summary of road characteristics review, continued PEDESTRIAN STUDIES Author (year) Major road classification Presence of a crosswalk Rural location Road width Number of lanes Wet road surface Posted speed limit Intersection location Signalized intersection Islam and Hossain (2015) ↑ ↑ ↓ McIntyre (2016) ↑ ↓ ↑ Sasidharan et al. (2015) ↑ ↓ ↑ Zahabi et al. (2011) ↑ ↓ Abdul-Aziz et al. (2013) ↑ ↑ ↑ ↑ ↑ BICYCLIST STUDIES Zahabi et al. (2011) ↑ ↑ - ↑ ↑ Islam and Hossain (2015) ↑ ↑ ↓ Eluru et al. (2008) ↑ McIntyre (2016) ↑ - Allen-Munley et al. (2004) ↑ ↑ 19
20
3.7 Studies in Oregon
The ODOT Pedestrian and Bicycle Safety Implementation Plan (Kittelson & Associates,
Inc. 2014) was developed to identify the most unsafe locations along corridors in Oregon
with the highest potential for reducing frequency and severity of pedestrian and bicycle crashes.
Pedestrian and Bicyclist crash data (frequency and severity) for the period 2007 to 2011 were collected. Data on pedestrian volume was not available for the state of
Oregon, so vehicle traffic volume was used as a surrogate of pedestrian exposure to traffic. This section presents the main findings of the ODOT Pedestrian and Bicycle Safety Implementation Plan.
The results from this report reinforced the findings from the literature review. Pedestrian, bicyclist, and driver behavior characteristics, along with road and crosswalk features, had a strong association with pedestrian crash frequency. The authors revealed that time of the year, lighting conditions, midblock crossing, driver behavior, and alcohol / drug involvement were the main factors associated with pedestrians crashes. For bicyclist crashes, the authors found that most of the crashes occurred at intersections, caused by drivers turning right.
TABLE 8: ODOT Pedestrian and Bicycle Safety Implementation Plan findings
PEDESTRIAN BICYCLIST
Individual characteristics
The majority of impaired cases (by alcohol or drug involvement) involved an impaired pedestrian rather than an impaired driver.
The most common reported pedestrian error was jaywalking.
At intersections, the most frequent crash cause involved vehicles going straight and jaywalking.
Not available in the report
Temporal characteristics
The number of reported pedestrian crashes (from the ODOT Crash Analysis Reporting unit) increased between October and March.
Poor lighting conditions (with and without streetlights) was a factor in pedestrian crash frequency and severity.
Not available in the report
Road characteristics
80% of crashes in urban areas occurred in dark conditions.
At controlled intersections, left-turn crashes were more frequent because drivers failed to yield to pedestrians. However, the severity of “left hook” crashes is known to be less severe than collisions with pedestrians when the car is travelling straight. Controlled intersections with permitted or
protected/permitted left-turn phases were found to be a potential crash risk factor for pedestrians.
In rural areas, a low percentage of crashes involving vehicles making right turns and failing to yield to pedestrians were severe at both controlled and uncontrolled
intersections.
In urban areas, the majority of crashes occurred on arterials or collectors.
Additionally, the majority of severe crashes occurred on roadways with four lanes.
In urban areas, 45% of crashes occurred in locations with speed limits of 45 mph or higher.
Most of the crashes in rural areas (80%) occurred on roadways with speed limits above 45 mph.
The majority of crashes occurred in urban areas (for highways across Oregon, the proportion was 80%) (FIGURE 1 a)
Most of the crashes in Oregon Highways and the Portland Metro Area occurred at intersections.
In Oregon Highways, 63% of the crashes occurred on non-signalized intersections, while only 57% occurred at these locations in Portland intersections.
Half of severe crashes at signalized intersections occurred less than 100’ from a transit stop
Risk factors found from crash pattern analysis were driveway density, undivided 4-lane roadways, lack of bicycle facilities, presence of a traffic signal, AADT and posted speed limit. Almost 90% of the crashes
22
TABLE 8: ODOT Pedestrian and Bicycle Safety Implementation Plan findings, continued
PEDESTRIAN BICYCLIST
Crosswalk characteristics
The majority of pedestrian crashes that occurred away from intersections involved pedestrians attempting to cross at midblock locations and drivers failing to yield.
The proportion of crashes that occurred in locations without sidewalks is 45% and 80% in urban and rural areas, respectively.
In the Portland Metro Area, the majority of the crashes occurred at intersections (61%). At highways across Oregon, the proportion was the same for intersections and
segments. Crashes were more frequent at controlled intersections (62%) in the Portland Metro Area compared to
uncontrolled intersections. Along highways across Oregon, the proportion was higher at uncontrolled intersections (52%).
FIGURE 2 (a)
Not Applicable
Crash characteristics
In most of the severe crashes, the driver was going straight and failed to yield to
the pedestrian
Most common crashes at signalized intersections included right-hook and angle crashes
Most of the crashes at 2 lane roadways included a bicyclist going straight and a driver turning right.
The next figures (FIGURE 1 and FIGURE 2) show the distribution of pedestrian and bicyclist crashes in Oregon Highways and the Portland Metro Area. These figures are adapted based on the information available in the Kittelson & Associates report (2014). In FIGURE 1, observations are grouped by urban and rural areas. In FIGURE 2,
(a) (b)
FIGURE 1: (a) Pedestrian and (b) Bicyclist crashes by location. This figure is adapted from Kittelson & Associates, Inc. (2014)
For pedestrian and bicyclist crashes the distribution is similar. Most of the crashes occurred in urban areas, where most of the fatal and severe crashes are located as well. FIGURE 2 also highlights that there are almost 700 more bicyclist crashes than
pedestrian crashes. The authors mentioned that one of the key problems in Oregon was the lack of bicycle infrastructure in some high vehicle speed corridors.
24
(a)
(b)
FIGURE 2: (a)Pedestrian and (b)Bicyclist crashes by road characteristics and intersection type. This figure is adapted from Kittelson & Associates, Inc. (2014)
Additionally, most of the crashes occurred on intersections. In The Portland Metro Area, most of the pedestrian crashes occurred at signalized intersections while most of bicyclist crashes occurred at non-signalized intersections.
3.8 Summary
Substantial research efforts have been made on analyzing crash severity when a pedestrian and/or bicyclist are involved. The findings of this review have helped us to start answering some of the research objective of this study: what are the main risk factors associated to pedestrian and bicyclist crash severity, and how are these levels affected by exposure. The review suggested that variables linked to the participant
(driver, pedestrian, and bicyclist), road characteristics, environmental conditions, location characteristics, traffic conditions and crash characteristics are linked to severity. What is novel of approaching traffic safety in terms of severity and not crash frequency, is the fact that improvements and countermeasures can be implemented to protect vulnerable users and control for the randomness of some crash events.
Most of the studies reviewed (12 out of 12 for pedestrians, and 3 out of 4 for bicyclists) suggested that elder non-motorized travelers had a higher risk of being involved in a severe or fatal crash. These findings can be attributed to the fact that walking speed, visibility reaction time, and body resistance tended to be lower for this demographic group.
For gender, the trend was not as clear. Different studies (7) found contradictory results. The review of the literature did not conclude that men or women were involved in more severe or fatal crashes than the other gender. These findings were also different
26 than the ones found in studies that analyze crash rates, where male pedestrians had a higher likelihood of being involved in a crash than female pedestrians.
In terms of road characteristics, the literature review suggested that a major roads (7 out of 7 studies), rural areas (4 out of 4 studies), an increase in road width (2 out of 2 studies) and number of lanes (2 out of 7 studies), and posted speed limit (7 out of 7 studies), increased the likelihood of severe or fatal pedestrian crashes. For bicyclists, the trend was similar, with the only difference in posted speed limit. Only 1 study out of 3 found a statistical relationship with posted speed limit.
Another interesting result was found in studies that analyzed crashes at
intersections. Most of the studies (3 out of 4) found that the likelihood of a severe or fatal pedestrian crash at intersections was lower than that for segments. Furthermore, when the intersection was signalized, the probability of a severe or fatal crash increased (4 out of 4 studies).
Environmental conditions were found to be significant predictors of severity, for both pedestrians and bicyclists. Inclement weather, poor light time conditions (or nighttime), peak hours, and weekend days increased the likelihood of severe and fatal crashes.
In terms of exposure, we reviewed studies that explored land uses as a surrogate of pedestrian and bicyclist exposure. Researchers used land use to examine if areas with high pedestrian and bicyclist activity resulted in more severe crashes than other land use typologies. Commercial land use and big generators of pedestrian volumes were found to increase the probability of severe crashes for pedestrians. Furthermore, some studies found that land use designated as industrial is associated with less severe and fatal
found that when a school is present near the crash event, the likelihood of severe or fatal crash decreases. Schools tended to have better traffic management to reduce speeds, which protects vulnerable users.
The literature review revealed that as traffic volume and speed increase, the probability of a severe or fatal crash with a non-motorized participant increased. One study found that bicyclists were safer (in terms of severity) with higher volumes since speed tended to decrease under this condition. Moreover, 15 out of 15 studies have reported that an increase in vehicle size and weight increase the probability of a severe or fatal crash with a pedestrian or bicyclist involved.
A few studies have assessed the factors that may contribute to bicyclist crash severity. Finally, all of the studies reviewed showed that when a crash is caused by an alcohol intoxicated driver, the likelihood of a fatal or severe crash increased.
We also identified a gap in the literature in terms of the relationship between pedestrian and bicyclist crash severity. Countermeasures that were proposed to only one non-motorized travel mode may have a negative effect on likelihood of severity for the other mode.
TABLE 9: Literature review summary
VARIABLE DESCRIPTION CATEGORY Increase (↑) or decrease (↓) of fatal
or severe crash likelihood
Gender There is no statistically significant difference between women and
men in terms of crash severity
Female -
Male -
Age The likelihood of being involved in crash with severity level K or A is
higher for seniors and children
Children ↑
Adult
28
TABLE 9: Literature review summary, continued
VARIABLE DESCRIPTION CATEGORY Increase (↑) or decrease (↓) of fatal or severe crash likelihood
Posted Speed Limit
As posted speed limit increases, crash severity increases
↑ Streetlight
condition
No street lighting increases the likelihood of a fatal or severe
injured crash.
Present -
Not present ↑
Road surface Wet road surface increases the likelihood of a fatal or severe
injured crash.
Wet ↑
Dry -
Road Width As road width increases, crash severity increases
↑ Crosswalk The presence of a crosswalk
decreases the likelihood of a fatal or severe injured crash.
Present -
Not present ↑
Intersection Controlled intersections tend to have less fatal or severe crashes than uncontrolled intersections
Controlled -
Uncontrolled ↑
Road classification
Principal arterials tend to have more fatal or severe crashes than
other functional classes
Arterial ↑
Collector -
Local -
Number of lanes
As the number of lanes increase, crash severity increases
↑ Weather Clear day conditions tend to have
less fatal and severe crashes than other weather conditions (e.g. rain,
snow, fog) Clear day - Rainy day ↑ Snowy day ↑ Light conditions
Dark conditions increase the likelihood of a fatal or severe crash.
Dark ↑
Time of the day
Crashes that occurred at peak hours are more likely to result in a fatality
or severe injured output.
Peak hour ↑
Transit access There is no statistically significant difference between roads with and without transit access (stop/station)
in terms of crash severity
↑
Land use Industrial land uses tend to have more fatal or severe crashes
Residential -
Commercial -
Industrial ↑
Employment density
High employment density areas tend to have less fatal or severe
crashes
↑ Traffic
Volume
As traffic volume increases, crash severity increases
TABLE 9: Literature review summary, continued
VARIABLE DESCRIPTION CATEGORY Increase (↑) or decrease (↓) of fatal or severe crash likelihood
Vehicle size Fatal and severe crashes tend to occur when a heavy vehicle is
involved in the crash
↑ Alcohol
intoxication
Crashes caused by an alcohol intoxicated driver increased the
odds of fatal or severe crashes
30
4 DATA SOURCES
Pedestrian and bicyclist crash data for the years 2007 to 2014 was collected from the Oregon Statewide Crash Data System. The database consisted of fatal, bodily injury and damage to personal property (more than $1,500) traffic crashes. Crashes included those that occurred on city streets, county roads, and state highways. Only crashes that involved at least one motorized vehicle are reported in the database (e.g. the database does not contain information related to pedestrian-bicycle crashes or bicycle-bicycle crashes).
The database contained a total of 13,309 crashes, where 6,162 involved
pedestrians and 7,147 involved people riding a bicycle. Information related to the crash event, the characteristics of the vehicle, and participants involved was available in the database. Information on the crash event is collected by a police officer if this involved a fatality or severe injury. In Oregon, drivers also must file an accident and insurance report form with the DMV if there was a fatality or severe injury, or if the damage to the vehicle was over $1,500, or the damage to any other participant’s property was over $1,500. A significant number of crashes were underreported because not all the crashes met the thresholds to be reported, or the participants of the crash chose to not report. Studies (Washington, Haque, Oh, & Lee, 2014) (Yamamoto, Hashiji, & Shankar, 2008) have found that on average, around 50% of the property only damage crashes were reported in different cities. FIGURE 3 shows the path/process on how the crash event information is recorded in the Oregon Statewide Crash Data System.
FIGURE 3: Crash event processing
Finally, the database reported crash severity based on the five point KABCO scale. Severity level for each participant was recorded. At the crash level, severity was reported based on the most severe injury (e.g. if a crash involved two participants, one with A and the other with B injury, the crash severity is reported as A)
TABLE 10: KABCO severity scale
KABCO SCALE
DESCRIPTION
K Fatal Fatality information includes crashes that result in the death of a driver or a non-motorist within 30 days of the crash. A Incapacitated Injury of the participant prevents him/her from walking, driving
or normally continuing the activities he or she was capable of performing before the injury occurred.
B Visible Injury Injury to the participant which is evident to observers at the scene of the crash (e.g. bruises, cuts, lacerations, etc.)
C Complaint of
Pain
Participant claimed being injured, however the injury is not evident to observers (e.g. momentary unconsciousness,
complaint of pain, nausea, etc.)
O None There was no bodily harm to the participant.
Additional information on the Oregon State Highway System was collected from the Oregon Department of Transportation’s TransGIS database. The database contained georeferenced information of the roadway characteristics (e.g. pavement condition, number of lanes, lane width, AADT, road classification), safety (state and non-state crashes), and other themes (e.g. drainage, freight routes, rail network, public transit, road network, STIP projects, environmental protection, etc.)
Citizen/Officer complete report
DMV matches common crash reports. DMV records data for driver
info and insurance
.
ODOT codes crash into database
32 To account for the land use characteristics, we used the neighborhood concepts defined by Currans et al. (2015). For the Oregon census blocks, the researchers
categorized different land uses into a set of six neighborhood concepts (A to F). These concepts were defined based on activity density (number of residents and jobs per acre of unprotected land), employment entropy (distribution of retail, office, industrial, services, and entertainment jobs), and intersection density (the number of intersections in the road network per square miles). The classification scheme transitioned from dense, urban environments, A or B, towards rural, less dense environments, F. Crashes in ODOT’s facilities only occurred in concepts D, E and F. For a better illustration of these concepts, FIGURE shows images representing the different neighborhood concepts.
TABLE 11 describes the land use characteristics used to define the different neighborhood concepts.
FIGURE 4: Neighborhood Concept Types, adapted from Currans et al. (2015), continued
TABLE 11: Neighborhood concept characteristics
NEIGHBORHOOD CONCEPT TYPE
ACTIVITY DENSITY (RESIDENTS AND JOBS PER
ACRE) EMPLOYMENT ENTROPY (UNITLESS) INTERSECTION DENSITY (INTERSECTIONS PER SQUARE MILE) A-B 667 0.75 489 C 245 0.75 189 D 39 0.76 141 E 20 0.67 73 F 19 0.19 71
As shown in TABLE 11, Neighborhoods with a concept of A and B have a higher activity density and intersection density than the other concepts, while concept F, represents a more suburban area, with low activity and intersection density and,
employment entropy. For Oregon, only four of the six neighborhood concepts exist, C, D, E and F.
34 (a)
(b)
5 DESCRIPTIVE ANALYSIS
This descriptive analysis is intended to present the data and uncover patterns in terms of risk factors for crash severity and neighborhood concepts. This first approximation to the data includes all the crashes that occurred in Oregon. Section 6 and 7 will only focus on crashes that occurred in the Oregon Highway System. Crash data from the Oregon Statewide Crash Data System was grouped by intersection and segment based on the traffic control device information available at the crash level. Crashes at driveways, curves, and bridge structures were not taken into account due to the few observations available. Crash information is presented as the number of crashes reported. Furthermore, crashes were grouped by neighborhood concept (Currans, Gherke, & Clifton, 2015) to account for the differences in built environment in the likelihood of a crash occurrence.
5.1 General Trends
A total of 3,629 pedestrian crashes occurred at intersections from 2007 to 2011. Additionally, 1,822 pedestrian crashes occurred on road segments. The majority of the crashes occurred in neighborhood concept D, followed by E, F and C. As seen in Figure 5, the urban metropolitan areas in Oregon were mainly defined as concept D and E, which explains why fewer pedestrian crashes occurred in concept C (188 pedestrian crashes).
In terms of crash severity, the findings suggested that injury level B had the largest number of crashes at intersections and segments. For areas with neighborhood concept C, there has been an increase of these crashes during the last decade.
36 By comparing crashes at segments and intersections across the years, one result stood out. There were more fatal (K) and incapacitated (A) crashes on road segments than at intersections. On segments of the road, vehicles tended to drive faster.
TABLE 12: Statewide pedestrian crashes by neighborhood concepts and year
Neighborhood Concept C
Year Intersection (%) Segment (%)
K A B C O K A B C O 2007 0 14 4 7 0 0 0 0 0 0 2008 0 21 6 15 0 0 8 11 0 0 2009 0 0 19 4 0 0 15 11 0 0 2010 0 14 16 16 0 0 31 11 0 0 2011 0 0 15 19 0 100 8 22 0 0 2012 0 21 12 22 0 0 15 22 0 0 2013 100 7 11 10 100 0 0 11 0 0 2014 0 21 17 6 0 0 23 11 0 0 Total 1 14 81 68 1 1 13 9 0 0 Neighborhood Concept D
Year Intersection (%) Segment (%)
K A B C O K A B C O 2007 7 9 9 8 19 15 15 11 13 0 2008 19 11 9 10 6 9 14 10 16 20 2009 11 11 11 9 19 9 8 10 13 20 2010 4 8 14 14 0 11 17 16 12 0 2011 6 15 13 16 6 17 11 12 16 20 2012 17 14 12 15 13 13 15 15 14 0 2013 15 14 15 13 25 15 13 13 9 20 2014 22 19 18 15 13 11 7 13 8 20 Total 54 173 852 638 16 46 111 298 160 5
TABLE 12: Statewide pedestrian crashes by neighborhood concepts and year, continued
Neighborhood Concept E
Year Intersection (%) Segment (%)
K A B C O K A B C O 2007 17 10 9 5 6 10 13 11 10 10 2008 8 11 9 7 0 14 13 9 13 10 2009 8 9 10 11 25 7 15 12 19 20 2010 10 16 12 11 6 20 11 13 11 10 2011 17 15 14 13 6 9 16 14 14 30 2012 19 12 17 17 6 16 12 16 12 0 2013 6 15 14 17 38 13 10 15 8 20 2014 15 12 16 18 13 12 10 10 12 0 Total 48 146 588 471 16 117 148 345 193 10 Neighborhood Concept F
Year Intersection (%) Segment (%)
K A B C O K A B C O 2007 25 17 10 3 0 14 22 11 10 0 2008 0 4 4 10 14 14 12 10 12 0 2009 0 13 8 8 14 11 12 8 12 0 2010 19 9 11 19 0 19 11 11 9 0 2011 6 11 13 15 14 9 14 15 16 0 2012 13 13 22 17 29 7 14 15 10 50 2013 25 9 17 12 14 12 9 15 12 0 2014 13 23 14 15 14 14 6 15 18 50 Total 16 53 230 156 7 57 65 175 67 2
In terms of bicyclists, there were 4,702 crashes that occurred in intersections, and 864 that occurred in road segments. Most of the crashes resulted in injury B as well. Furthermore, there has been an increase of injury A and B crashes on roads located in neighborhood concept D and E over the period studied.
The number of fatal crashes at intersections and on road segments has been similar, but for the rest of the severity levels, intersections have carried the majority of the crashes. This finding contrasted with the pedestrian findings, where most of the fatal and severe crashes were at segments.
38
TABLE 13: Statewide bicyclist crashes by neighborhood concepts and year
Neighborhood Concept C
Year Intersection (%) Segment (%)
K A B C O K A B C O 2007 0 36 10 9 0 0 20 14 0 0 2008 0 18 7 18 0 0 0 7 0 0 2009 0 9 16 11 0 0 40 14 0 0 2010 0 9 12 14 50 0 20 14 0 0 2011 50 9 13 14 25 0 0 7 67 0 2012 50 9 17 5 0 0 0 14 0 50 2013 0 9 16 11 25 0 20 7 0 0 2014 0 0 10 18 0 0 0 21 33 50 Total 2 11 94 44 4 0 5 14 3 2 Neighborhood Concept D
Year Intersection (%) Segment (%)
K A B C O K A B C O 2007 30 13 8 9 14 0 16 10 10 0 2008 20 20 11 11 10 0 9 15 14 8 2009 10 10 11 12 16 43 22 9 15 17 2010 10 8 15 12 12 0 6 11 18 17 2011 10 12 13 13 11 14 6 14 10 8 2012 0 16 14 16 7 14 9 17 13 17 2013 10 10 14 13 21 14 9 11 9 17 2014 0 12 15 14 14 14 22 15 11 17 Total 10 145 1288 721 94 7 32 186 92 12 Neighborhood Concept E
Year Intersection (%) Segment (%)
K A B C O K A B C O 2007 21 12 9 7 6 29 19 12 8 27 2008 29 15 10 11 10 0 13 10 10 0 2009 0 13 11 12 15 7 3 13 16 27 2010 7 6 14 13 6 7 13 11 6 7 2011 21 15 14 13 9 29 10 8 13 0 2012 14 11 16 16 18 21 13 17 12 7 2013 0 18 13 13 15 0 10 16 16 13 2014 7 11 13 15 21 7 19 13 19 20 Total 14 131 937 502 67 14 31 190 83 15
TABLE 13: Statewide bicyclist crashes by neighborhood concepts and year, continued
Neighborhood Concept F
Year Intersection (%) Segment (%)
K A B C O K A B C O 2007 17 8 7 6 0 33 0 11 13 0 2008 0 8 10 9 6 17 7 3 0 50 2009 0 8 12 13 6 17 20 15 6 0 2010 17 6 16 16 18 17 7 9 10 0 2011 17 17 15 12 18 17 27 12 29 0 2012 0 17 15 15 29 0 20 15 23 0 2013 17 17 13 11 18 0 7 19 10 50 2014 17 19 13 18 6 0 13 17 10 0 Total 6 36 379 198 17 6 15 124 31 2
5.2 Pedestrian and bicyclist characteristics
Two variables were assessed for pedestrian and bicyclist characteristics: age and gender. For pedestrians, the findings suggested that most of the severity level K and A crashes involved a pedestrian older than 45 years old (for neighborhood concept E, 60% of the fatal crashes involved a pedestrian older than 55). This finding is similar to the findings from the literature review: as people get older, the likelihood of a fatal and severe crash increased due to the reduction in visibility, reaction time, and body resistance. Another vulnerable population, pedestrians younger than 12 years old, were found to made up to 9% of the fatal crashes and 13% of the severity level A crashes for the different