Association for Information Systems
AIS Electronic Library (AISeL)
PACIS 2010 Proceedings
Pacific Asia Conference on Information Systems
(PACIS)
2010
Cost-Sensitive Learning for Recurrence Prediction
of Breast Cancer
Tsang-Hsiang Cheng
Southern Taiwan University, [email protected]
Ci-Wei Lan
IBM Research Collaboratory, [email protected]
Chih-Ping Wei
National Taiwan University, [email protected]
Henry Chang
IBM T.J. Watson Research Center, [email protected]
Follow this and additional works at:
http://aisel.aisnet.org/pacis2010
This material is brought to you by the Pacific Asia Conference on Information Systems (PACIS) at AIS Electronic Library (AISeL). It has been accepted for inclusion in PACIS 2010 Proceedings by an authorized administrator of AIS Electronic Library (AISeL). For more information, please [email protected].
Recommended Citation
Cheng, Tsang-Hsiang; Lan, Ci-Wei; Wei, Chih-Ping; and Chang, Henry, "Cost-Sensitive Learning for Recurrence Prediction of Breast Cancer" (2010).PACIS 2010 Proceedings. 118.
COST-SENSITIVE LEARNING FOR RECURRENCE
PREDICTION OF BREAST CANCER
Tsang-Hsiang Cheng, Department of Business Administration, Southern Taiwan University,
Taiwan, R.O.C., [email protected]
Ci-Wei Lan, IBM Research Collaboratory, IBM, Taiwan, R.O.C., [email protected]
Chih-Ping Wei, Department of Information Management, National Taiwan University,
R.O.C., [email protected]
Henry Chang, IBM T.J. Watson Research Center, IBM, USA, [email protected]
Abstract
Breast cancer is one of the top cancer-death causes and specifically accounts for 10.4% of all cancer incidences among women. The prediction of breast cancer recurrence has been a challenging research problem for many researchers. Data mining techniques have recently received considerable attention, especially when used for the construction of prognosis models from survival data. However, existing data mining techniques may not be effective to handle censored data. Censored instances are often discarded when applying classification techniques to prognosis. In this paper, we propose a cost-sensitive learning approach to involve the censored data in prognostic assessment with better recurrence prediction capability. The proposed approach employs an outcome inference mechanism to infer the possible probabilistic outcome of each censored instance and adopt the cost-proportionate rejection sampling and a committee machine strategy to take into account these instances with probabilistic outcomes during the classification model learning process. We empirically evaluate the effectiveness of our proposed approach for breast cancer recurrence prediction and include a censored-data-discarding method (i.e., building the recurrence prediction model by only using uncensored data) and the Kaplan-Meier method (a common prognosis method) as performance benchmarks. Overall, our evaluation results suggest that the proposed approach outperforms its benchmark techniques, measured by precision, recall and F1 score.
Keywords: Recurrence Prediction, Cost-Sensitive Learning, Survival Analysis, Breast Cancer, Data Mining
1
INTRODUCTION
Breast cancer, the most common cancer among women in many countries (Calle 2004), is a malignant tumor that develops when cells in the breast tissue divide and grow without the normal controls on cell death and cell division (Jerez-Aragonés et al. 2003; Delen et al. 2005). In 2004, breast cancer claimed 519,000 lives around the globe. It accounts for 1% of all the deaths in the world (Khan et al. 2008). In Taiwan, breast cancer is also the first leading cause according to the statistics from Bureau of Health Promotion of Taiwan. To improve the efficiency of patient management tasks such as diagnosis and treatment planning, the prediction of clinical outcome of patients after breast cancer surgery is essential. Various treatment modalities exist for many solid tumor types and their use is well established. However, the toxicity of some treatments is often observed. As there is a real risk of mortality associated with treatment, it is vital to offer different therapies depending on patient status. In this sense, to predict whether a patient will suffer a recurrence of her disease is very important, so that the risks and expected benefits of specific therapies can be compared (Jerez-Aragonés et al. 2003). Among different prognostic modeling techniques that induce models from medical data, survival analysis methods are specific both in terms of modeling and the type of data required (Jerez-Aragonés et al. 2003). Data for survival analysis normally include a censor variable, which indicates whether some outcome under observation (e.g., recurrence of or death caused by breast cancer) has occurred within a certain follow-up period. However, the observation period for some patients may be shorter than the prespecified follow-up period and the observed event has not occurred during their observation period. Such patients are referred as censored data, because the outcomes (i.e., whether the observed event will occur) of these patients are unknown by the end of the follow-up period. Traditional statistical techniques, such as Kaplan-Meier analysis and Cox-Propositional hazard models have been developed for survival estimation. Those methods, however, suffer from major drawbacks in which certain assumptions must be satisfied. For example, the Kaplan-Meier method assumes the independence of censoring times, whereas the Cox-Propositional method assumes the non-changeable strength of a prognostic factor over time (Ritthipravat 2009; Jerez-Aragonés et al. 2003).
With the advancement in the field of data mining (or more specifically machine learning), various methods have come into existence. These methods have demonstrated their advantages over traditional statistical methods in various domains. For instance, data mining methods have been applied to construct various recurrence prediction models in the medical domain (Ali et al. 2009; Ohno-Machado 2001; Jerez et al. 2005; Lucas & Abu-Hanna 1999; Zupan et al. 2000). When applying a data mining technique to construct a classification model from a survival dataset that includes censored data, prior studies typically adopt a simple approach by removing these censored data from the survival dataset before the training proceeds. However, this approach decreases the size of the dataset for training purpose and, when the amount of censored data is relatively large, will degrade the effectiveness of the resultant classification model (Zupan et al. 2000). To address this limitation, we propose in this study an approach that allows us to adequately exploit censored data in a survival dataset when constructing a recurrence classification model. Specifically, we develop an outcome inference mechanism, on the basis of the k-nearest neighbor method, to infer the possible outcome of each instance of the censored data as well as to estimate the probability of the inferred outcome for each instance. Because these instances in the censored data are associated with probabilistic rather than deterministic outcomes, we subsequently employ a cost-sensitive learning algorithm to train a classification model from this focal a survival dataset.
The remainder of this paper is organized as follows. In Section 2, we review common prognosis factors for breast cancer, traditional survival analysis methods, and prior studies on using data mining methods for breast cancer prognosis. We detail our proposed approach in Section 3. We then detail our evaluation design and discuss some important evaluation results in Section 4. We conclude with a summary and discussions of the study’s contributions in Section 5.
2
LITERATURE REVIEW
In this section, we review literature related to common prognosis factors for breast cancer, traditional survival analysis methods, and prior studies on using data mining techniques for breast cancer prognosis.
2.1 Prognostic Factors for Breast Cancer and Taiwan Cancer Registry
Prognostic factors are used to aid clinical decision making and help select appropriate treatments for individual patients. Most recent decisions for breast cancer patients are made on the basis of prognostic and predictive factors. Two main categories of the prognostic factors for breast cancer include chronological factors and biological factors. The chronological factors are indicators of how long the cancer has been present, and the biological factors are indicators of the potential behavior of a tumor. The chronological factors include node status, tumor size, and tumor grade, while the biological factors include estrogen receptor and progesterone receptor (Bundred 2001; Delen et al. 2005).
The Taiwan Cancer Registry was founded in 1979. Hospitals in Taiwan with greater than 50-bed capacity that provide outpatient and hospitalized cancer care were recruited to participate in reporting all newly diagnosed cancer cases to the registry. It routinely collects data on patient demographics, primary tumor site, tumor morphology and stage at diagnosis, first course of treatment, and follow-up for vital status.
In this study, we use seventeen descriptive variables from Taiwan Cancer Registry for the breast cancer recurrence prognosis. The seventeen variables include three patient demographics variables, four chronological factor variables, four biological factor variables, and six course-of-treatment descriptive variables. Three patient demographic variables include the follow-up duration, age, and recurrence status. Four chronological factors are pathological tumor size, number of regional lymph nodes, number of regional invaded lymph nodes, and tumor staging. Four biological factors are histopathological pattern, degree of cell differentiation, estrogen receptor, and progesterone receptor. Finally, six descriptive variables for course of treatment include clearness of surgical margin, resection of peripheral lymph node, surgery for primary tumor, chemo therapy, radio therapy, and hormone therapy.
2.2 Traditional Survival Analysis Methods
Survival analysis methods involve the modeling of time to event data. In medical research, a survival analysis method deals with how to estimate the survival of a particular patient suffering from a disease over a particular time period. Survival analysis is also a popular tool used in clinical trials where it is well suited to deal with incomplete data. Kaplan-Meier analysis (Kaplan & Meier 1958) and Cox-Propositional hazard model (Cox 1972) are two well-known conventional statistical techniques for survival analysis.
The Kaplan-Meier analysis is a non-parametric technique for estimating time-related events. In medical research, Kaplan-Meier analysis is used to measure the fraction of patients living for a certain amount of time after treatment. An important advantage of the Kaplan-Meier analysis is that it incorporates information from all of the observations available, both censored and uncensored, by considering any point in time as a series of steps defined by the observed survival and censored times. In graphical terms, a plot of the proportion of patients surviving against time is a series of horizontal steps of declining magnitude (Kaplan & Meier 1958; Utley 2000). The formulation of Kaplan-Meier analysis is: Let S(t) be a survival function that gives the probability of surviving or having a lifetime exceeding time t. For a sample from this population of size N, let the observed times until experienced an event of the N sample members be: t1 ≤ t2 ≤ t3 ≤ … ≤ tN. Corresponding to each ti is ni (i.e., the
Kaplan-Meier estimator is a nonparametric maximum likelihood estimate of S(t) and is a product of the form: S^(t) =
∏
ti≤t ni− di
ni .
Cox’s proportional hazards model (Cox 1972) attempts to separate out the time dependent survival information from all factors specific to patients. It allows estimating the relationship between covariates and a possibly censored failure time. This is achieved by assuming that the time dependence of the survival probability can be factored out according to:
hi(t)= h0(t)exp(Xiβ)
where hi(t) denotes the hazard for individual i, with attributes Xi, at time t, referred to the observed hazard h0(t) of a baseline population which measures the risk of experienced an event at time t.
2.3 Data Mining Techniques for Breast Cancer Prognosis
With advances in the field of machine learning (or broadly data mining), a new stream of methods have came into existence. These methods generally are proved to be more effective as compared to traditional statistical methods (Ohno-Machado 2001). Most data mining techniques employed for cancer prediction and prognosis belong to supervised learning. The major types of the data mining techniques employed include: artificial neural networks (ANNs), decision trees (DTs), and k-nearest neighbor algorithms (Cruz & Wishart 2006).
ANNs are originally designed to model the way the brain works with multiple neurons being interconnected to each other through multiple axon junctions. Just as with biological learning, the strength of neural connections is strengthened or weakened through repeated training or reinforcement on labeled training data (Rumelhart et al. 1986).
Tumor-node-metastasis (TNM) staging system is a physician-based expert system for the estimation of prognosis of breast cancer patients. The proliferation of factors in breast cancer has lead to clinical confusion, but the system just relies heavily on the subjective opinion of a pathologist or expert clinician and cannot accommodate these new factors (Burke et al. 1997). Clearly, the TNM system is unsatisfactory for optimal-treatment decision-making and for patient counseling. In response, Burke et al. (1997) investigated the predictive accuracy of ANNs with the data of breast cancer and colorectal cancer in PCE (Patient Care Evaluation) dataset and the breast cancer data in the SEER (Surveillance, Epidemiology, and End Results) dataset. Their evaluation results suggest that the ANNs model is more accurate than the traditional TNM model on predictive accuracy. De Laurentiis et al. (1999) also employed ANNs to develop an automatic prognostic model to predict the relapse probability for breast cancer patients. By comparing the performance using a receiver operator characteristic (ROC) curve, the developed ANNs model outperforms the classical TNM system on predicting relapse of breast cancer. Furthermore, Lundin et al. (1999) also investigated the prediction accuracy of ANNs and logistic regression model on breast cancer survival. Their experiment results also show that ANNs achieve better prediction performance than the logistic regression model does.
The design and structure of an ANN should be customized for each application because a simple generic ANN architecture can lead to very poor performance or extremely slow training. ANNs are considered a black-box technology and it is almost impossible to discern how it performs its classification (Cruz & Wishart 2006; Chi et al. 2007; Khan et al. 2008). Unlike neural network, decision trees (DTs) have always been praised for comprehensibility of their knowledge representation and inference procedures. Moreover, DTs have many advantages: they are simple to understand and interpret, they require little data preparation, they can handle various types of attributes, and they are efficient in terms of learning and generating robust classifiers. Quinlan’s ID3, C4.5, and C5 are popular decision tree algorithms (Ali et al. 2009).
Delen et al. (2005) compared ANNs, DTs, and logistic regression model for the prediction of breast cancer survivability using a large dataset containing more than 200,000 cases. Their evaluation results conclude that DTs based on the C5 algorithm is the best classifier in their experimental environment and ANNs is the second. Khan et al. (2008) investigated how to use fuzzy logic to extensively
increase the effectiveness of DTs on prognosis of breast cancer survivability and proposed a weighted and fuzzified decision tree method.
Jerez-Aragonés et al. (2003) proposed a new technique that is a combination DT and ANN for prognosis of breast cancer relapse. They consider that the strength of the prognostic factor is not the same at different time interval, and classify the original 1035 patients into ‘‘relapse’’ and ‘‘nonrelapse’’ classes for each time interval to deal with the censoring problem. The DT in the combined model is used for the selection of the most relevant prognostic factors for each time interval. Subsequently, the ANN at each time interval in the combined model takes as inputs these selected variables to reach good prediction performance.
3
DESIGN OF THE COST-SENSITIVE LEARNING APPROACH
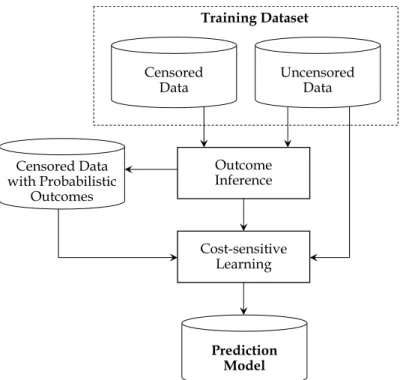
We propose a cost-sensitive learning approach for breast-cancer recurrence prediction. In order to utilize the information of censored data, we take such data uncertainty as the cost of misclassification. Based on the cost-proportionate rejection sampling, we can build a committee machine with better prediction capability. As we show in Figure 1, the proposed cost-learning approach comprises two main phases, including outcome inference for censored data and cost-sensitive learning for constructing a prediction model. The particular problem of censored data used for building a prediction model is that the follow-up of some patients is too short to determine definite outcomes for these patients. When we build a prediction model for a specific time t, the outcomes of the patients with follow-up time less than t are considered as uncertain, and these cases traditionally are discarded by prior studies employing data mining techniques when constructing a classification model. With a given prediction time t, we need to split the training dataset into two groups: the first group consists of patients without recurrence and tracked less than t after their operations and patients in the second group are followed-up more than t (i.e., uncensored data). Obviously, the recurrent status of first group (i.e., censored data) is uncertain and we need to estimate the probability of their possible outcomes before the construction of a prediction model. As for the second group (i.e., uncensored data), their outcomes are definite (either with the status of non-recurred or recurred). Accordingly, the outcome inference phase estimates the recurrence probability of each instance in the censored data on the basis of its nearest neighbors in the uncensored data. Subsequently, with the consideration of the censored data that are associated with probabilistic rather than deterministic outcomes, we then employ the cost-proportionate rejection sampling to construct several classifiers. Therefore, we are able to conduct predictions in a committee-decision manner. In the following, we detail the design of each phase in our proposed approach.
3.1 Outcome Inference phase
In the outcome inference phase, we infer the possible outcome for each instance in the censored data by calculating its distance to all instances in the uncensored data. The distance between an instance ci
in the censored data and an instance nj in the uncensored data is estimated by the following equation:
(
)
(
)
∑
=×
−
×
=
k r r j r i r r j in
w
A
c
A
n
f
c
1)
(
)
(
)
,
(
distance
where Ar(ci) is the value of attribute r for the censored instance ci, Ar(nj) is the value of attribute r for the uncensored instance nj, wr is a weighted function for attribute r, and fr is the scale normalization function for attribute r to ensure that the distance between ci and nj with respect to attribute r lies between 0 and 1. In this study, the weighted function for attribute r (i.e., wr) is estimated by the gain-ratio measure derived from the set of uncensored instances in the input training dataset.
Censored Data Outcome Inference Uncensored Data Training Dataset Censored Data with Probabilistic Outcomes Cost-sensitive Learning Prediction Model
Figure 1 Overall Process of the Proposed Approach
Once the distances between the censored instance ci and all uncensored instances are estimated, we then select neighbors (from the uncensored instances) for ci. Specifically, given a prespecified distance threshold δ, we select those uncensored instances whose distances with ci are no greater than
δ as the neighbors of ci. Assume that the average distance of ci to the selected neighbors pertaining to the recurrent class is dist_R andthe average distance to the selected neighbors belonging to the non-recurrent class is dist_NR. By comparing dist_R and dist_NR, ci is assigned to the closest class. We not only infer the possible outcome for ci but also assign a probability cf(ci) to the inferred class. In this study, cf(ci) is calculated as follows:
cf(ci) =
⎩
⎨
⎧
1 – totdist_dist_R if ci is assigned to the recurrent class R1 – disttot__distNR if ci is assigned the non-recurrent class NR.
where dist_R = a a i
n
of
n
c
#
)
,
distance(
∑
, na denotes a selected neighbor belonging to the recurrent class R, dist_NR = b b in
of
n
c
#
)
,
distance(
∑
, na denotes a selected neighbor belonging to the non-recurrent class NR, tot_dist = dist_R + dist_NR. For each na and nb, distance(ci, na) ≤δ and distance(ci, nb) ≤δ.3.2 Cost-sensitive Learning phase
The construction of an automated recurrent prediction model with the expansion of the censored instances with differential outcome probabilities resembles cost-sensitive learning that performs learning to build an ensemble classifier against training data with non-uniform distribution weights (Zadrozny et al. 2003). Several cost-sensitive learning methods have been proposed in the literature (Domingos 1999; Drummond & Holte 2000; Fan et al. 1999, Margineantu 2002; Zadrozny et al. 2003); among them, applying a sampling method to sample training instances from the original training dataset—on the basis of their respective outcome probabilities—and use them to construct an automated classifier with an appropriate classification learning algorithm seems effective and
computationally efficient. By doing so, we can transform a sensitive learning problem to a cost-insensitive learning task (Zadrozny et al. 2003).
We accordingly adopt this method in our cost-sensitive learning phase, wherein our approach performs two tasks: censored data sampling and classifier learning. Specifically, for the censored data sampling, the proposed approach employs the cost-proportionate rejection sampling (Von Neumann 1951) to randomly select from the set of censored instances and include them for training purpose. When deciding whether to include a censored instance ci, the cost-proportionate rejection sampling first generates a random number ri ranging from 0 to 1 and then compares with the acceptance probability cf(ci)/Z of the instance under evaluation, where Z is a predefined constant. As suggested by Zadrozny et al. (2003), the constant Z is often assigned as the maximal cf(ci) value across all censored instances. A censored instance ci will be excluded from the sample if ri is larger than its acceptance probability, or be included otherwise. In addition, for all uncensored instances, because they are associated with definite outcomes (non-recurrent or recurrent), we thus include all of them in the sample.
Furthermore, our approach adopts a committee machine strategy; i.e., we repeat the abovementioned sampling process k times to generate k sets of training samples. For each set of training samples, we perform the classifier learning task. Specifically, we employ C4.5 as the underlying learning algorithm to construct a classifier for each given set of training samples. As a result, k classifiers are generated and together form a committee to give a recurrence warning for a patient after operation if more than half of the classifiers predict that recurrence event will happen.
4
EMPIRICAL EVALUATION AND RESULTS
We empirically evaluate the effectiveness of our proposed approach using 224 breast cancer cases collected from a tertiary medical center in northern Taiwan. Our evaluation includes a censored-data-discarding method (i.e., employing C4.5 to build a recurrence prediction model by only using uncensored data) and the Kaplan-Meier method (a common prognosis method) as performance benchmarks. In the following, we detail the data collection and evaluation design and then discuss important evaluation results.
4.1 Data Collection
We collected 362 operation cases, which were clinically administered between January 2004 and December 2006 at a tertiary medical center in northern Taiwan. Subsequently, we performed a data cleaning procedure in which 138 incomplete cases were deleted. As a result, the dataset for our empirical evaluation involves 224 cases without missing attribute values. Each case is described with 17 variables recorded in the cancer registry database of Bureau of Health Promotion, Taiwan. The 17 variables are the follow-up duration, age, histopathological pattern, degree of Cell differentiation,
pathological tumor size, number of regional lymph nodes, clearness of surgical margin, tumor
staging, estrogen receptor, progesterone receptor, resection of peripheral lymph node, surgery
for primary tumor, chemotherapy, radiotherapy, and recurrence (used to determine outcome
classes with respect to a specific time
t
)
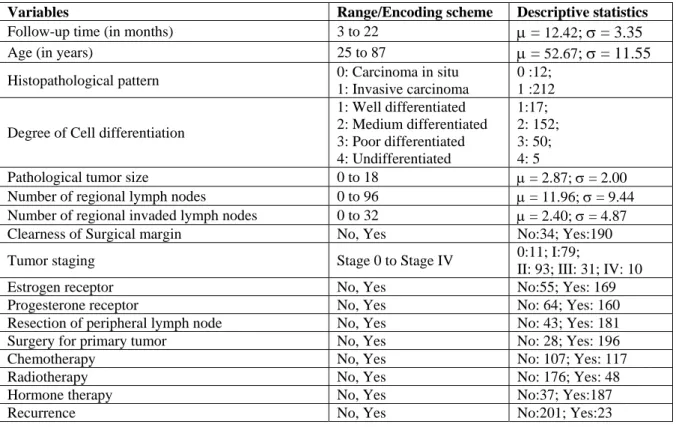
.Table 1 provides a summary of the descriptive
statistics of our cases.
Variables Range/Encoding scheme Descriptive statistics Follow-up time (in months) 3 to 22 μ = 12.42; σ = 3.35
Age (in years) 25 to 87 μ = 52.67; σ = 11.55 Histopathological pattern 0: Carcinoma in situ
1: Invasive carcinoma
0 :12; 1 :212 Degree of Cell differentiation
1: Well differentiated 2: Medium differentiated 3: Poor differentiated 4: Undifferentiated 1:17; 2: 152; 3: 50; 4: 5
Pathological tumor size 0 to 18 μ = 2.87; σ = 2.00 Number of regional lymph nodes 0 to 96 μ = 11.96; σ = 9.44 Number of regional invaded lymph nodes 0 to 32 μ = 2.40; σ = 4.87 Clearness of Surgical margin No, Yes No:34; Yes:190 Tumor staging Stage 0 to Stage IV 0:11; I:79;
II: 93; III: 31; IV: 10 Estrogen receptor No, Yes No:55; Yes: 169 Progesterone receptor No, Yes No: 64; Yes: 160 Resection of peripheral lymph node No, Yes No: 43; Yes: 181 Surgery for primary tumor No, Yes No: 28; Yes: 196
Chemotherapy No, Yes No: 107; Yes: 117
Radiotherapy No, Yes No: 176; Yes: 48
Hormone therapy No, Yes No:37; Yes:187
Recurrence No, Yes No:201; Yes:23
Table 1: Summary of Attributes of Our Breast Cancer Cases
4.2 Evaluation Design
The particular characteristic of survival data is that for some patients the follow-up is too short to determine a definite outcome. In this study, we want to predict the recurrence status of the breast cancer patient after 12 months of the operation. First, We divide the dataset into two groups: the first group (i.e., censored data) consists of non-recurrent patients with follow-up less than 1 year (i.e. their one-year recurrent outcomes are uncertain), the second group are the uncensored data that contain non-recurrent cases tracked for more than 1 year after receiving operation (they are assumed to be non-recurrent cases under 1 year prediction setup) and recurrent cases in which patients whose recurrences have been observed within 1 year window. Accordingly, 108 instances in our 224 collected cases dataset are censored instances and 116 are uncensored instances (101 non-recurrent cases and 15 recurrent cases respectively).
We use a stratified three-fold cross-validation strategy to evaluate our proposed cost-sensitive learning method and the two benchmark methods, including the censored-data-discarding method and the Kaplan-Meier method. The cross-validation strategy divides the original dataset into three subsets of approximately equal size and equal distribution of recurrent and non-recurrent cases. Accordingly, each subset is used for testing purpose and the other two subsets are employed for training purpose. To minimize potential biases resulting from the randomized sampling as well as to obtain more reliable performance estimates, we perform the three-fold cross-validation process 10 times. That is, the effectiveness of each technique under investigation is obtained by averaging the performance recorded from the 30 trials.
We evaluate the effectiveness of each technique by examining its prediction of recurrence’s precision, recall, and F1 score (Rijsbergen 1979), as follows:
F1 =2×PrecisionPrecision+×RecallRecall where Precision= TP
TP+FP, Recall = TP
TP+FN, TP represents the number of testing instances correctly
in the non-recurrent class, FP is the number of testing instances incorrectly classified as in the recurrent class, FN denotes the number of testing instances incorrectly classified as in the non-recurrent class.
4.3 Evaluation Results
We conduct a series of parameter-tuning experiments to select an optimal configuration of parameter values required by the proposed technique. Specifically, our proposed technique involves two parameters: δ (i.e., distance threshold for selecting neighbors for each censored instance in the outcome inference phase) and k (i.e., the number of classifiers to construct in the cost-sensitive learning phase).
We first set k to 15 and examine δ between 0.2 to 0.8 in increments of 0.1. When settingδ to 0.6, our proposed technique reaches the highest F1 value. Thus, we employ 0.6 for δ in subsequent experiments. We then investigate k between 7 and 55 in increments of 4. Our tuning-experiment result suggests that the best F1 value is achieved when setting k as 15.
For the Kaplan-Meier method, we use the threshold of 0.5 to determine the predicted class for each testing instance. That is, the testing instances with Kaplan-Meier estimators higher than 0.5 are predicted as in the non-recurrent class, otherwise the recurrent class. As summarized in Table 2, our proposed technique outperforms the censored-data-discarding method and the Kaplan-Meier method in all evaluation metrics investigated (i.e., F1 score, recall, and precision for the recurrent classes). Because the non-recurrent class represents the majority class in our dataset (i.e., 108 non-recurrent cases v.s. 15 recurrent cases), such class asymmetry biases the prediction of the Kaplan-Meier method, whose prediction is based on conditional probability. On the other hand, the censored-data-discarding method based on C4.5 is able to mitigate the bias causing by overwhelming majority with its learning ability. Furthermore, our evaluation results demonstrate the utility of the censored data for improving the prediction effectiveness. Particularly, the recurrence prognosis effectiveness attained by our proposed technique is at least two times higher than that of traditional censored-data-discarding method. We further test the performance differences by two-tails t-test examinations. As we illustrate in Table 3, our proposed cost-sensitive learning approach significantly outperforms the censored-data-discarding method and the Kaplan-Meier method.
Technique F1 (%) Recall (%) Precision (%)
Cost-Sensitive Learning 34.51 29.33 41.90
Censored-Data-Discarding 6.63 4.00 19.35
Kaplan–Meier 0.00 0.00 0.00
Table 2: Comparative Evaluation Results
Cost-Sensitive Learning Censored-Data Discarding Kaplan-Meier Cost-Sensitive Learning Censored-Data Discarding 0.00*** Kaplan-Meier 0.00*** 0.028**
***: Significant at p < 0.01 on a two-tailed t-test; **: Significant at p < 0.05 on a two-tailed t-test.
Table 3: Significance Test on F1 between Different Techniques
5
CONCLUSION
It is always helpful to make individualized prognosis for patients regarding disease management. According to patient’s physical characteristics and disease progress, treatment plan and drug prescription may vary. In terms of cancer incidence, it is crucial to take active therapies with better understanding of recurrence status. However, typical prediction models are usually limited to the
propose a cost-sensitive learning approach to leverage censored data for classification model learning. With a given prediction time, the nearest-neighbor algorithm is employed to estimate the recurrent status (and its probability) of each censored instance. Therefore, we can take the speculative recurrence probability as the cost of misclassification and build a committee-decision prediction model. Our empirical results reveal that our cost-sensitive learning approach has better prediction capabilities in terms of precision, recall and F1 score than the two benchmark techniques.
References
Ali, A., Tufail, A., Khan, U., and Kim, M. (2009). A survey of prediction models for breast cancer survivability. In Proceedings of the 2nd International Conference on Interaction Sciences, Information Technology, Culture and Human, 1259-1262.
Bundred, N.J. (2001). Prognostic and predictive factors in breast cancer, Cancer Treatment Reviews, 27, 137-142.
Burke, H.B., Goodman, P.H., Rosen, D.B., Henson, D.E., Weinstein, J.N., Harrell, F.E., Marks, J.R., Winchester, D.P., and Bostwick, D.G. (1997). Artificial neural networks improve the accuracy of cancer survival prediction. Cancer, 79 (2), 857-862.
Calle, J. (2004). Breast cancer facts and figures 2003–2004. American Cancer Society, 1-27.
Cox, D.R. (1972). Regression models and life-tables. Journal of the Royal Statistical Society Series B (Methodological), 34 (2), 187-220.
Chi, C.L., Street, W.N., and Wolberg, W.H. (2007). Application of artificial neural network-based survival analysis on two breast cancer datasets. Proceedings of AMIA Annual Symposium. Cruz, J. A. and Wishart, D. S. (2006). Applications of machine learning in cancer prediction and
prognosis. Cancer Inform, 2, 59-77.
Domingos, P. (1999). MetaCost: A general method for making classifiers cost sensitive. In
Proceedings of the Fifth International Conference on Knowledge Discovery and Data Mining, 155-164.
De Laurentiis, M., De Placido, S., Bianco, A. R., Clark , G. M., and Ravdin, P. M. (1999). A prognostic model that makes quantitative estimates of probability of relapse for breast cancer patients. Clinical Cancer Research, 5, 4133-4139.
Drummond, C. and Holte, R. (2000). Exploiting the cost (in)sensitivity of decision tree splitting criteria. In Proceedings of Seventeenth International Conference on Machine Learning, 239-246. Delen, D., Walker, G., and Kadam, A. (2005). Predicting breast cancer survivability: A comparison of
three data mining methods. Artificial Intelligence in Medicine, 34 (2), 113-127.
Fan, W., Stolfo, S., Zhang, J., and Chan, P. (1999). AdaCost: Misclassification cost-sensitive boosting. In Proceedings of the 16th International Conference on Machine Learning, 97-105.
Jerez, J., Franco, L., Alba, E., Llombart-Cussac, A., Lluch, A., Ribelles, N., Munárriz, B., and Martin, M. (2005). Improvement of breast cancer relapse prediction in high risk intervals using artificial neural networks. Breast Cancer Research and Treatment, 94, 265-272.
Jerez-Aragonés, J.M., Gómez-Ruiz, J.A., Ramos-Jiménez, G., Muñoz-Pérez, J., and Alba-Conejo, E. (2003). A combined neural network and decision trees model for prognosis of breast cancer relapse. Artificial Intelligence in Medicine, 27 (1), 45-63.
Kaplan, E.L. and Meier, P. (1958). Nonparametric estimation from incomplete observations. Journal of the American Statistical Association, 53 (282), 457-481.
Khan, U., Shin, H., Choi, J. P., and Kim, M. (2008). wFDT—Weighted fuzzy decision trees for prognosis of breast cancer survivability. In Proceeding of the Australasian Data Mining Conference.
Lucas, P.J.F and Abu-Hanna, A. (1999). Prognostic methods in medicine. Artificial Intelligence in Medicine, 15 (2), 105-119.
Lundin, M., Lundin, J., Burke, H.B., Toikkanen, S., Pylkkanen, L., and Joensuu, H. (1999). Artificial neural networks applied to survival prediction in breast cancer. Oncology, 57, 281-286.
Margineantu, D. (2002). Class probability estimation and cost-sensitive classification decisions. In Proceedings of the 13th European Conference on Machine Learning, 270-281.
Von Neumann, J. (1951). Various techniques used in connection with random digits,” National Bureau of Standards, Applied Mathematics Series, 12, 36-38.
Ohno-Machado, L. (2001). Modeling medical prognosis: Survival analysis techniques. Journal of Biomedical Informatics, 34, 428-439.
Rijsbergen, v.C. J. (1979). Information Retrieval, London: Butterworths.
Ritthipravat, P. (2009). Artificial neural networks in cancer recurrence prediction. In Proceedings of International Conference on Computer Engineering and Technology (ICCET), 2, 103-107. Rumelhart, D. E., Hinton, G. E., and Williams, R. J. (1986). Parallel Distributed Processing (D. E.
Rumelhart and J. L. McClelland, Eds.) M.I.T. Press, Cambridge, MA.
Utley, M., Gallivan, S., Young, A., Cox, N., Davies, P., Dixey, J., Emery, P., Gough, A., James, D., Prouse, P, Williams, P., and Winfield, J. (2000). Potential bias in Kaplan-Meier survival analysis applied to rheumatology drug studies. Rheumatology, 39, 1-2.
Zupan, B., Demsar, J., Kattan, M., Beck, J., and Bratko, I. (2000). Machine learning for survival analysis: A case study on recurrence of prostate cancer. Artificial Intelligence in Medicine, 20, 59-75.
Zadrozny, B., Langford, J., and Abe, N. (2003). Cost-sensitive learning by cost-proportionate example weighting. In Proceedings of International Conference on Data Mining, 435-442.