A Combination of Feature Extraction Methods
with an Ensemble of Different Classifiers for
Protein Structural Class Prediction Problem
Abdollah Dehzangi, Kuldip Paliwal, Alok Sharma, Omid Dehzangi, Abdul Sattar
Abstract—Better understanding of structural class of a given protein reveals important information about its overall folding type and its domain. It can also be directly used to provide critical information on general tertiary structure of a protein which has a profound impact on protein function determination and drug design. Despite tremendous enhancements made by pattern recognition-based approaches to solve this problem, it still remains as an unsolved issue for bioinformatics which demands more attention and exploration. In this study, we propose a novel feature extraction model which incorporates physicochemical and evolutionary-based information simultaneously. We also propose overlapped segmented distribution and autocorrelation based feature extraction methods to provide more local and global discriminatory information. The proposed feature extraction methods are explored for 15 most promising attributes that are selected from a wide range of physicochemical-based attributes. Finally, by applying an ensemble of different classifiers namely, Adaboost.M1, LogitBoost, Naive Bayes, Multi-Layer Perceptron (MLP), and Support Vector Machine (SVM) we show enhancement of the protein structural class prediction accuracy for four popular benchmarks.
Index Terms—Mixture of feature extraction models, overlapped segmented distribution, overlapped segmented autocorrelation, ensemble of different classifiers, physicochemical-based features
F
1
I
NTRODUCTIONProtein structural class prediction problem is defined as assigning a protein into one of the four well defined structural classes of proteins [1]. These structural classes are denoted by: all-α, all-β,α+ β, andα/β. The most accurate and popular structural classification of proteins can be found inStructural Classification of Proteins (SCOP)
[2]. In the latest version of the SCOP, the number of structural classes has increased to 11 groups. However, these four major structural classes still cover almost 90% of proteins and are commonly used in many studies. In the biological perspective, protein structural class prediction problem is considered as an important task which provides crucial information about overall folding process and general functionality of the proteins. It also gives a better insight into protein fold recognition, pro-tein secondary structure prediction and drug design [3], [4], [5]. Most of the approaches proposed in the literature to tackle this problem have been successfully applied to
• Abdollah Dehzangi is with Institute for Integrated and Intelligent Systems (IIIS), Griffith University, and National ICT Australia (NICTA), Brisbane, Australia. Email: [email protected]
• Kuldip Paliwal is with School of Engineering, Griffith University, Bris-bane, Australia. Email: [email protected]
• Alok Sharma is with School of Engineering, Griffith University, Brisbane, Australia and School of Engineering and Physics, University of the South Pacific, Fiji. Email: sharma [email protected]
• Omid Dehzangi is with Embedded System and Signal Processing Labo-ratory, Electrical Engineering Department, University of Texas at Dallas, Texas, United States of America. Email: [email protected]
• Abdul Sattar is with Institute for Integrated and Intelligent Systems, Griffith University, and National ICT Australia (NICTA), Brisbane, Australia. Email: [email protected]
protein fold recognition and attained promising results [6], [7], [8].
From the pattern recognition perspective, this problem is presented as solving a multi-class classification task. The performance of the proposed method to solve this problem crucially relies on the selected attribute and con-sequently feature extraction method being used as well as the classification techniques being developed. During the past few decades a wide range of classification tech-niques such as,Meta-Classifiers[9], [10], [11], [12],Support Vector Machine (SVM)[13], [14],Artificial Neural Network (ANN) [15], [16], [17], and Ensemble classifiers [18], [19] have been used to tackle this problem. Among these classifiers, ensemble and SVM-based classifiers exhibited quite promising results [6], [7]. However, the perfor-mance of ensemble classifiers has not been adequately explored [20], [21], [22]. At the same time and in parallel by exploring the impact of classification techniques, a wide range of studies tried to tackle this problem by proposing novel feature extraction methods that main-tain more local and global information for this task [3], [4], [5], [6], [23].
The most successful studies to enhance protein struc-tural class prediction accuracy addressed both feature extraction and classification approaches simultaneously [6], [7], [18], [24]. However, it has been shown in the literature [3], [6], [7] that development of attribute se-lection and feature extraction methods tend to be more crucial for protein structural class prediction problem compared to the impact of classification technique being used. In general, features that have been used for this problem can be categorized into four groups namely,
sequential, physicochemical, structural, and evolutionary-basedfeatures. The early studies conducted to tackle this problem have mostly relied on sequential-based (also called compositional-based) features which are extracted merely based on the alphabetic sequence of the amino acids [25]. Despite the importance of these features to provide significant discriminatory information based on the sequential similarities, they fail to perform properly when sequence similarity is low (which is also called twilight zone [3], [26]).
On the other hand, physicochemical-based features (extracted based on different physicochemical-based at-tributes (e.g. hydrophobicity and polarity) of the proteins and amino acids) are able to provide and maintain discriminatory information when that sequence simi-larity is low. Furthermore, these features are able to reveal the impact of different physicochemical-based at-tributes on the folding process. However, using just these group of features the protein structural class prediction accuracy remains limited. Note that in many above-referenced studies, structural-based features (extracted based on predicted secondary structure of proteins (e.g. normalized frequency of α-helix)) are categorized as physicochemical-based attributes [20], [27], [28]. There-fore, to maintain the consistency and for simplicity, these features are also referred as a kind of physicochemical-based attributes in this study.
Recently, evolutionary-based features have been widely used for this problem and attained promising results [6], [29]. These features rely on the concept of substitution of the amino acids along the proteins through evolution and mainly extracted from thePosition Specific Scoring Matrix (PSSM). PSSM is calculated by running PSIBLAST on a protein database [30]. The PSSM probabilities depend on the position of amino acids in the protein sequence. It provides important information about dynamic substitution score of an amino acid. Pre-viously, PSSM was used to find transformed protein se-quences (called consensus sequence) [3]. However, these features also suffer from the following two limitations: 1) it fails to maintain its discriminatory information especially when sequence similarity is low; and 2) it is unable to provide any information about the relation between physicochemical-based attributes and folding process [20].
To address these two limitations and at the same time to enhance the prediction performance, features derived from the predicted secondary structure using PSIPRED were used [3], [8], [31]. PSIPRED predicts protein secondary structure with about 80% prediction accuracy using the evolutionary-based information and PSIBLAST. However, due to this limited accuracy (about 80%) of the predicted secondary structure by PSIPRED, it could not be relied as an adequate source of information for feature extraction to enhance the protein structural class prediction accuracy especially for over 80% [32]. It is also shown that studies relied on these features to enhance the prediction accuracy could not reach too far
better results than 80% [3], [8], [31].
In this study, to address the above-mentioned limi-tations and to enhance the protein structural class pre-diction accuracy, a novel approach is proposed which comprises of both feature extraction and classification methods (with more consideration given to the attribute selection and feature extraction). The proposed method is implemented in the following four steps. In the first step, we conduct a comprehensive experimental study on a wide range of physicochemical-based attributes and select 15 most promising attributes which are ex-plored using several previously reported feature extrac-tion methods. In the second step, based on the concepts of overlapped segmented distribution and autocorrela-tion methods, two sets of features are extracted based on each attribute from the consensus sequence using evolutionary-based information. This approach enables us to obtain benefit of these two categories of features simultaneously to provide more local and global dis-criminatory information. In the third step, two sets of sequential-based features that attained good results in previous studies for this task are extracted and com-bined with our proposed features. In the final step, an ensemble of five different classifiers (AdaBoost.M1, LogitBoost, Naive Bayes, MLP, and SVM) is applied to the combination of the proposed features. The employed ensemble classifier was proposed in our previous work and attained promising results for the protein fold recog-nition [21]. However, it was not explored for the protein structural class prediction problem. The performance of the proposed approach is explored using four popular benchmarks. Our results show that the proposed ap-proach in this study outperforms the protein structural class prediction accuracy compared to the results of previous studies for all of the employed benchmarks.
2
M
ATERIALS ANDM
ETHODOLOGY 2.1 BenchmarksIn this study, two popular benchmarks introduced by Zhou [25] are used to compare the performance of our proposed methods with the state-of-the-art methods found in the literature. The first benchmark denoted as Z277 consisting of 277 proteins and the second bench-mark denoted as Z498 consisting of 498 proteins. Despite the relatively small size of these two benchmarks, they are still considered as important data sets for bench-marking. To explore the impact of the proposed methods on the low-similarity datasets, 1189 [33] and 25PDB [19] benchmarks which respectively consist of 1092 pro-teins with less than 25% sequential similarity and 1673 proteins with less than 40% sequential similarity are explored (Table 1).
2.2 Explored Physicochemical-based Attributes In this study, 15 most promising physicochemical-based attributes which are taken from AAindex [34], APDbase
TABLE 1
Explored benchmarks in this study.
Ref. Benchmark All-α All-β α+β α/β Total
[25] Z277 70 61 81 65 277
[25] Z498 107 126 136 129 498
[33] 1189 223 294 334 241 1092
[19] 25PDB 443 443 346 441 1673
[35], and previous studies found in the literature are explored [27]. We selected these 15 attributes among 115 physicochemical-based attributes which were experi-mentally explored using several classification techniques and feature extraction methods (mainly based on the overlapped segmented distribution and autocorrelation-based approaches). For a given attribute, we extracted six feature groups based on the overlapped segmented distribution and overlapped segmented autocorrelation approaches which are the subjects of this study. Then we applied five classifiers namely, Adaboost.M1, Random Forest, Naive Bayes,K-Nearest Neighbor (KNN), and SVM to each feature group separately. Therefore, 30 predic-tion accuracies were achieved for each physicochemical-based attribute (five classifiers applied to six feature groups separately (5 × 6 = 30)). Then we compared these results for all 115 attributes and selected 15 at-tributes that attained the best results in average for all 30 prediction accuracies. The attribute selection pro-cess is explained in detail in Appendix A. Explored attributes in this study are namely, (1) structure de-rived hydrophobicity value, (2) polarity, (3) average long range contact energy, (4) average medium range contact energy, (5) mean Root Mean Square (RMS) fluc-tuational displacement, (6) total non-bounded contact energy, (7) amino acids partition energy, (8) normalized frequency of α-helix, (9) normalized frequency of β -turns, (10) hydrophobicity scale derived from 3D data, (11) hydrophilicity scale derived from High-Performance Liquid Chromatography (HPLC) peptide retention data 1, (12) average gain ratio of surrounding hydrophobicity, (13) mean fractional area loss, (14) flexibility, and (15) bulkiness.
Most of the selected attributes have not been ade-quately (or not at all) explored for the protein structural class prediction problem (or for the protein fold recogni-tion [3], [20], [28]); while in our experimental study, they outperformed even the popular attributes that had been widely used to tackle this task.
2.3 Feature Extraction Approach
In this study, we concatenate features driven from the all three main sources (sequential, physicochemical and evolutionary-based features) to form a feature vector which is used for the protein structural class predic-tion problem. In the first step, PSSM is calculated by applying the PSIBLAST on NCBI’s non redundant (NR)
1. This attribute is used to predict which areas of a protein are on the surface
data base for our explored benchmarks (cut off value (E) set to 0.001) [3], [6], [36]. The PSSM consists of two L × 20 matrices (L is the length of a protein and the columns of the matrices represent 20 amino acids) [6]. The first matrix is called PSSM cons and gives the log-odd of the substitution score. The second matrix is called PSSM prob and gives the normalized probability of substitution score for each amino acid. In the second step, two important sequential-based feature sets are extracted from the PSSM. In the third step, consensus sequence is extracted directly from the PSSM and then, physicochemical-based features are extracted from this sequence instead of using the original sequence (as it was used conventionally). In the next step, extracted features are combined with the extracted features in the previous steps. In this way, the true potential of all the three categories of attributes are considered and explored. In continuation, each approach will be explained in detail.
2.3.1 Sequential-based Feature Extraction from Evolutionary-based Information
To explore the impact of the sequential-based features, two feature groups namely, evolutionary-based composi-tion (PSSM AAC) and evolucomposi-tionary-based auto covari-ance (PSSM AC) are extracted from the PSSM matrix. These features capture significant local and global in-formation and have been used in the past [3], [6], [36] with promising results for the protein structural class prediction problem.
2.3.1.1 Evolutionary-based Composition Feature Group (PSSM AAC): This feature group is extracted based on the concept of composition of the amino acids feature group to provide discriminatory information related to the occurrence of each amino acid along a given protein sequence [6]. The difference between the PSSM AAC and the composition features derived from the original protein sequence (which is extracted by counting the occurrence of each amino acids along the protein sequence divided by the length of the protein) is that the PSSM AAC is extracted from the PSSM cons by summing the substitution score of each amino acids and divide it by the total length of the protein.
P SSM AACj= 1 L L X i=1 Sij, (j= 1, ...,20), (1)
where L is the length of protein and Sij is the
substi-tution score of the amino acids at location i by j −th amino acid in the PSSM cons.
2.3.1.2 Evolutionary-based Auto Covariance Fea-ture Group (PSSM AC): To provide more information about the interaction of the amino acids with each other along a protein sequence, the concept of PSSM AC is used recently in the literature [6], [36]. PSSM AC gives the auto covariance of the substitution score of each amino acid along a protein sequence and is defined as follows:
P SSM ACk,j= 1 (L−k) L−k X i=1
(Si,j−Save,j)(Si+k,j−Save,j),
(j= 1, ...20and k= 1, ..., Fs), (2)
where Save,j is the average of substitution score of the
amino acid i in the PSSM cons and Fs is the distance
factor. Therefore, in total20×Fs features are calculated
in this feature group. In this study, two values of the distance factor (Fs = 6 or 10) are investigated as they
were presented in the literature as the most effective dis-tance factors for protein structural class and protein fold prediction problems [6], [36]. Note that the combination of these two feature groups PSSM AAC, and PSSM AC is called AAC-PSSM-AC in the literature (which will also be referred similarly for the rest of this study).
2.3.2 Consensus Sequence Extraction Method
Consensus sequence is extracted to reveal more evo-lutionary information considering the PSSM compared to the original protein sequence. It was also shown as an effective way to provide more information for the protein structural class prediction problem [3], [7], [18]. To extract the consensus sequence, previous studies replaced the amino acid at a given location in the original protein sequence by the amino acid with the maximum substitution score in the row corresponding to that loca-tion in the PSSM. This is done using the following two steps. In the first step, the index is found as:
Ii=argmax{Sij: 1≤j≤20}, 1≤i≤L, (3)
where Sij is the substitution score of the amino acid at
locationiwith thej-thamino acid in the PSSM cons. In the second step, replace the amino acid ati−thlocation of original protein sequence by theIi−thamino acid to
form the consensus sequence C1, C2, ..., CL. However,
due to the fact that the PSSM cons consists of the log-odds of the substitution score, in many cases there are more than one maximum for the substitution score in this matrix. In this case, the selection of the better value from multiple maximum values were conducted randomly (the first/last maximum values) which can not be considered as an accurate method. Furthermore, the PSSM cons does not provide any beneficial infor-mation about unknown amino acids in proteins (which are conventionally shown by ’X’ in the sequence). The substitution scores for these unknown amino acids in the PSSM cons are all equal to -1. Therefore, relying merely on the PSSM cons left the issue of unknown proteins unaddressed.
By exploring the PSSM prob in more detail, we real-ized that the occurrence of multiple maximum is much less frequent in this matrix compared to the PSSM cons due to the fact that it returns the normalized probability of substitution score (due to better precision). In addi-tion, in case that a similar sequence is spotted in the non-redundant protein data bank, this matrix provides
substitution score probability even for unknown amino acids (if none is spotted it returns zero which rarely occurs just in case that the length of the protein is very short and at the same time unknown amino acids are spotted). Therefore, it is possible to address the issue of unknown amino acids using evolutionary-based information and considering the PSSM prob.
Hence, in this study, we propose a novel consensus sequence extraction model for the protein structural class prediction problem considering the concepts of the PSSM prob and the PSSM cons simultaneously. In our method, we first check the PSSM prob. In case that a unique maximum is spotted, it will be replaced with the original amino acids in the sequence. Otherwise, we will refer to the PSSM cons to find the maximum. If a unique maximum is spotted in this matrix, it will be replaced with the original amino acids sequence. Otherwise, the first maximum from the PSSM prob will be replaced. The most crucial impact of the explored method in this study is proposing a method to address the issue of unknown amino acids. In this method, unknown amino acids are transformed to the consensus sequence considering the evolutionary-based information which are extracted from the PSSM prob. Our approach suc-cessfully addresses the issue of unknown amino acids for the explored benchmarks. Using our proposed con-sensus sequence extraction method, for 25PDB and 1189 benchmarks, all unknown amino acids are replaced and for Z277 and Z498 all but one protein, unknown amino acids are replaced.
2.3.3 Physicochemical-based Feature Extraction Method
To explore the potential of the physicochemical-based attributes for the protein structural class prediction problem better, a novel feature extraction model based on the concept of the evolutionary-based information is proposed. In the proposed model, we first trans-form the original protein sequence to its consensus sequence as described before. Then from the consen-sus sequence, physicochemical-based features are ex-tracted using overlapped segmented distribution and autocorrelation-based methods which are proposed in this study. Proposed approaches are aimed at providing more local and global discriminatory information.
As highlighted earlier, previous approaches mainly relied on the original protein sequence to extract the physicochemical-based features [3], [4]. In our approach, we use the consensus sequence (C1, C2, ..., CL) to
de-rive a numerical sequence R1, R2, ..., RL where Ri is
the numerical value of a particular physicochemical attribute (e.g. polarity) of amino acidCi. This sequence
is then used by overlapped segmented distribution and autocorrelation-based methods to derive features. In this manner, we are able to explore the discriminatory infor-mation (shown during the experimentation) provided by the evolutionary and physicochemical-based attributes simultaneously which not only enhances the protein
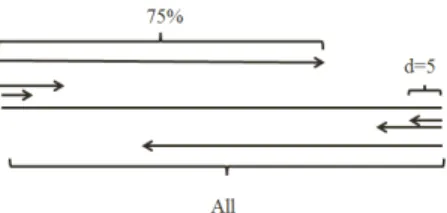
Fig. 1. Overlapped segmented distribution-based feature extraction method.
structural class prediction accuracy but it also enables us to provide crucial information about the impact of a given physicochemical-based attribute on the folding process. The overlapped segmented distribution and autocorrelation methods are explained below in detail.
2.3.3.1 Overlapped Segmented Distribution Ap-proach: Global density of different attributes is widely used in protein science and believed to provide im-portant information of the global impact of a specific attribute on the folding process (e.g. polarity) [3], [27]. It is defined as follows:
Tglobal density=
PL i=1Ri
L , (4)
where Ri is the attribute value (normalized) of thei-th
amino acid. However, it fails to provide adequate local information [37]. Therefore, global density is not consid-ered as an effective feature to appropriately explore the potential discriminatory information of a given attribute. In this study, instead of relying solely on the global density of a given attribute, we also use the distribution of the amino acids based on the segmented density.
In the proposed approach, we first compute T = Tglobal density×L, which is the total sum of the attribute
sequence Ri(i = 1, ..., L). In the second step, starting
from left side of the attribute sequence, we find the index
I such that the partial sumS =R1+R2+...+Ri of the
first I1(f) (in which the superscript f stands for starting from the left side of the proteins) attributes reaches tod%
(called distribution factor) of T (i.e., S ≥(T ×d)/100). This process is carried out for different values of d(5%, 10%, 15% ,..., 75%) to get 15 indices I1(f), I2(f), ..., I15(f). These indices are divided by the length of protein to ob-tain 15 distribution features. Note that these 15 features are obtained by analyzing the sequence in the forward direction (i.e., starting from the left). We also compute 15 features by analyzing the sequence in the backward direction (i.e., starting from the right). Thus, a total of 31 features using the proposed method are extracted (1 global density + 15 from the left side + 15 from the right side). Note that we segment the protein sequence with distribution factor of d and process it from the left as well as from the right side of the protein sequence while the left and right side processing are having overlap (Figure 1). As a result, we call this method overlapped segmented distribution approach.
In this study, 5% distribution factor and 75% called
overlapping factor, are selected based on the average length of the proteins in the explored benchmarks which is the trade off between the number of produced features and the time consumption of this task, and experi-mental study that was conducted by the authors. The overlapping approaches are proposed to provide more information about the distribution of the amino acids in the middle of a protein considering each side. Consider-ing the number of features (only 10 overlap features), this approach is able to provide crucial overlapping information to tackle this problem.
This approach also enables us to explore the impact of each attribute more comprehensively compared to previously explored methods [3], [20], [28], [38], [39]. It is important to highlight that due to use of density, the segmentation factor is independent from the length. It makes our method more appropriate for general cases where the gap between the length of the shortest and the longest proteins in the data bank is large compared to previously used distribution-based approaches [28].
2.3.3.2 Overlapped Segmented Autocorrelation: In the past, the autocorrelation features have been com-puted using the whole protein sequence of L attribute values Ri(i = 1, ..., L). Pseudo amino acid composition
based features are good examples of these type of fea-tures [39]. These autocorrelation feafea-tures capture the interaction of the neighboring amino acids over the entire length of the protein sequence. In the present study, we extend the concept of overlapped segmented distribution features as described in the previous sub-section to compute the autocorrelation features from the segmented protein sequence. This is done to provide more local discriminatory information. Here we segment the protein sequence using distribution factor of 10% (d= 10) and overlapping factor of 70% (of = 70). Using
a procedure similar to the one described in the previous subsection, we first analyze the protein sequence in for-ward direction and find seven indices I1(f), I2(f), ..., I7(f) for seven different values of d (d = 10%,20%, ...,70%). These seven indices are used to segment the protein sequence into seven segments and Fph number of
au-tocorrelation coefficients for each of these segments are computed as follows: Autocorrelationi,k= 1 (Ik(f)−i) I(f) k −i X j=1 RjRj+i, (k= 1,2, ...,7and i= 1, ..., Fph), (5)
Note that7×Fph autocorrelation coefficients are
com-puted in this manner by analyzing the protein sequence in the forward direction. This process is repeated to obtain another 7 ×Fph autocorrelation coefficients by
analyzing the protein sequence in the backward direc-tion. We also compute the global autocorrelation coef-ficient of the whole protein sequence to provide more global information in conjunction with the extracted local information. Thus, we have extracted a total of
(7Fph+ 7Fph+Fph) = 15Fph autocorrelation features
in this manner. Two values ofFph (6 and 10) are
investi-gated in this study; which gives 90 (42 + 42 + 6) features forFph = 6 and 150 (70 + 70 + 10) features forFph= 10.
Finally, the extracted feature groups based on both physicochemical-based feature extraction methods for a given attribute are combined to provide local and global discriminatory information based on density, distribu-tion, and autocorrelation approaches simultaneously. Therefore, considering two different autocorrelation dis-tance factors, two combined feature groups with 121 and 181 features are produced for Fph = 6 and Fph = 10,
respectively.
2.4 Ensemble of Different Classifiers
Instead of using a single classifier, we use an ensemble of different classifiers for protein structural class prediction task. A well-defined ensemble of these classifiers is capable of addressing statistical, computational, and rep-resentational issues better than an individual classifier [19], [21], [40].
For an ensemble classifier, diversity and individual accuracy of its component classifiers are two main cri-teria that define its classification performance [41]. In an ensemble classifier, diversity is encouraged by ex-ploring classifiers that have diverse learning policies (or diversely trained) and individual accuracy is encouraged by the individual performance of the explored classifiers for an specific task.
In our previous work, we proposed an ensemble of five different classifiers namely, AdaBoost.M1, Logit-Boost, Naive Bayes, SVM, and MLP that was successfully explored for the protein fold recognition and attained promising results [21], [42]. These five classifiers also have been explored individually for protein structural class prediction problem in different studies and at-tained promising results (which encourage individual accuracy of the ensemble classifier built base on these classifiers [5], [10], [16], [33]). Using these five classifiers also encourage diversity due to their different learning and classification approaches which are studied in [21], [42]. In the present study, we employ the same five classifiers to construct an ensemble classifier used for the classification task. Note that the implementations of these classifiers (AdaBoost.M1, LogitBoost, MLP, SVM, and Naive Bayes) in WEKA machine learning toolbox are used [43]. To combine the employed classifiers, we use majority voting which attained better results com-pared to other explored algebraic combiners. We describe briefly each of these individual classifiers below.
2.4.1 AdaBoost.M1
AdaBoost.M1 was introduced by [44] based on boost-ing approach. AdaBoost.M1 sequentially applies a base learner to bootstrap samples of data and adjusts the weight of the misclassified samples in each iteration to minimize the exponential loss function. In the final
step, by combining all classifiers in each iteration us-ing majority votus-ing, it creates a diverse classifier. Ad-aBoost.M1 is considered as the best-of-the-shelf Meta-classifiers which attained promising results for a wide range of applications as well as protein structural class prediction problem [10], [45]. In this study, Adaboost.M1 using C4.5 decision tree as its base learner is used with 100 iterations; these many iterations have been found to provide the best results for similar studies in the past [20].
2.4.2 LogitBoost
Similar to the Adaboost.M1, LogitBoost is considered as a kind of Meta-classifier based on boosting approach [46]. It was introduced to address the over fitting prob-lem in AdaBoost.M1 which arises when the number of training samples is small. In this classifier, logistic regression function is employed as a base learner and in each iteration it minimizes logistic loss function to improve the performance of its base learner. Similar to the Adaboost.M1, this classifier has been widely used in protein science and attained promising results [9], [12], [20]. In this study, the number of iterations for this classifier is set to 100 (which attained the best results for similar studies [20].).
2.4.3 Support Vector Machine (SVM)
This classifier is considered as the-state-of-the-art clas-sifier in the pattern recognition as it outperforms other individual classifiers in tackling this problem [6]. SVM aims at minimizing the prediction error by finding the
Maximal Marginal Hyperplane (MMH) based on the sup-port vector theory [47]. It transforms the input data using kernel trick to find appropriate support vectors to achieve its goals. We use SVM using Sequential Minimal Optimization (SMO)algorithm with polynomial kernel of degree one (which is called linear kernel) to reduce the time complexity of our proposed classifier2. It was also shown that using linear kernel attained similar results compared to use of kernel degree of two and three as a part of proposed ensemble classifier. For this classifier, the regularization parameter is set to four as the number of classes for protein structural class prediction problem.
2.4.4 Multi-Layer Perceptron (MLP)
It is considered as one the most popularArtificial Neural Network (ANN) based classifiers [21]. It uses gradient descent in its interconnected network in the feedforward method to minimize the prediction error function over
2. We have studied a number of kernels such as linear, polynomial, Gaussian, and Radial Basis Function (RBF) for the SVM classifier and used this classifier on its own (i.e., without putting it in the ensemble configuration) and found the polynomial kernel (with polynomial degreep = 3) giving the best results. When we studied these kernels for the SVM classifiers when this classifier is used in the ensemble configuration, we found all the kernels are similar in terms of their performance. Since linear kernel is simple and does not need much tuning, we provide in this paper the results of the ensemble configu-ration with the SVM classifier using linear kernel.
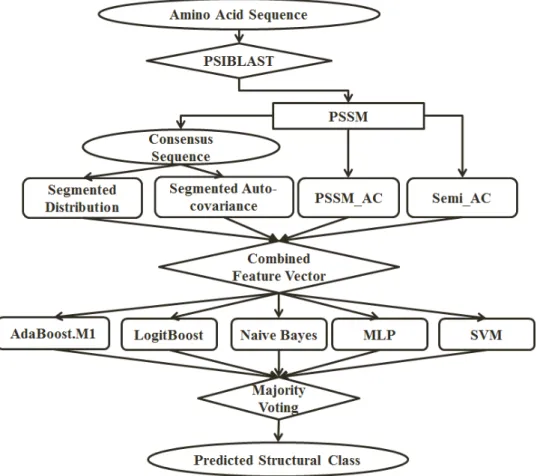
Fig. 2. The overall architecture of the proposed method.
the training data. Despite its simplicity compared to the other ANN-based classifiers, it has achieved comparable results (and sometimes even better results) for similar studies [15], [20], [48]. In this study, the default param-eters of WEKA used for MLP are adopted (number of hidden layers is set to one and number of hidden nodes where set to number of input features).
2.4.5 Naive Bayes
This classifier assumes the independence of features which helps in computing the posterior probability re-quired in the Bayes rule in a simple manner [21], [33]. Despite its naive assumption, it has been popularly used for different tasks and attained promising results for similar studies found in the literature [49]. Naive Bayes classifier uses the features in a manner different from other classifiers and hence, when it is used as a component of an ensemble classifier it has attained good results for the protein fold classification task [42].
3
R
ESULTS ANDD
ISCUSSIONAs mentioned in section 2, we propose in this pa-per a feature extraction method and ensemble of dif-ferent classifiers for protein structural class prediction problem. The feature extraction method uses individual physicochemical-based attributes to extract the follow-ing two kinds of features: 1) segmented distribution,
and 2) segmented autocorrelation. In this section, we investigate these two kinds of features for each of the 15 physicochemical-based attributes. These features are concatenated with PSSM AAC and PSSM AC features to form the final feature vector used for classification task.
Note that most of the studies conducted on the Z277 and Z498 benchmarks used Jackknife evaluation crite-rion while studies conducted on the 1189 and 25PDB benchmarks used 10-fold cross validation evaluation criterion. In this study, we use 10-fold cross validation to report our results on the four benchmarks (Z277, Z498, 1189, and 25PDB). As it was shown in [50], cross-validation evaluation criterion produces similar results compared to the use of Jackknife method (while using cross-validation produces slightly less biased results spe-cially when the number of samples increases). To the best of our knowledge, the results reported by Liu and his co-workers using SVM classifier withRadial Based Function (RBF) kernel (implemented in the SVMLIB) are the best results for these four benchmarks [6].
We use ensemble of different classifiers to classify the feature vector introduced earlier. The general ar-chitecture of the proposed method is shown in Figure 2. For the rest of this study, the combination of the feature groups based on each attribute and considering Fph (distance factor used in overlapped segmented
au-tocorrelation feature group) andFs(distance factor used
in evolutionary-based auto covariance feature group) will be shown by: (comb num, Fph, Fs). To be able
to compare our results with previous studies found in the literature, we report our results in terms of protein structural class prediction (or classification) accuracy (in percentage) which is defined as follows:
Q= C
N ×100, (6)
where C is the number of the correctly classified test samples and Nis the total number of test samples.
Fig. 3. The prediction accuracies achieved (in percent-age) for applying ensemble of classifiers to 15 combina-tions of feature vectors using Fph = 6 and Fs = 6 for
feature extraction.
Fig. 4. The prediction accuracies achieved (in percent-age) for applying ensemble of classifiers to 15 combina-tions of feature vectors using Fph = 10 and Fs = 6 for
feature extraction.
3.1 The Impact of Fph and Fs on the Prediction Performance
In this subsection, we use PSSM AAC, PSSM AC, over-lapped segmented distribution, and overover-lapped seg-mented autocorrelation feature groups and investigate the impact ofFph andFs on the protein structural class
prediction problem. This is done to arrive at the best combination of Fph and Fs values. With Fph = 6 or 10
and Fs = 6 or 10, the following four combinations of
Fph and Fs are possible: 1) Fph = 6, Fs = 6, 2) Fph
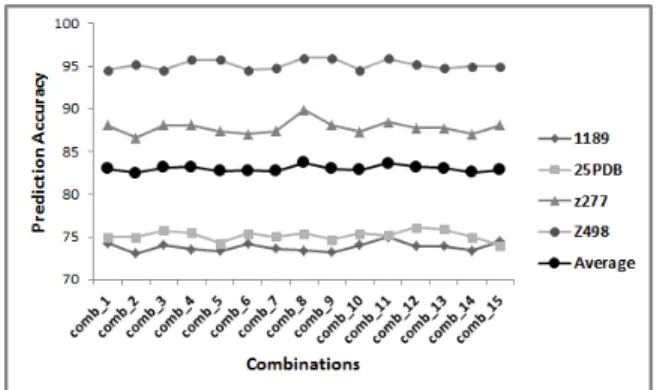
Fig. 5. The prediction accuracies achieved (in percent-age) for applying ensemble of classifiers to 15 combina-tions of feature vectors using Fph = 10 andFs = 10 for
feature extraction.
Fig. 6. The comparison of the prediction accuracies driven from the average results (in percentage) achieved by adjustingFph = 6andFs = 6,Fph = 10andFs = 6,
and Fph = 10 and Fs = 10 for all 15 combinations of
feature vectors.
= 6 , Fs = 10, 3) Fph = 10 , Fs = 6, and 4) Fph =
10 , Fs = 10. Since the combination Fph=6 and Fs=10
gives results similar to combination Fph= 6 and Fs = 6
in our experimental study, we have not shown it here to keep the paper as brief as possible. We apply our proposed ensemble of classifiers to all the combinations of feature vectors extracted in this study with respect to the values of Fph and Fs. The results achieved by
applying the ensemble classifier (which is an ensemble of five classifiers as described in previous section) to 15 combinations of features extracted forFph= 6andFs=
6 (comb num,6,6);Fph = 10and Fs = 6 (comb num,10,6);
and Fph = 10 and Fs = 10 (comb num,10,10) for all
benchmarks and their average prediction accuracies (for each combination) are shown in Figure 3, Figure 4, and Figure 5, respectively.
In Figure 6, the average prediction accuracies achieved for all 15 combinations of feature vectors for all four benchmarks investigated in this study by adjusting Fph = 6 and Fs=6 , Fph = 10 and Fs=6, and Fph = 10
andFs=10 are shown and compared. As we can see, the
average results achieved by adoptingFph= 10andFs=
6 attains relatively better results then two other alterna-tives used forFph andFs. Therefore, we adoptFph= 10
and Fs= 6 as the most effective values for these two
parameters and the report the results in this paper from here onwards using these values. Note that the highest results in average for all these four benchmarks achieved by using physicochemical-based attributes number 9, 11, and 12 (normalized frequency of β-turn, hydrophilic-ity scale derived from (HPLC) peptide retention data, and average gain ratio of surrounding hydrophobicity, respectively) which to the best of our knowledge have not been adequately explored for feature extraction for the protein structural class prediction problem in the literature.
These three attributes are based on hydrophobicity and predicted secondary structure of the proteins which are considered as the most important aspect of proteins and amino acids that impact on the folding process in the biological perspective. Achieving best results using hy-drophobicity and predicted secondary structure of pro-teins also highlights their effectiveness in the computa-tional aspect which can be explored using segmentation-based feature extraction method. Furthermore, the better performance attained by using these three attributes highlight their effectiveness and preference compared to use of the other, more popular, attributes to enumerate hydrophobicity and predicted secondary structure of proteins (e.g. structure derived hydrophobicity value, normalized frequency of alpha-helix (which both are also investigated in this study (attribute numbers 1 and 8 respectively)). Among these three physicochemical-based attributes, attribute number 11 attained the best results in average for all four benchmarks explored in this study.
3.2 The Impact of Proposed Features Versus Classi-fication Technique Used in This Study
In this subsection, we separately investigate the im-pact of proposed feature extraction techniques and the ensemble classifier on the protein structural class pre-diction accuracy. To do this, we start with the study reported by Liu and his co-workers as it has reported the best results for this prediction problem as men-tioned earlier [6]. They have used SVM classifier with the combination of PSSM AAC and PSSM AC feature groups where Fs is set to 6 (140 features in total) and
called this feature combination as AAC-PSSM-AC. In this subsection, we use the same SVM classifier with the same AAC-PSSM-AC features and report the protein structural class prediction results in the first row of Table 2 for the four benchmarks described earlier. These results are used here as baseline results which we want to improve by using our feature extraction techniques and the ensemble classifier. For this, we first study the impact of adding the overlapped segment distribution feature group to the baseline features (AAC-PSSM-AC) and use the SVM classifier to obtain the results as shown in the second row of Table 2.
Results with the overlapped segmented autocorrela-tion feature group added to the baseline feature are
shown in the third row. These results clearly indicate that overlapped segmented feature group as well as over-lapped segmented autocorrelation feature group help individually to improve the results, though the later group does slightly better. When both of these groups are added to the baseline features, the results (shown in the forth row) become much better. Finally, we use the ensemble classifier (instead of SVM classifier) with both the feature groups added to the baseline features and results are shown in the fifth row of Table 2. These results are better than the results listed in the fourth row indicating the improvement in performance resulting from the ensemble classifier over the SVM classifier. We can also see from this table that these results (in the fifth row) are better than the baseline results demonstrating the importance of our feature extraction method and the ensemble classifier.
In order to ascertain the statistical significance of this improvement, we use paired t-test and find t-value equal to 6.7293 with 3 degrees of freedom. These results are statistically better than the baseline results at 5% significance level (pvalue equals to 0.0034). This shows the significance of our proposed feature extraction and ensemble classifier with respect to baseline results. 3.3 Reported Results in This Study Compared to the Results Reported in the Literature
In this section, we use AAC-PSSM-AC, overlapped seg-mented distribution, and overlapped segseg-mented auto-correlation as features with the ensemble classifier for protein structural class prediction problem. The resulting prediction accuracy (in percentage) is shown in Tables 3, 4, 5, and 6 for the Z277, Z498, 1189, and the 25PDB benchmarks, respectively, for the three physicochemical-based attributes (attributes number 9, 11, 12) using Fph = 10 and Fs= 6 (comb 9,10,6, comb 11,10,6, and comb 12,10,6). For comparison, we also list the best results found in the previous studies reported in the liter-ature3. For each benchmark, the prediction performance for each structural class is also reported separately in these tables.
As shown in Table 3, we achieve over 90% prediction accuracy for the Z277 benchmark, which is 1.5% better than the highest result that was reported for this bench-mark before. By reproducing the result of [6] on this benchmark (using 10-fold cross validation) 88.8% predic-tion accuracy is achieved while for our method, we reach up to 90.3% (for Comb 11,10,6) prediction accuracy. Similarly, we achieve 96.8% prediction accuracy using (Comb 9,10,6) feature set for the Z498 benchmark (Table 4), which is better than the best prediction accuracy
3. As highlighted earlier in Section 1, the prediction accuracy of the PSIPRED for the protein secondary structure prediction is about 80%. Therefore, as discussed in [32], it can not be considered as a reliable feature source as it could not contribute to enhance the protein structural class prediction accuracy too far better than 80%. Therefore, these tables show results from previous studies without the use of PSIPRED [3], [8], [31]).
TABLE 2
The impact of proposed feature extraction groups versus ensemble of classifiers proposed in this study to enhance protein structural class prediction accuracy for attribute number 11 whereFphandFsare respectively set to 10 and 6.
Combination of features Classifier Z277 Z498 25DDB 1189 Average AAC-PSSM-AC SVM 88.8 95.0 73.9 72.7 82.6 AAC-PSSM-AC + overlapped segmented distribution SVM 88.9 95.3 74.4 73.0 82.9 AAC-PSSM-AC + overlapped segmented autocorrelation SVM 89.2 95.5 75.3 73.8 83.5 AAC-PSSM-AC + overlapped segmented distribution + overlapped segmented autocorrelation SVM 89.7 96.1 75.8 74.2 83.9 AAC-PSSM-AC + overlapped segmented distribution + overlapped segmented autocorrelation Ensemble Classifier 90.3 96.6 76.7 74.8 84.6
TABLE 3
The best results (in percentage %) achieved for Z277 benchmark (for combinations of feature vectors extracted for attributes number 9, 10, and 12 whileFphandFsare respectively set to 10 and 6) compared to the best results
reported in the literature
References Method All-α All-β α+β α/β Overall [15] Neural Network 68.6 85.2 86.4 56.9 74.7 [25] Component Coupled 84.3 82.0 81.5 67.7 79.1 [51] SVM 74.3 82.0 87.7 72.3 79.4 [9] LogitBoost 81.4 88.5 92.6 72.3 84.1 [4] IGA-SVM 84.3 85.5 92.6 70.7 84.5 [52] CWT-PCA-SVM 85.7 90.2 87.7 80.1 85.9 [18] IB1 89.7 88.1 92.2 80.0 87.7 [39] SVM Fusion 85.7 90.2 93.8 80.0 87.7 [6] AAC-PSSM-AC 86.2 92.9 95.0 80.3 88.8
This Study Comb 9,10,6 88.4 91.8 95.1 81.3 89.4 This Study Comb 11,10,6 90.0 93.4 96.3 80.0 90.3
This Study Comb 12,10,6 88.7 95.1 93.8 80.2 89.7
TABLE 4
The best results (in percentage %) achieved for Z498 benchmark (for combinations of feature vectors extracted for attributes number 9, 10, and 12 whileFphandFsare respectively set to 10 and 6) compared to the best results
reported in the literature.
References Method All-α All-β α+β α/β Overall [15] Neural Network 86.0 96.0 88.2 86.0 89.2 [25] Component Coupled 93.5 88.9 90.4 84.5 89.2 [39] SVM Fusion 99.1 96.0 80.9 91.5 91.4 [51] SVM 88.8 95.2 96.3 91.5 93.2 [4] IGA-SVM 96.3 93.6 97.8 89.2 94.2 [9] LogitBoost 92.6 96.0 97.1 93.0 94.8 [6] AAC-PSSM-AC 94.0 96.0 97.1 92.5 95.0 [52] CWT-PCA-SVM 94.4 96.8 97.0 92.3 95.2 [18] IB1 95.0 95.8 97.8 94.2 95.7
This Study Comb 9,10,6 95.3 97.6 97.8 96.1 96.8
This Study Comb 11,10,6 96.3 96.8 97.1 96.1 96.6 This Study Comb 12,10,6 96.2 98.1 96.8 93.2 96.1
TABLE 5
The best results (in percentage %) achieved for 1189 benchmark (for combinations of feature vectors extracted for attributes number 9, 10, and 12 whileFphandFsare respectively set to 10 and 6) compared to the best results
reported in the literature.
References Method All-α All-β α+β α/β Overall [33] Bayes Classifier 54.8 57.1 75.2 22.2 53.8 [5] Logistic Regression 57.0 62.9 64.7 25.3 53.9 [13] SVM - - - - 54.7 [53] FKNN 48.9 59.5 81.7 26.6 56.9 [19] Stacking Ensemble - - - - 58.9 [54] WSVM - - - - 59.2 [48] Specific Tri-peptides - - - - 59.9 [18] IB1 65.3 67.7 79.9 40.7 64.7 [55] AAD-CGR 62.3 67.7 66.5 63.1 65.2 [39] SVM 75.8 75.2 82.6 31.8 67.6 [29] AADP-PSSM 69.1 83.7 85.6 35.7 70.7 [6] AAC-PSSM-AC 76.3 85.7 81.0 42.1 72.7
This Study Comb 9,10,6 82.1 85.1 84.8 39.4 74.3 This Study Comb 11,10,6 80.2 83.6 85.4 44.6 74.8
TABLE 6
The best results (in percentage %) achieved for 25PDB benchmark (for combinations of feature vectors extracted for attributes number 9, 10, and 12 whileFphandFsare respectively set to 10 and 6) compared to the best results
reported in the literature.
References Method All-α All-β α+β α/β Overall [5] Logistic Regression 69.1 61.6 60.1 38.3 57.1 [48] Specific Tri-peptides 60.6 60.7 67.9 44.3 58.6 [19] Stacking Ensemble - - - - 59.9 [24] LLSC-PRED 75.2 67.5 62.1 44.0 62.2 [24] SVM 77.4 66.4 61.3 45.4 62.7 [55] AAD-CGR 64.3 65 65.0 61.7 64.0 [52] CWT-PCA-SVM 76.5 67.3 66.8 45.8 64.0 [29] AADP-PSSM 83.3 78.1 76.3 54.4 72.9 [6] AAC-PSSM-AC 85.2 81.3 73.7 55.2 73.9
This Study Comb 9,10,6 85.8 81.2 79.2 59.7 76.3 This Study Comb 11,10,6 86.1 80.8 80.6 60.1 76.7
This Study Comb 12,10,6 85.2 81.4 79.1 59.1 76.0
of 95.7% reported in the literature for this benchmark [18]. We also achieved up to 96.6% prediction accuracy using (Comb 11,10,6) up to 0.9% better than previously reported results for this benchmark.
The proposed method also outperforms similar studies found in the literature for the 1189 and the 25PDB benchmarks. For the 1189 benchmark, we achieve up to 74.8% prediction accuracy (for Comb 11, 10, 6), 2.1% better than 72.7% achieved by reproducing the results of [6] on this benchmark (Table 5). This study also reports 76.7% prediction accuracy (for Comb 11, 10, 6), 2.8% better than 73.9% prediction accuracy achieved by reproducing the results of [6] for the 25PDB benchmark (Table 5).
In order to study the statistical significance of the prediction accuracy enhancement reported in this study, we conduct the paired t-test on our achieved results compared to the highest results reported in the literature. We note that the best prediction results reported on Z277, Z498, 1189, and 25PDB benchmarks in the previous studies are 88.8%, 95.7%, 72.7%, and 73.9%, respectively; while the corresponding results from the present study are 90.3%, 96.6%, 74.8%, and 76.7% (using comb 11,10,6 features). For the paired t-test, we get t-value equal to 4.484 with 3 degrees of freedom. Our results are statistically better than the best results from the previous studies at 5% significance level (pvalue equals to 0.0103). Achieved results highlight the promising performance of the proposed method to tackle the protein struc-tural class prediction problem compared to the previ-ous studies found in the literature. Beside enhancing the prediction performance for this task, our proposed methods introduce a new approach to explore poten-tial discriminatory information of the physicochemical-based features in conjunction with the evolutionary-based features which can be used for similar studies.
Exploring results individually for each structural class also shows that for all the employed benchmarks and almost all of the structural classes, proposed method is capable of achieving better results compared to the previously proposed approaches found in the literature
(especially the significant enhancement observed for dif-ficult classes (α/β)). It is important to highlight that the reported results are achieved by adding limited number of features to the number of features explored previ-ously [4], [12]. However, despite increasing the number of features, the proposed method provides important information about the impact of the physicochemical-based attributes for this task. This study also shows the importance of the attributes that have not been explored adequately or completely neglected in previous studies. Achieved results also emphasizes the importance and effectiveness of the proposed feature extraction methods based on the overlapped segmented distribution and autocorrelation concepts to provide more discriminatory information to enhance protein structural class predic-tion accuracy.
4
C
ONCLUSION ANDF
UTUREW
ORKSIn this paper, we have investigated the use of physicochemical-based attributes of the amino acids along with the evolutionary-based information con-tained in the PSSM for feature extraction. For this, we have selected 15 different physicochemical-based attributes and used each of these attributes to extract two kinds of features: 1) overlapped segmented distribution and 2) overlapped segmented autocorrelation. These fea-tures are concatenated with two other kinds of sequential features, PSSM AAC and PSSM AC, derived directly from the PSSM.
These features are studied for protein structural class prediction problem using an ensemble of different clas-sifiers on four different benchmarks widely used in the literature. The classification results are reported using the 10-fold cross validation process. The proposed fea-ture extraction method has been found to perform better than the previously reported results for the protein struc-tural class prediction problem for all the four employed benchmarks [6], [18]. This illustrates the importance of the physicochemical-based attributes (that have not been explored earlier for this task) as well as the overlapped
segmented-based feature extraction procedure to pro-vide more local and global discriminatory information to tackle the protein structural class prediction problem. For future studies, we aim to explore a wider range of segmented-based feature extraction methods as well as novel weighted-based ensemble of different classifiers. We also aim to collaborate with biological experts to investigate the significant of the explored features in the biological perspective.
A
PPENDIXA
PPENDIXA: T
HEA
TTRIBUTES
ELECTIONP
ROCEDUREFor a given physicochemical-based attribute, we first extracted six feature groups as follows: Overlapped segmented-based distribution using 10% distribution factor; Overlapped segmented-based distribution using 5% distribution factor; Segmented density using 5% dis-tribution factor (for this feature group, protein sequence is divided into 20 segments with equal length in which each segment is 5% of total length of protein sequence. Then we calculate density of the explored attribute for each segment (20 features in total). We also add the global density feature to this features to build this feature group (21 features in total)); Overlapped segmented-based autocorrelation using 25% distribution factor and 75% overlapping factor; Overlapped segmented-based autocorrelation using 10% distribution factor and 70% overlapping factor; and overlapped segmented based au-tocorrelation in which the protein sequence is segmented into equal length segments (where each segment is 10% of the total length of protein sequence. Then segmented autocorrelation is calculated in this feature group in the similar manner that explained in the manuscript using 70% overlapping factor.).
In the second step, we applied five different classifiers implemented in WEKA namely, Nave Bayes (default pa-rameters adopted), Adaboost.M1 (using 100 base learn-ers and C4.5 as the base learner), Random Forest (using 100 base learners as it was used in [11]), SVM (default pa-rameters are adopted), and KNN (default papa-rameters are adopted) to each extracted feature group individually. Therefore, 30 prediction accuracies were achieved for each individual physicochemical-based attributes (corre-sponding to each classifier used for six different feature groups (6 5 = 30). Finally, we select 15 attributes that attained better results in average for all these 30 pre-diction accuracies among all 115 physicochemical-based attributes explored in this study.
R
EFERENCES[1] M. Levitt and C. Chothia, “Structural patterns in globular pro-teins,”Nature, vol. 261, no. 5561, pp. 552–558, 1976.
[2] A. G. Murzin, S. E. Brenner, T. Hubbard, and C. Chothia, “Scop: A structural classification of proteins database for the investigation of sequences and structures,”Journal of Molecular Biology, vol. 247, no. 4, pp. 536–540, 1995.
[3] M. Mizianty and L. A. Kurgan, “Modular prediction of protein structural classes from sequences of twilight-zone identity with predicting sequences,”BMC Bioinformatics, vol. 10, no. 1, p. 414, 2009.
[4] Z. C. Li, X. B. Zhou, Y. R. Lin, and X. Y. Zou, “Prediction of protein structure class by coupling improved genetic algorithm and support vector machine,” Amino Acids, vol. 35, no. 3, pp. 581–590, 2008.
[5] L. A. Kurgan and L. Homaeian, “Prediction of structural classes for protein sequences and domains - impact of prediction algo-rithms, sequence representation and homology, and test proce-dures on accuracy,” Pattern Recognition, vol. 39, pp. 2323–2343, 2006.
[6] T. Liu, X. Geng, X. Zheng, R. Li, and J. Wang, “Accurate prediction of protein structural class using auto covariance transformation of psi-blast profiles,”Amino Acids, vol. 42, pp. 2243–2249, 2012. [7] L. A. Kurgan, T. Zhang, H. Zhang, S. Shen, and J. Ruan,
“Secondary structure-based assignment of the protein structural classes,”Amino Acids, vol. 35, pp. 551–564, 2008.
[8] J. Y. Yang, Z. L. Peng, and X. Chen, “Prediction of protein structural classes for low-homology sequences based on predicted secondary structure,” BMC Bioinformatics, vol. 11, no. Suppl 1, p. S9, 2010.
[9] K. Y. Feng, Y. D. Cai, and K. C. Chou, “Boosting classifier for predicting protein domain structural class,” Biochemical and Biophysical Research Communications, vol. 334, no. 1, pp. 213–217, 2005.
[10] B. Niu, Y. D. Cai, W. C. Lu, G. Z. Li, and K. C. Chou, “Predicting protein structural class with adaboost learner,”Protein and Peptide Letters, vol. 13, no. 5, pp. 489–492, 2006.
[11] A. Dehzangi and S. Karamizadeh, “Solving protein fold prediction problem using fusion of heterogeneous classifiers,” INFORMA-TION, An International Interdisciplinary Journal, vol. 14, no. 11, pp. 3611–3622, 2011.
[12] Y. D. Cai, K. Feng, W. Lu, and K. Chou, “Using logitboost classifier to predict protein structural classes,”Theoretical Biollogy, vol. 238, pp. 172–176, 2006.
[13] A. Anand, G. Pugalenthi, and P. N. Suganthan, “Predicting pro-tein structural class by svm with class-wise optimized features and decision probabilities,”Journal of Theoretical Biology, vol. 253, no. 2, pp. 375–380, 2008.
[14] Y. D. Cai, X. J. Liu, X. B. Xu, and K. C. Chou, “Prediction of protein structural classes by support vector machines,”Computers and Chemistry, vol. 26, no. 3, pp. 293–296, 2002.
[15] Y. D. Cai and G. P. Zhou, “Prediction of protein structural classes by neural network,”Biochimie, vol. 82, no. 8, pp. 783–785, 2000. [16] S. Jahandideh, P. Abdolmaleki, M. Jahandideh, and E. B.
Asad-abadi, “Novel two-stage hybrid neural discriminant model for predicting proteins structural classes,”Biophysical Chemistry, vol. 128, no. 1, pp. 87–93, 2007.
[17] S. Jahandideh, P. Abdolmaleki, M. Jahandideh, and S. H. S. Hayatshahi, “Novel hybrid method for the evaluation of param-eters contributing in determination of protein structural classes,”
Journal of Theoretical Biology, vol. 244, no. 2, pp. 275–281, 2007. [18] K. Chen, L. A. Kurgan, and J. Ruan, “Prediction of protein
struc-tural class using novel evolutionary collocation-based sequence representation,”Journal of Computational Chemistry, vol. 29, no. 10, pp. 1596–1604, 2008.
[19] K. D. Kedarisetti, L. A. Kurgan, and S. Dick, “Classifier ensembles for protein structural class prediction with varying homology,”
Biochemical and Biophysical Research Communications, vol. 348, no. 3, pp. 981–988, 2006.
[20] A. Dehzangi and S. Phon-Amnuaisuk, “Fold prediction problem: The application of new physical and physicochemical- based features,”Protein and Peptide Letters, vol. 18, no. 2, pp. 174–185, 2011.
[21] A. Dehzangi, S. Phon-Amnuaisuk, and O. Dehzangi, “Enhancing protein fold prediction accuracy by using ensemble of different classifiers,” Australian Journal of Intelligent Information Processing Systems, vol. 26, no. 4, pp. 32–40, 2010.
[22] K. Kavousi, B. Moshiri, M. Sadeghi, B. N. Araabi, and A. A. Moosavi-Movahedi, “A protein fold classifier formed by fusing different modes of pseudo amino acid composition via pssm,”
Computational Biology and Chemistry, vol. 35, no. 1, pp. 1–9, 2011. [23] A. Sharma, J. Lyons, A. Dehzangi, and K. K. Paliwal, “A fea-ture extraction technique using bi-gram probabilities of position
specific scoring matrix for protein fold recognition,” Journal of Theoretical Biology, vol. 320, no. 0, pp. 41–46, 2013.
[24] L. A. Kurgan and K. Chen, “Prediction of protein structural class for the twilight zone sequences,”Biochemical and Biophysical Research Communications, vol. 357, no. 2, pp. 453–460, 2007. [25] G. P. Zhou, “An intriguing controversy over protein structural
class prediction,”Journal of Protein Chemistry, vol. 17, pp. 729–738, 1998.
[26] L. A. Kurgan and L. Homaeian, “Prediction of secondary pro-tein structure content from primary sequence alone - a feature selection based approach,” inMachine Learning and Data Mining in Pattern Recognition, 4th International Conference, MLDM, 2005, pp. 334–345.
[27] M. M. Gromiha, “A statistical model for predicting protein folding rates from amino acid sequence with structural class informa-tion,”Journal of Chemical Information and Modeling, vol. 45, no. 2, pp. 494–501, 2005.
[28] C. Ding and I. Dubchak, “Multi-class protein fold recognition us-ing support vector machines and neural networks,”Bioinformatics, vol. 17, pp. 349–358, 2001.
[29] T. Liu and C. Jia, “A high-accuracy protein structural class predic-tion algorithm using predicted secondary structural informapredic-tion,”
Journal of Theoretical Biology, vol. 267, no. 3, pp. 272–275, 2010. [30] S. F. Altschul, T. L. Madden, A. A. Schaffer, J. H. Zhang, Z. Zhang,
W. Miller, and D. J. Lipman, “Gapped blast and psi-blast: a new generation of protein database search programs,”Nucleic Acids Research, vol. 17, pp. 3389–3402, 1997.
[31] L. A. Kurgan, K. J. Cios, and K. Chen, “Scpred: Accurate pre-diction of protein structural class for sequences of twilight-zone similarity with predicting sequences,”BMC Bioinformatics, vol. 9, p. 226, 2008.
[32] P. Ghanty and N. R. Pal, “Prediction of protein folds: Extraction of new features, dimensionality reduction, and fusion of hetero-geneous classifiers,”NanoBioscience, IEEE Transactions on, vol. 8, no. 1, pp. 100–110, 2009.
[33] Z. X. Wang and Z. Yuan, “How good is prediction of protein structural class by the component-coupled method?” Proteins: Structure, Function, and Bioinformatics, vol. 38, no. 2, pp. 165–175, 2000.
[34] S. Kawashima, P. P. M. Pokarowska, A. Kolinski, T. Katayama, and M. Kanehisa, “Aaindex: Amino acid index database, progress report,”Neucleic Acids, vol. 36, pp. D202–D205, 2008.
[35] V. S. Mathura and D. Kolippakkam, “Apdbase: Amino acid physico-chemical properties database,” Bioinformation, vol. 12, no. 1, pp. 2–4, 2005.
[36] Q. Dong, S. Zhou, and G. Guan, “A new taxonomy-based protein fold recognition approach based on autocross-covariance trans-formation,”Bioinformatics, vol. 25, no. 20, pp. 2655–2662, 2009. [37] X. Zheng, C. Li, and J. Wang, “An information-theoretic approach
to the prediction of protein structural class,”Journal of Computa-tional Chemistry, vol. 31, no. 6, pp. 1201–1206, 2010.
[38] Y. S. Ding, T. L. Zhang, and K. C. Chou, “Prediction of protein structure classes with pseudo amino acid composition and fuzzy support vector machine network,” Protein and Peptide Letters, vol. 14, no. 8, pp. 811–815, 2007.
[39] C. Chen, X. Zhou, Y. Tian, X. Zou, and P. Cai, “Predicting protein structural class with pseudo-amino acid composition and support vector machine fusion network,”Analytical Biochemistry, vol. 357, no. 1, pp. 116–121, 2006.
[40] G. I. Webb, “Multiboosting: A technique for combining boosting and wagging,”Machine Learning, vol. 40, no. 2, pp. 156–196, 2000. [41] T. G. Dietterich, “Ensemble methods in machine learning,” in
International Workshop on Multipe Classifier Systems, 2000, pp. 1– 15.
[42] A. Dehzangi, S. Phon-Amnuaisuk, K. H. Ng, and E. Mohandesi, “Protein fold prediction problem using ensemble of classifiers,” in
Proceedings of the 16th International Conference on Neural Information Processing: Part II, ser. ICONIP ’09, 2009, pp. 503–511.
[43] I. Witten and E. Frank, Data Mining: Practical Machine Learning Tools and Techniques, 2nd ed. Morgan Kaufmann, San Francisco, 2005.
[44] Y. Freund and R. E. Schapire, “Experiments with a new boosting algorithm,” inInternational Conference on Machine Learning, 1996, pp. 148–156.
[45] P. Jain and J. Hirst, “Automatic structure classification of small proteins using random forest,”BMC Bioinformatics, vol. 11, no. 1, p. 364, 2010.
[46] J. Friedman, T. Hastie, and R. Tibshirani, “Additive logistic regres-sion: a statistical view of boosting,”Annals of Statistics, vol. 28, pp. 337–407, 2000.
[47] V. N. Vapnik,The Nature of Statistical Learning Theory. Springer-Verlag, 1999.
[48] S. Costantini and A. M. Facchiano, “Prediction of the protein structural class by specific peptide frequencies,”Biochimie, vol. 91, no. 2, pp. 226–229, 2009.
[49] M. M. Gromiha, “Multiple contact network is a key determinant to protein folding rates,”Journal of Chemical Information and Mod-eling, vol. 49, no. 4, pp. 1130–1135, 2009.
[50] B. Efron and G. Gong, “A leisurely look at the bootstrap, the jackknife, and cross-validation,”The American Statistics, vol. 37, no. 1, pp. 36–48, 1983.
[51] Y. D. Cai, X. J. Liu, X. B. Xu, and G. P. Zhou, “Support vector ma-chines for predicting protein structural class,”BMC Bioinformatics, vol. 2, no. 1, p. 3, 2001.
[52] Z. C. Li, X. B. Zhou, Z. Dai, and X. Y. Zou, “Prediction of protein structural classes by chou’s pseudo amino acid composition: approached using continuous wavelet transform and principal component analysis,”Amino Acids, vol. 37, pp. 415–425, 2009. [53] T. L. Zhang, Y. S. Ding, and K. C. Chou, “Prediction protein
struc-tural classes with pseudo amino acid composition: approximate entropy and hydrophobicity pattern,”Theoretical Biology, vol. 250, pp. 186–193, 2008.
[54] J. D. Qiu, S. H. Luo, J. H. Huang, and R. P. Liang, “Using support vector machines for prediction of protein structural classes based on discrete wavelet transform,”Journal of Computational Chemistry, vol. 30, no. 8, pp. 1344–1350, 2009.
[55] J. Y. Yang, Z. L. Peng, Z. G. Yu, R. J. Zhang, V. Anh, and D. Wang, “Prediction of protein structural classes by recurrence quantifi-cation analysis based on chaos game representation,” Journal of Theoretical Biology, vol. 257, no. 4, pp. 618–626, 2009.
Abdollah Dehzangireceived the B.Sc. degree in Computer Engineering-Hardware from Shiraz University, Iran in 2007 and Master degree, in the area of bioinformatics from Multi Media Uni-versity (MMU), Cyberjaya, Malaysia, in 2011. Since 2011, He is pursuing the Ph.D. degree in Bioinformatics at Griffith University Brisbane, Australia. He is also a researcher in National ICT Australia (NICTA). His research interests include Bioinformatics, protein fold and structural class prediction problems, data mining, statisti-cal learning theory, and pattern recognition.
Kuldip Paliwalreceived the B.S. degree from Agra University, Agra, India, in 1969, the M.S. degree from Aligarh Muslim University, Aligarh, India, in 1971 and the Ph.D. degree from Bom-bay University, BomBom-bay, India, in 1978. He has been carrying out research in the area of speech processing since 1972. He has worked at a num-ber of organizations including Tata Institute of Fundamental Research, Bombay, India, Norwe-gian Institute of Technology, Trondheim, Norway, University of Keele, U.K., AT&T Bell Labora-tories, Murray Hill, New Jersey, U.S.A., AT&T Shannon Laboratories, Florham Park, New Jersey, U.S.A., and Advanced Telecommunication Research Laboratories, Kyoto, Japan. Since July 1993, he has been a professor at Griffith University, Brisbane, Australia, in the School of Micro electronic Engineering. His current research interests include speech recognition, speech coding, speaker recognition, speech enhancement, face recognition, image coding, bioinformatics, protein fold and struc-tural class prediction problems, pattern recognition and artificial neural networks. He has published more than 300 papers in these research areas. Dr. Paliwal is a Fellow of Acoustical Society of India. He has served the IEEE Signal Processing Societys Neural Networks Tech-nical Committee as a founding member from 1991 to 1995 and the Speech Processing Technical Committee from 1999 to 2003. He was an Associate Editor of the IEEE Transactions on Speech and Audio Processing during the periods 1994–1997 and 2003-2004. He also served as Associate Editor of the IEEE Signal Processing Letters from 1997 to 2000. He was the editor–in–chief of Speech Communication Journal from 2005 to 2011. He was the General Co-Chair of the Tenth IEEE Workshop on Neural Networks for Signal Processing (NNSP2000).
Alok Sharmareceived the BTech degree from the University of the South Pacific (USP), Suva, Fiji, in 2000 and the MEng degree, with an aca-demic excellence award, and the PhD degree in the area of pattern recognition from Griffith Uni-versity, Brisbane, Australia, in 2001 and 2006, respectively. He was with the University of Tokyo (2010-2012) as a research fellow. He is also with the Signal Processing Laboratory, Griffith Uni-versity, and the University of the South Pacific. He participated in various projects carried out in conjunction with Motorola (Sydney), Auslog Pty., Ltd. (Brisbane), CRC Micro Technology (Brisbane), the French Embassy (Suva) and JSPS (Japan). His research interests include pattern recognition, computer security, human cancer classification and protein fold and structural class prediction problems. He reviewed several articles and is in the editorial board of several journals. He is a member of IEEE.
Omid Dehzangireceived his B.Eng and M.Eng degrees in computer engineering from Shi-raz University, Iran, 2004 and 2007. He re-ceived his Ph.D. degree in computer engineer-ing at Nanyang Technological University, Sengineer-inga- Singa-pore 2012. He is currently working as a post-doctoral researcher in Electrical Engineering De-partment, University of Texas at Dallas. His research interests include pattern recognition, brain-computer interface, speech and signal pro-cessing, bioinformatics, protein fold and struc-tural class prediction problems, and discriminative analysis.
Abdul Sattarholds a BSc (Physics, Chemistry and Mathematics) and an MSc (Physics) from the University of Rajasthan, India, in 1977, and 1979 an MPhil in Computer and Systems Sci-ences from the Jawaharlal Nehru University, In-dia, and an MMath in Computer Science from the University of Waterloo, Canada, and a PhD in Computer Science (with specialization in Arti-ficial Intelligence) from the University of Alberta, Canada, in 1990. He is the founding Director of the Institute for Integrated and Intelligent Sys-tems and a Professor of Computer Science and Artificial Intelligence at Griffith University. He is also a Research Leader at National ICT Australia (NICTA) Queensland Research Lab (QRL), where he has held the positions of QRL Education Director (2006-08) and Leader of the Smart Applications For Emergencies (SAFE) project (2005-08), and is currently leading the QRL node of NICTA’s largest project, Advanced Technologies for Optimization and Modelling In Constraints (ATOMIC). He has been an academic staff member at Griffith University since February 1992 as a lecturer (1992-95), senior lecturer (1996-99), and professor (2000-present) within the School of Information and Commu-nication Technology. Prior to his career at Griffith University, he was a lecturer in Physics in Rajasthan, India (1980-82), and a research scholar at Jawaharlal Nehru University, India (1982-85), the University of Water-loo, Canada (1985-87), and the University of Alberta, Canada (1987-1991). His research interests include knowledge representation and reasoning, constraint satisfaction, intelligent scheduling, rational agents, propositional satisfiability, temporal reasoning, temporal databases, and bioinformatics.