DIETARY INTAKE OF FLAVONOIDS, BARRETT’S ESOPHAGUS DEVELOPMENT, AND ESOPHAGEAL AND GASTRIC CANCER INCIDENCE AND SURVIVAL
JESSICA L. PETRICK
A dissertation submitted to the faculty of the University of North Carolina at Chapel Hill in partial fulfillment of the requirements for the degree of Doctor of Philosophy in the Department of
Epidemiology in the Gillings School of Global Public Health.
Chapel Hill 2014
Approved by: Marilie D. Gammon Patrick T. Bradshaw Lawrence S. Engel Ka He
ABSTRACT
Jessica L. Petrick: Dietary Intake of Flavonoids, Barrett’s Esophagus Development, and Esophageal and Gastric Cancer Incidence and Survival
(Under the direction of Marilie D. Gammon)
Flavonoids, polyphenolic compounds concentrated in fruits and vegetables, have experimentally demonstrated chemopreventive effects against esophageal and gastric cancer and Barrett’s esophagus, a precursor lesion for esophageal adenocarcinoma. Few
epidemiologic studies have examined flavonoids and incidence of esophageal and gastric cancers, and none have considered flavonoids with survival. Additionally, only one
epidemiologic investigation has reported an inverse association between isoflavone intake and Barrett’s esophagus risk, yet no study has considered other flavonoid classes, which are more commonly consumed in the U.S. This ancillary study built upon the U.S. Multi-Center Study (esophageal adenocarcinoma cases n=274, gastric cardia adenocarcinoma cases n=248, esophageal squamous cell carcinoma cases n=191, other gastric adenocarcinoma cases n=341, and frequency-matched controls n=662) and the Study of Reflux Disease (Barrett’s esophagus cases n=170 and matched controls n=183). Esophageal and gastric cancer cases were followed until 2000 for vital status. Participants completed a food frequency questionnaire, and responses were linked with USDA Flavonoid Databases and available literature for six flavonoid classes and lignans. Multivariable-adjusted odds ratios (ORs) and hazard ratios (HRs) [95% confidence intervals (CI)] were estimated, comparing highest versus lowest intake
anthocyanidins, common in wine and fruit juice, was associated with a reduction in the risk of 57% for developing esophageal adenocarcinoma (OR=0.43, 95% CI: 0.29-0.66), 57% for developing squamous cell carcinoma (OR=0.43, 95% CI: 0.26-0.70), and 41% for developing Barrett’s esophagus. ORs for isoflavones, for which coffee was the main source, were increased for all cancer types, except esophageal squamous cell carcinoma. A modest increased risk of Barrett’s esophagus development was observed for flavones, for which the main dietary source in this population was pizza. Anthocyanidins were associated with decreased risk of mortality for gastric cardia (HR=0.63, 95% CI: 0.42-0.95) and more modestly for esophageal
adenocarcinoma (HR=0.87, 95% CI: 0.60-1.26). Our findings, if confirmed, suggest that
To Mama Dee, who lost her battle with esophageal cancer and is my muse for this work. To my mother, whose courage as a single mother has always inspired me. Without your
ceaseless support, none of this would be possible.
ACKNOWLEDGEMENTS
This dissertation was completed through the support of so many individuals; I am at a loss as to how to appropriately express my gratitude to everyone.
First and foremost, thank you to my wonderful advisor, Marilie Gammon. My time at UNC has been molded by her guidance. She truly goes above and beyond for her students to ensure that they succeed. I am also deeply grateful for my committee members and other collaborators, who have given thoughtful advice and suggestions time and time again.
I am grateful for the love and support of my family – especially my Mom, grandparents (Mama Dee and Papa John), and great-grandparents (Maw-Maw and Paw-Paw). Throughout the years they have guided, supported, and encouraged my educational endeavors. I also want to acknowledge my in-laws, Andy and Jeanne, for their constant encouragement and support.
Thank you to all my friends, particularly Aliza Gellman-Chomsky, Annah Wyss, and Jenni Wheeler, who know the trials and tribulations that this process involves. We have shared the best of times and worst of times during our tenure at UNC. Additionally, I want to thank all the students and post-docs in the Gammon Research Group, who have provided wonderful feedback throughout this process.
TABLE OF CONTENTS
Page
List of Tables ... xii
List of Figures ... xvi
List of Abbreviations ...xvii
CHAPTER 1: BACKGROUND ... 1
Introduction ... 1
Epidemiology of Esophageal and Gastric Cancer Incidence ... 3
Epidemiology of Esophageal and Gastric Cancer Survival ... 5
Esophageal and Gastric Cardia Adenocarcinoma ... 7
Esophageal and Gastric Cardia Adenocarcinoma Risk Factors ... 7
Flavonoids and Esophageal/Gastric Cardia Adenocarcinoma: Biologic Mechanisms ... 12
Epidemiology of Flavonoids and Esophageal/Gastric Cardia Adenocarcinoma ... 15
Role of Cell Cycle-Related Genes: Cyclin D1 and p53 ... 17
Flavonoid use During Cancer Progression and Chemotherapy ... 18
Esophageal and Gastric Cardia Adenocarcinoma Prognostic Factors ... 20
Precursor Lesion of Esophageal/Gastric Cardia Adenocarcinoma: Barrett’s Esophagus ... 23
Epidemiology of Barrett’s Esophagus Prevalence ... 24
Barrett’s Esophagus Risk Factors ... 26
Flavonoids and Barrett’s Esophagus: Biologic Mechanisms ... 28
Barrett’s Esophagus: Natural History ... 29
Esophageal Squamous Cell Carcinoma and Non-cardia Gastric Adenocarcinoma ... 30
Esophageal Squamous Cell Carcinoma/Non-cardia Gastric Adenocarcinoma Risk Factors ... 31
Flavonoids and Esophageal Squamous Cell Carcinoma/ Non-cardia Gastric Adenocarcinoma: Biologic Mechanisms ... 35
Epidemiology of Flavonoids and Esophageal Squamous Cell Carcinoma/Non-cardia Gastric Adenocarcinoma ... 39
Role of Cell Cycle-Related Genes: Cyclin D1 and P53 ... 41
Esophageal Squamous Cell Carcinoma/Non-cardia Gastric Adenocarcinoma Prognostic Factors... 42
Specific Aims ... 44
Summary ... 48
References ... 49
CHAPTER 2: METHODS ... 69
Overview of Study Methods ... 69
Study Populations ... 69
Demographics of Study Participants ... 72
Exposure Assessment ... 73
Outcome Assessment: Cyclin D1 and P53 Status ... 77
Archived Tumor Block Collection ... 77
Processing and Staining. Cyclin D1 ... 78
Processing and Staining. P53 ... 78
Interpretation. Cyclin D1 ... 78
Interpretation. P53 ... 79
Outcome Assessment: Segment Length ... 79
Interpretation ... 79
Outcome Assessment: Vital Status ... 80
Covariate Assessment ... 80
Study Design ... 82
Results from Previous Analyses ... 83
Statistical Analysis ... 83
Data Management/Quality Control ... 84
Descriptive Analysis for the Ancillary Study... 85
Exposure Variable Construction ... 85
Analysis to Address Specific Aim 1 ... 86
Analysis to Address Specific Aim 2 ... 87
Logisitic Regression Analyses for Specific Aims 1 and 2 ... 88
Analysis to Address Specific Aim 3 ... 88
Total Energy Intake ... 89
Sensitivity Analysis ... 90
Statistical Power ... 91
Strengths and Weaknesses ... 92
Summary ... 95
References ... 129
CHAPTER 3: DIETARY INTAKE OF FLAVONOIDS AND ESOPHAGEAL AND GASTRIC CANCER: INCIDENCE AND SURVIVAL IN THE UNITED STATES (U.S.) ... 136
Introduction ... 136
Methods ... 137
Study Population ... 138
Exposure Assessment ... 139
Outcome Assessment ... 140
Statistical Analysis ... 141
Case-control Analysis ... 141
Survival Analysis ... 142
Examination of Linear Trend ... 142
Sensitivity Analysis ... 142
Results ... 143
Discussion ... 145
References ... 162
CHAPTER 4: DIETARY FLAVONOID INTAKE AND BARRETT’S ESOPHAGUS IN WESTERN WASHINGTON STATE ... 167
Introduction ... 167
Methods ... 168
Study Population ... 168
Exposure Assessment ... 169
Assessment of Dietary Flavonoid Intake ... 169
Statistical Analysis ... 170
Sensitivity Analysis ... 171
Results ... 171
Discussion ... 172
References ... 188
CHAPTER 5: DISCUSSION ... 191
Summary of Results ... 192
Study Strengths ... 192
Cancer Continuum ... 192
Geographic Variation ... 194
Flavonoid and Lignan Database ... 194
Study Design and Sample Size ... 195
Study Limitations ... 195
Exposure Misclassification: Dietary Recall ... 195
Lack of Certain Flavonoid-rich Foods and Supplements in Food Frequency Questionnaire ... 196
Bioavailabilty of Flavonoids ... 196
Flavonoid Classification ... 197
Healthy Lifestyle ... 197
Error Estimating Flavonoid Content ... 197
Sample Size Limitations ... 198
Multiple Comparisons ... 198
Generalizability and Selection Bias ... 199
Future Direction ... 199
Disentangling Effects of Antioxidants ... 199
Utilizing Flavonoid Gram Weights ... 200
Possible Future Research Designs ... 200
Public Health Implications... 202
Conclusion ... 203
LIST OF TABLES
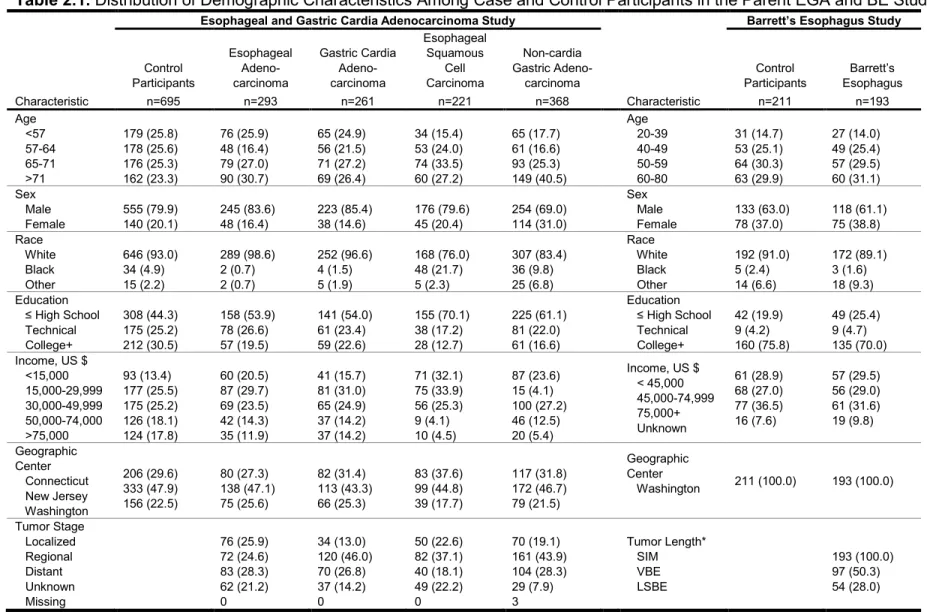
Page Table 2.1. Distribution of Demographic Characteristics Among Case and
Control Participants in the Parent EGA and BE Studies ... 96 Table 2.2. Fred Hutchinson Cancer Research Center Food Frequency
Questionnaire Items That Contain at Least One Class of Flavonoid ... 97 Table 2.3. Adjusted Odds Ratios and 95% Confidence Intervals for the
Association Between Flavonoid and Lignan Intake and Risks of
Esophageal and Gastric Cancer, U.S. Multi-Center Study: Connecticut,
New Jersey, and Western Washington State, 1993-1995 ... 104 Table 2.4. Adjusted Odds Ratios and 95% Confidence Intervals for the
Association Between Flavonoid and Lignan Intake and Barrett’s Esophagus, Study of Reflux Disease, Western Washington State,
1997-2000 ... 107 Table 2.5. Adjusted Odds Ratios for Cyclin D1 Positive (+) and Cyclin D1
Negative (-) Esophageal and Gastric Cancer in Relation to Total
Flavonoid Intake by Tumor Type, U.S. Multi-Center Study: Connecticut,
New Jersey, and Western Washington State, 1993-1995 ... 112 Table 2.6. Adjusted Odds Ratios for P53 Positive (+) and P53 Negative (-)
Esophageal and Gastric Cancer in Relation to Total Flavonoid Intake by Tumor Type, U.S. Multi-Center Study: Connecticut,
New Jersey, and Western Washington State, 1993-1995 ... 113 Table 2.7. Adjusted Odds Ratios for Esophageal and Gastric Cancer Stage
in Relation to Total Flavonoid Intake by Tumor Type, U.S. Multi-Center Study: Connecticut, New Jersey, and Western Washington State,
1993-1995 ... 114 Table 2.8. Adjusted Odds Ratios and 95% Confidence Intervals from
Conditional Logistic Regression Models for the Association Between Flavonoid and Lignan Intake and Barrett’s Esophagus, Study of
Reflux Disease, Western Washington State, 1997-2000 ... 115 Table 2.9. Adjusted Odds Ratios and 95% Confidence Intervals for Effect
Measure Modification Between Total Flavonoid Intake and Body Mass Index (BMI) and Esophageal and Gastric Cancer, U.S.
Multi-Center Study: Connecticut, New Jersey, and Western Washington
State, 1993-1995 ... 117 Table 2.10. AdjustedOdds Ratios and 95% Confidence Intervals for Effect
Measure Modification Between Total Flavonoid Intake and Cigarette Smoking and Esophageal and Gastric Cancer, U.S. Multi-Center Study:
Table 2.11. Adjusted Odds Ratios and 95% Confidence Intervals for Effect Measure Modification Between Total Flavonoid Intake and
Gastroesophageal Reflux Disease and Esophageal and Gastric Cancer, U.S. Multi-Center Study: Connecticut, New Jersey, and Western
Washington State, 1993-1995 ... 119 Table 2.12. Adjusted Odds Ratios and 95% Confidence Intervals for Effect
Measure Modification Between Total Flavonoid Intake and Body Mass Index (BMI) and Barrett’s Esophagus, Study of Reflux Disease,
Western Washington State, 1997-2000 ... 120 Table 2.13. Adjusted Odds Ratios and 95% Confidence Intervals for Effect
Measure Modification Between Total Flavonoid Intake and Cigarette Smoking and Barrett’s Esophagus, Study of Reflux Disease, Western
Washington State, 1997-2000 ... 121 Table 2.14. Adjusted Odds Ratios and 95% Confidence Intervals for the
Association Between Flavonoid and Lignan Intake Among Non-proxy Incident Esophageal and Gastric Cancers, U.S. Multi-Center Study:
Connecticut, New Jersey, and Western Washington State, 1993-1995 ... 122 Table 2.15. Adjusted Hazard Ratios and 95% Confidence Internals for
Flavonoid and Lignan Intake and Overall Mortality Among Non-proxy Esophageal and Gastric Cancer Cases by Tumor Type, U.S.
Multi-Center Study: Connecticut, New Jersey, and Western Washington
State, 1993–1995 through 2000 ... 124 Table 2.16. Sensitivity Analysis of Adjusted Odds Ratios and 95% Confidence
Intervals for the Association Between Total Flavonoid Intake and Esophageal and Gastric Cancer, U.S. Multi-Center Study: Connecticut,
New Jersey, and Western Washington State, 1993-1995 ... 126 Table 2.17. Sensitivity Analysis of Adjusted Odds Ratios and 95% Confidence
Intervals for the Association Between Total Flavonoid Intake and Barrett’s Esophagus, Study of Reflux Disease, Western Washington
State, 1997-2000 ... 127 Table 2.18. Power Calculations for Risk of Esophageal and Gastric Tumors
Development and Survival Among Esophageal and Gastric Cancer Cases for Dichotomous (2 level), Quartiled (4 level) or Tertiled
(3 level) Exposures ... 128 Table 3.1. Mean Intakes (mg/day) of Flavonoids and Lignans Among Case
and Control Participants, U.S. Multi-Center Study, Connecticut,
New Jersey, and Western Washington State: 1993-1995 ... 151 Table 3.2. Major Sources of Flavonoids and Lignans Among a Population-
based Sample of Control Participants Without Esophageal or Gastric Cancer With Information on Dietary Intake, U.S. Multi-Center Study:
Table 3.3. Adjusted Odds Ratios and 95% Confidence Intervals for Associations Between Flavonoid and Lignan Intake and Esophageal and Gastric Cancer Incidence by Tumor Type, U.S. Multi-Center Study: Connecticut,
New Jersey, and Western Washington State, 1993-1995 ... 153 Table 3.4. Adjusted Hazard Ratios and 95% Confidence Intervals for Flavonoid
and Lignan Intake and Overall Mortality in Esophageal and Gastric Cancer Cases by Tumor Type, U.S. Multi-Center Study: Connecticut,
New Jersey, and Western Washington State, 1993-1995 through 2000 ... 155 Table 3.5. Distribution of Characteristics Among Control Participants and
Esophageal and Gastric Cancer Patients by Tumor Type, U.S.
Multi-Center Study: Connecticut, New Jersey, and Western Washington
State, 1993-1995 ... 157 Table 3.6. Sensitivity Analysis of Mean Intakes (mg/day) of Anthocyanidins
(Bananas Included versus Excluded), U.S. Multi-Center Study,
Connecticut, New Jersey, and Western Washington State: 1993-1995 ... 158 Table 3.7. Sensitivity Analysis of the Major Sources of Anthocyanidins
(Bananas Included versus Excluded) Among a Population-based Sample of Control Participants Without Esophageal or Gastric Cancer With Information on Dietary Intake, U.S. Multi-Center Study:
Connecticut, New Jersey, and Western Washington State, 1993-1995 ... 159 Table 3.8. Sensitivity Analysis of Adjusted Odds Ratios and 95% Confidence
Intervals for the Association Between Anthocyanidin Intake (Bananas Included versus Excluded) and Esophageal and Gastric Cancer Incidence by Tumor Type, U.S. Multi-Center Study: Connecticut,
New Jersey, and Western Washington State, 1993-1995 ... 160 Table 3.9. Sensitivity Analysis of Adjusted Hazard Ratios and 95% Confidence
Intervals for Anthocyanidin Intake (Bananas Included versus Excluded) and Overall Mortality in Esophageal and Gastric Cancer Cases by Tumor Type, U.S. Multi-Center Study: Connecticut, New Jersey, and
Western Washington State, 1993-1995 through 2000 ... 161 Table 4.1. Mean Intakes (mg/day) of Flavonoids and Lignans Among Cases
and Controls With Information on Dietary Intake, Study of Reflux
Disease, Western Washington State, 1997-2000 ... 178 Table 4.2. Major Dietary Sources of Flavonoids and Lignans Among a
Community-based Sample of Control Participants Without Barrett’s Esophagus, Study of Reflux Disease, Western Washington State,
1997-2000 ... 179 Table 4.3. Adjusted Odds Ratios and 95% Confidence Intervals for the
Association Between Flavonoid and Lignan Intake and Barrett’s Esophagus, Study of Reflux Disease, Western Washington State,
Table 4.4. Adjusted Odds Ratios and 95% Confidence Intervals for the Association Between Flavonoid and Lignan Intake and Barrett’s Esophagus Segment Length, Study of Reflux Disease, Western
Washington State, 1997-2000 ... 181 Table 4.5. Distribution of Characteristics Among Barrett’s Esophagus Cases
and Controls with Information on Dietary Intake, Study of Reflux Disease,
Western Washington State, 1997-2000 ... 182
Table 4.6. Sensitivity Analysis of Mean Intakes (mg/day) of Anthocyanidins (Bananas Included versus Excluded) Among Cases and Controls With Information on Dietary Intake, Study of Reflux Disease, Western
Washington State, 1997-2000 ... 184 Table 4.7. Sensitivity Analysis of the Major Sources of Anthocyanidins
(Bananas Included versus Excluded) Among a Community-based Sample of Control Participants Without Barrett’s Esophagus With Information on Dietary Intake, Study of Reflux Disease, Western
Washington State, 1997-2000 ... 185 Table 4.8. Sensitivity Analysis of Adjusted Odds Ratios and 95% Confidence
Intervals for the Association Between Anthocyanidin Intake (Bananas Included versus Excluded) and Barrett’s Esophagus, Study of Reflux
Disease, Western Washington State, 1997-2000 ... 186 Table 4.9. Sensitivity Analysis of Adjusted Odds Ratios and 95% Confidence
Intervals for the Association Between Anthocyanidin Intake (Bananas Included versus Excluded) and Barrett’s Esophagus Segment Length,
LIST OF FIGURES
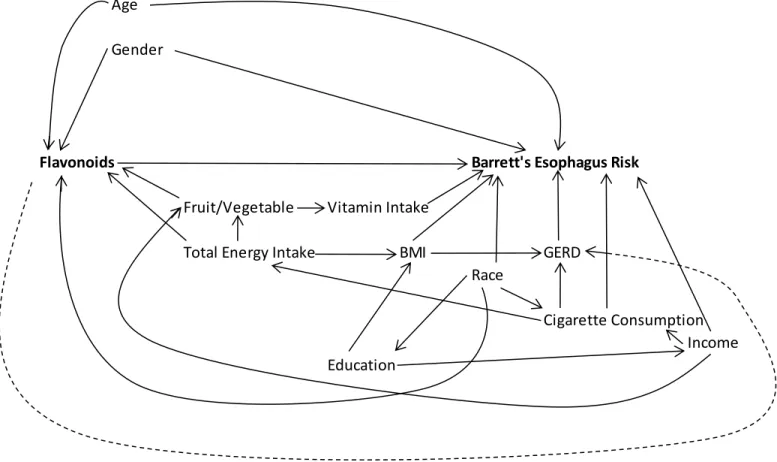
Page Figure 2.1. Directed Acyclic Graph of Potential Confounders of the Association
Between Dietary Flavonoid Intake and Esophageal/Gastric Cardia
Adenocarcinoma Development Risk ... 99 Figure 2.2. Directed Acyclic Graph of Potential Confounders of the Association
Between Dietary Flavonoid Intake and Esophageal Squamous Cell
Carcinoma and Non-cardia Gastric Adenocarcinoma Development Risk ... 100 Figure 2.3. Directed Acyclic Graph of Potential Confounders of the Association
Between Dietary Flavonoid Intake and Barrett’s Esophagus Development
Risk ... 101 Figure 2.4. Directed Acyclic Graph of Potential Confounders of the Association
Between Dietary Flavonoid Intake and Survival Among Cases of
Esophageal/Gastric Cardia Adenocarcinoma ... 102 Figure 2.5. Directed Acyclic Graph of Potential Confounders of the Association
Between Dietary Flavonoid Intake and Survival Among Cases of Esophageal Squamous Cell Carcinoma/Non-cardia Gastric
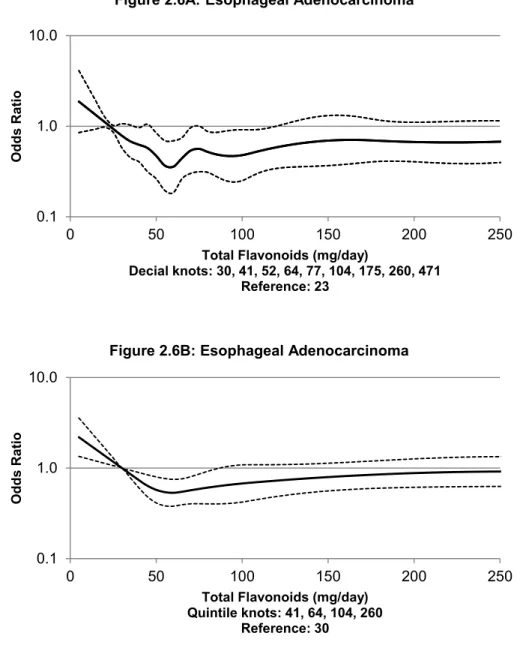
Adenocarcinoma ... 103 Figure 2.6. Restricted Quadratic Spline Graph of the Unadjusted Odds Ratios
and 95% Confidence Intervals of the Association Between Total
Flavonoid Intake and Esophageal and Gastric Cardia Adenocarcinoma, U.S. Multi-Center Study: Connecticut, New Jersey, and Western
Washington State, 1993-1995 ... 109 Figure 4.1. Restricted Quadratic Spline Graph of the Adjusted Odds Ratios
and 95% Confidence Intervals of the Association Between Anthocyanidin Intake and Barrett’s Esophagus, Study of Reflux Disease, Western
Washington State, 1997-2000 ... 183 Figure 5.1. Literature of Epidemiologic and Clinical Studies Supporting
Examination of the Association Between Flavonoid Intake and the
Esophageal and Gastric Cancer Continuum ... 191 Figure 5.2. Study Results for Dietary Flavonoid Intake (quartile 4 versus 1) and
LIST OF ABBREVIATIONS AADR Age-adjusted death rate
AAIR Age-adjusted incidence rate APC Annual percentage change ASIR Age-standardized incidence rate BaP Benzo[a]pyrene
BE Barrett’s esophagus
BEACON International Barrett’s and Esophageal Adenocarcinoma Consortium BMI Body mass index
CI Confidence interval COX-2 Cyclooxygenase-2
DMNM 2,6-dimethylnitrosomorpholine EA Esophageal adenocarcinoma
EGA Esophageal and gastric cardia adenocarcinoma study ESCC Esophageal squamous cell carcinoma
FFQ Food frequency questionnaire
FHCRC Fred Hutchison Cancer Research Center GA Gastric adenocarcinoma
GE Gastroesophageal
GERD Gastroesophageal reflux disease GCA Gastric cardia adenocarcinoma
HR Hazard ratio
IHC Immunohistochemical iNOS Nitric oxide synthase IRR Incidence rate ratio
MNAN N-methyl-N-amylnitrosamine
MNNG N-methyl-N'-nitro-N-nitrosoguanidine NCGA Non-cardia gastric adenocarcinoma NDSR Nutrition Data System for Research NSAID Non-steroidal anti-inflammatory drug
OR Odds ratio
PH Proportional hazards PTK Protein kinases RDD Random digit dialing SES Socioeconomic status
SIM Specialized intestinal metaplasia S-NaCl Saturated sodium chloride
SSBE Short-segment Barrett’s esophagus Tcf T-cell factor
UADC Upper aerodigestive tract cancers USDA United Stated Department of Agriculture VBE Visible Barrett’s esophagus
CHAPTER 1: BACKGROUND
Introduction
Esophageal and gastric cancers have very poor survival prognoses (normally less than a year).1 Thus, significant research efforts have focused on identifying strategies to reduce the risk of developing these cancers, which could also potentially decrease the risk of mortality among those diagnosed with these cancers. This approach is further enhanced if precancerous lesions are also considered, which facilitate determination of key
windows of susceptibility. In other words, this novel approach aids in identifying optimal times along the cancer continuum (normal tissue precancerous conditions invasive cancer mortality) that could be targeted for intervention with a specific
chemopreventive to enhance risk reduction. The only known potential precursor of esophageal and gastric cardia adenocarcinoma is Barrett’s esophagus (BE).2 Thus, the goals of this dissertation were to examine the role of a potential risk reduction strategy – namely dietary intake of flavonoids, which are potent anti-carcinogens found in fruits, vegetables, and other dietary sources – in reducing the risk of developing or dying from esophageal or gastric tumors along the cancer continuum.
and not the U.S.5,8,9 The rates of esophageal and gastric cancer subtypes (EA, GCA, ESCC, and NCGA) vary 50- to 60-fold between high and low incidence countries.8 These geographic differences in incidence do not appear to be only due to genetic variation between ethnic groups, as incidence rates of esophageal and gastric cancer in Asian migrants to the U.S. tend to move in the direction of European-American incidence rates.10-12 The geographic variation in incidence rates of esophageal and gastric cancer and results of migrant studies have led to the hypothesis that the variability is in part due to differences in energy intake/composition and micronutrient intake.5,13
The rationale for considering flavonoid intake as a potential chemopreventive is supported by evidence from population and laboratory research. Epidemiological studies have shown that diets high in fruit and vegetable consumption are inversely associated with esophageal and gastric cancer and Barrett’s esophagus.14-28 It is hypothesized that flavonoids, which are a group of bioactive polyphenolic compounds that are naturally occurring in fruits, vegetables, and beverages of plant origin, could partially account for these risk reductions. Experimental studies have supported this hypothesis and have shown that flavonoids regulate cell cycle, proliferation, and apoptosis, which have important chemotherapeutic effects against these tumors.29 Additionally, Phase I and II clinical trials are also using synthetic classes of flavonoids to produce cell cycle arrest and inhibit tumor growth in patients with metastatic cancer, including gastric cancer.30-32 In sum, the purpose of this study was to identify key windows of susceptibility for the potential association between flavonoids and esophageal and gastric tumors.
Specifically, aims were to: 1) examine if flavonoid intake was associated with
from esophageal or gastric tumors is innovative because there is potential to use flavonoids as a risk reduction strategy. This could allow some esophageal and gastric cancer to be prevented before individuals develop these deadly cancers or offer support for use of flavonoids as a novel chemotherapeutic.
A more thorough discussion of the scientific background, significance, and innovation that motivated the dissertation goals is presented below.
Epidemiology of Esophageal and Gastric Cancer Incidence
In 2008, esophageal cancer was the eighth most common cause of cancer morbidity worldwide, with an estimated 481,000 incident cases,33 and gastric cancer was the fourth most common cause of cancer morbidity worldwide, with an estimated 989,000 incident cases.34 Approximately 83% of esophageal cancers occur in developing
countries (399,000 incident cases), with over 50% of all esophageal cancers occurring in China alone (258,000 incident cases). Esophageal cancer also has huge geographic variation, varying more than 15-fold in men [age-standardized incidence rate (ASIR) 22.3 per 100,000 in Southern Africa versus 1.4 in Western Africa] and close to 20-fold in women (ASIR 11.7 per 100,000 in Southern Africa versus 0.6 in Micronesia/Polynesia).33 Almost 72% of gastric cancers occur in developing countries, with over 45% of all gastric cancers occurring in China alone (463,000 incident cases). Similar to esophageal
cancer, gastric cancer has huge geographic variation, varying more than 10-fold in men (ASIR 42.4 per 100,000 in Eastern Asia versus 3.9 in Northern Africa) and over 8-fold in women (ASIR 18.3 per 100,000 in Eastern Asia versus 2.2 in Southern Africa).34
gastroesophageal junction) or non-cardia (distal portion of the stomach).36 Esophageal squamous cell carcinomas generally occur in the upper two-thirds of the esophagus, whereas esophageal adenocarcinomas cluster in the lower third of the esophagus at the gastroesophageal junction.9 Esophageal squamous cell carcinoma and non-cardia gastric adenocarcinoma are the most common forms of esophageal and gastric cancer worldwide.8,37
Between 2003 and 2007 in the U.S., the average age of diagnosis for esophageal and gastric cancer was 68 and 70 years, respectively. During this
timeframe, the age-adjusted incidence rate (AAIR) for esophageal cancer was 4.5 per 100,000 (AAIR 7.8 per 100,000 men, 1.9 per 100,000 women). For gastric cancer, the AAIR was 7.8 per 100,000 (AAIR 10.9 per 100,000 men, 5.5 per 100,000 women). Between 1975 and 2007, the annual percentage change (APC) in gastric cancer incidence was -1.6%. The APC in esophageal cancer incidence was -0.4% in the U.S. between 2001 and 2007.38
Summary. Esophageal and gastric cancers are two of the most common causes of cancer morbidity worldwide.33,34 In the U.S. and other Western countries, esophageal and gastric cardia adenocarcinomas have been among the most rapidly increasing cancer types.5,8,9,39 However, esophageal squamous cell carcinoma and non-cardia gastric adenocarcinomas are the most common forms of esophageal and gastric cancer worldwide.8,37 Therefore, it is of importance to determine the risk factors for these four types of cancers because of high morbidity worldwide and increasing incidence of
EA/GCA in the U.S. Specifically, it is of interest to determine if flavonoids can be used as a risk reduction strategy for these cancer types.
Epidemiology of Esophageal and Gastric Cancer Survival
Worldwide in 2008, esophageal cancer was the sixth most common cause of cancer mortality, with an estimated 406,000 deaths,33 and gastric cancer was the second most common cause of cancer mortality, with an estimated 737,000 deaths.34 Approximately 83% of esophageal cancer mortality occurs in developing countries (338,000 deaths), with over 50% of all esophageal cancer mortality occurring in China alone (210,000 deaths). The highest mortality rates for esophageal cancer are found in Eastern Africa [age-standardized morality rate (ASMR) 14.3 per 100,000 in men, 6.2 per 100,000 in women], Southern Africa (ASMR 21.4 and 11.1, respectively), and Eastern Asia (ASMR 16.2 and 6.4, respectively).33 Over 75% of gastric cancer mortality occurs in developing countries (555,000 deaths), with over 45% of all gastric cancer mortality occurring in China alone (352,000 deaths). The highest mortality rates for gastric cancer are found in Eastern Asia (ASMR 28.1 per 100,000 in men, 13.0 per 100,000 in women), and the lowest mortality rates are found in Northern America (2.8 and 1.5, respectively).34
age-adjusted death rate (AADR) for esophageal cancer was 4.4 per 100,000 (AADR 7.8 per 100,000 men, 1.7 per 100,000 women). For gastric cancer, the AADR was 3.8 per 100,000 (AADR 5.3 per 100,000 men, 2.7 per 100,000 women).38 Between 1999 and 2006, the 5-year relative survival for all stages of esophageal cancer was 17.7%. The stage distribution of esophageal cancer was 23% for localized, 31% for regional, 32% for distant, and 15% for unknown stage cancer. The respective 5-year relative survival was 37.4%, 18.8%, 3.2%, and 12.1%. The 5-year survival for all stages of gastric cancer was 26.0%. The stage distribution for gastric cancer was 23% for localized, 32% for regional, 34% for distant, and 11% for unknown stage cancer. The respective 5-year relative survival was 62.5%, 27.0%, 3.4%, and 17.3%.38
Studies have shown little survival difference between esophageal and gastric cardia adenocarcinomas.40,44-48 In a study by Wijnhoven et al. of 252 patients,40 the overall 5-year survival rates for esophageal and gastric cardia adenocarcinoma, respectively, were 26% and 27%, with a combined, overall 5-year survival rate of 26%. Tumors were staged using TNM Classification of Malignant Tumors. For patients with esophageal cancer (n=111), tumor size was 16% Tis/T1, 14% T2, 70% T3-4, lymph node involvement was 44% N0 and 56% N1-2, and distant metastases were 81% M0 and 19% M1. For patients with gastric cardia adenocarcinoma (n=141), tumor size was 6% Tis/T1, 20% T2, 74% T3-4, lymph node involvement was 38% N0 and 62% N1-2, and distant metastases were 96% M0 and 4% M1. Overall 5-year survival rate by TNM classification for patients was 70% for Tis/T1, 37% for T2, and 14% for T3-4. The overall 5-year survival rate for patients with negative lymph nodes (N0) was 42%, but for patients with positive lymph nodes (N1) the survival rate was 11%. For patients without distant metastases (M0), the overall 5-year survival rate was 27%, whereas for patients with distant metastases (M1), the overall 5-year survival rate was 0%.40
of cancer mortality worldwide,33,34 and these cancers have very poor survival prognoses (normally less than a year).1 Therefore, demonstration of an association between flavonoids and BE development, esophageal or gastric cancer incidence or survival among esophageal and gastric cancer cases suggests potential to use flavonoids as a risk reduction strategy for these tumors. This would offer support for use of flavonoids as a novel chemotherapeutic, which could potentially decrease the risk of mortality among those diagnosed with these cancers.
Esophageal and Gastric Cardia Adenocarcinoma
Esophageal and Gastric Cardia Adenocarcinoma Risk Factors
Medical Conditions/Clinical Characteristics. The strongest risk factors for esophageal adenocarcinoma (EA) and gastric cardia adenocarcinoma (GCA) are gastroesophageal reflux disease (GERD), esophagitis, and Barrett’s esophagus (BE).49-52 While the dominant paradigm is that the major risk factor for EA/GCA is a precursor lesion, Barrett’s esophagus, that arises from GERD and esophagitis, studies have shown that GERD in the absence of BE appears to be a risk factor for EA/GCA as well.53,54 In the U.S. Multi-Center Study, risk of EA/GCA was associated with history of GERD [odds ratio (OR)=2.1, 95% confidence interval (CI): 1.3-3.5] and esophagitis or esophageal ulcer (OR=5.2, 95% CI: 1.7-15.7).54 In a study by Lagergren et al., among Swedish participants with symptomatic GERD at least once a week or more, compared to participants without symptoms, the odds ratios were 7.7 (95% CI: 5.3-11.4) for EA and 2.0 (95% CI: 1.4-2.9) for GCA. As frequency, severity, and duration of symptomatic GERD increased, the risk for EA/GCA
20 years of GERD symptoms, compared to participants without symptoms, the odds ratios were 16.4 (95% CI: 8.3-28.4) for EA and 3.3 (95% CI: 1.8-6.3) for GCA. Among individuals with long standing symptomatic GERD (>20 years) and severe symptoms, compared to participants without symptoms, the odds ratios were 43.5 (95% CI: 18.3-103.5) for EA and 4.4 (95% CI: 1.7-11.0) for GCA. Additionally, 118 of 189 EA patients (62%) had BE, and 113 EA patients (60%) had reflux symptoms at least once a week. The association with symptomatic GERD was almost identical between EA participants who had BE versus those that did not.53 Another study examined the GERD, esophagitis, and BE as risk factors for EA. The estimated standardized incidence ratios for EA were 3.1 (95% CI: 0.6-14.2) for GERD, 4.5 (95% CI: 1.04-19.6) for esophagitis, and 29.8 (95% CI: 9.6-106.0) for BE compared with a reference cohort.50
Family History. Due to the association of EA/GCA in male gender and Caucasian race, it has been hypothesized that there is an inherited component of EA/GCA.49 This has been supported in studies that have shown a family clustering of BE and EA/GCA.49,60-65 In a recent study, the odds of having BE or EA/GCA in
individuals with a positive family history (first or second degree relative with BE or EA/GCA) were 12.23 (95% CI: 3.34-44.76) times the odds of BE or EA/GCA in individuals without a positive family history.65 However, the family clustering seen in BE and EA/GCA could also be due in part to shared cultural factors, especially diet.66
Education and Income. In the U.S. Multi-Center Study, low socioeconomic status (SES), quantified by both education and income, was a risk factor for EA/GCA. For participants that completed graduate school versus those with less than high school education, the OR was 0.7 (95% CI: 0.3-1.3) for EA and 0.8 (95% CI: 0.4-1.6) for GCA. For participants with an income greater than $75,000 compared to those with an income of less than $15,000 per year, the OR was 0.5 (95% CI: 0.3-1.0) for EA and 0.8 (95% CI: 0.4-1.6) for GCA.67 In a more recent Swedish study comparing unskilled manual workers to professionals, the OR was 2.0 (95% CI: 0.9-4.5) for EA and 1.0 (0.6-1.8) for GCA.68
Epidemiologic Factors. Obesity. Modifiable risk factors for EA/GCA include
obesity49,51,69-74 and cigarette smoking.49,51,67,72,75-81 Increasing rates of obesity in the general population have paralleled the increasing rates of EA and GCA. Elevated body mass index (BMI, defined as weight in kilograms/height in meters squared) has
consistently been shown to be a significant risk factor for EA and a somewhat weaker risk factor for GCA. While the exact mechanisms are unclear, it is hypothesized that central adiposity may increase intra-abdominal pressure, thus promoting
Abnet et al., compared to participants with a BMI of 18.5-25 kg/m2, participants with a BMI of 25-<30, 30-<35, and ≥35 kg/m2 had respective hazard ratios for EA of 1.65 (95% CI: 1.26-2.18), 1.91 (95% CI: 1.38-2.66), and 2.27 (95% CI: 1.44-3.59) and for GCA of 1.06 (95% CI: 0.79-1.41), 1.70 (95% CI: 1.22-2.36), and 2.46 (95% CI: 1.60-3.80).69 In the study by Merry et al., compared with participants with a BMI of 20.0-24.9 kg/m2, participants with a BMI of 25.0-29.9 and ≥30.0 kg/m2 had respective rate ratios for EA of 1.40 (95% CI: 0.95-2.04) and 3.96 (95% CI: 2.27-6.88) and for GCA of 1.32 (95% CI: 0.94-1.85) and 2.73 (95% CI: 1.56-4.79).70 In a meta-analysis of the association between BMI and EA/GCA, the OR for EA comparing overweight (BMI 25-28 kg/m2) and obese (BMI ≥ 28) to normal weight (18.5-25 kg/m2) individuals was 2.2 (95% CI: 1.8-2.7; phomogeneity=0.11) for men and 1.9 (95% CI: 1.5-2.5; phomogeneity=0.20) for women. The OR for GCA comparing overweight and obese to normal weight was 1.5 (95% CI: 1.3-1.8; phomogeneity=0.38) for studies conducted in the U.S. and European countries.82
some evidence that alcohol may increase the risk of GCA.10
Asprin. Risk reduction factors for EA/GCA include non-steroidal
anti-inflammatory drugs (NSAIDs), such as aspirin, and other COX-2 inhibitors,49,51,74,83-87 fruits and vegetables,14-25 and dietary antioxidants, including vitamin C88-91 and vitamin E.88,89,91 In a recent meta-analysis, aspirin was inversely associated with EA (OR=0.64, 95% CI: 0.52-0.79) and GCA (OR=0.82, 95% CI: 0.65-1.04). Other NSAIDs were also inversely associated with EA (OR=0.65, 95% CI: 0.50-0.85) and GCA (OR=0.80, 95% CI: 0.67-0.95).86 In a prospective cohort study of BE patients, the hazard ratio for EA in current NSAID users was 0.32 (95% CI: 0.14-0.76).85
Dietary Intake. Epidemiological studies have shown that diets high in fruit and vegetable consumption are inversely associated with EA14-23 and GCA.14,15,23-25 In the U.S. Multi-Center Study, the adjusted odds ratios (OR) were calculated based on increasing fruit/vegetable intake by one serving per day. Total fruit and vegetable intake were associated with decreased risk of EA (OR=0.88, 95% CI: 0.82-0.95) and potentially decreased risk of GCA (OR=0.97, 95% CI: 0.90-1.03).15 Additionally, studies have shown that dietary antioxidants, including vitamin C88-91 and vitamin E,88,89,91 have risk reduction effects against EA/GCA. In the U.S. Multi-Center Study, Mayne et al. found an inverse association between vitamin C and E, comparing the highest versus lowest quartile of consumption, for EA (OR=0.45, 95% CI: 0.33-0.61 and OR=0.73, 95% CI: 0.54-1.00, respectively) and GCA (OR=0.64, 95% CI: 0.49-0.84 and OR=0.75, 95% CI: 0.55-1.02, respectively).91
Summary. Risk factors of EA/GCA include GERD,49-52 esophagitis,49-52 Barrett’s esophagus,49-52 age,49,51,55,56 obesity,49,51,69-74 gender, race,49,51,55-59 cigarette smoking,49,51,67,72,75-81 family history,49,60-65 and low SES.67 Risk reduction factors include non-steroidal anti-inflammatory drugs (NSAIDs) and other COX-2
vitamin C88-91 and vitamin E.88,89,91 These risk factors were important to consider when designing the directed acyclic graph of the association between flavonoids and EA/GCA risk, as these are potential confounders or intermediates of this association.
Flavonoids and Esophageal/Gastric Cardia Adenocarcinoma: Biologic Mechanisms
Flavonoids are a group of bioactive polyphenolic compounds that are naturally occurring in fruits, vegetables, and beverages of plant origin and are thought to partially account for the risk reduction of fruits and vegetables on EA and GCA.29 Experimental studies have shown that some classes of flavonoids regulate cell cycle, proliferation, and apoptosis, and modulate carcinogen metabolism and inflammatory pathways, which have important chemopreventive effects against EA and GCA.29 Lignans are another polyphenolic compound that has been shown to have antioxidant and anti-inflammatory effects, induce apoptosis, and promote cell cycle arrest.92 There are six classes of flavonoids (anthocyanidins, flavan-3-ols, flavanones, flavones, flavonols, and
isoflavones), and different foods and beverages contribute to each class of flavonoid. A recently published review93 has outlined the different foods and beverages that contribute to the flavonoid classes and the mechanism of chemoprevention for each class and is briefly described below.
Anthocyanidins (e.g., cyanidin, delphinidin, malvidin, pelargonidin, peonidin, and petunidin) are found in berries, grain, grape seed extracts, wine, red cabbages, and purple sweet potatoes. The chemopreventive mechanisms for anthocyanidins are through antioxidant effects, induction of apoptosis, anti-inflammatory effects, and cell cycle arrest.93
(+)-gallocatechin, (+)-gallocatechin-3-gallate, theaflavin, theaflavin-3-gallate, theaflavin-3’-gallate, theaflavin-3,3’-digallate, and thearubigins) are found in apple skin, celery, berries, citrus fruits, soybeans, onions, green tea, and cocoa. The chemopreventive mechanisms for flavan-3-ols are through antioxidant effects, anti-inflammatory effects, and inhibition of telomerase.93
Flavanones (e.g., eriodictyol, hesperitin, and naringenin) are found in oranges and grapefruit. The chemopreventive mechanisms for flavanones are through induction of apoptosis and antiproliferative effects.94
Flavones (e.g., apigenin and luteonin) are found in legumes, broccoli, parsley, thyme, olives, cherries, and tea. The chemopreventive mechanisms for flavones are through induction of apoptosis, anti-inflammatory effects, suppression of mitogen-activated protein kinase, cell cycle arrest, and suppression of NF-κB activation.93
Flavonols (e.g., isorhamnetin, kaempferol, myricetin, and quercetin) are found in olive oil, red wine, tea, citrus fruits, tomato, onion, cotton seed, and yellow vegetables. The chemopreventive mechanisms for flavonols are through
antioxidant effects, anti-inflammatory effects, induction of apoptosis, suppression of NF-κB activation, suppression of protein kinases (PTKs), suppression of angiogenesis, cell cycle arrest, and inhibitor of telomerase.93
Isoflavones (e.g., daidzein, genistein, and glycitein) are found in soybean and citrus fruits. The chemopreventive mechanisms for isoflavones are through induction of apoptosis, anti-inflammatory effects, suppression of PTKs, cell cycle arrest, and suppression of angiogenesis.93
antioxidant effects, induction of apoptosis, cell cycle arrest, and anti-inflammatory effects.93
Only three flavonoid classes (flavan-3-ols, flavones, and flavonols) have been studied and also directly linked to adenocarcinomas of the esophagus and gastric cardia in laboratory experiments, as discussed below.
Flavan-3-ols. The effects of flavan-3-ols on two cell lines – one a poorly differentiated esophageal adenocarcinoma and one a moderately differentiated gastric cardia/gastroesophageal junction adenocarcinoma – were investigated, and exposure of these cell lines to flavan-3-ols reduced the number of cancer cells. This was attributed to increased apoptosis and arrest of the cell cycle at G0/G1 phase, and reduction of cells in cell cycle S phase.29 A more recent study95 looked at human EA cells and showed that Polyphenon E, a green tea extract of Epigallocatechin gallate (which is found to a lesser extent in black tea),96 inhibited growth, produced cell cycle arrest (G1 phase), and down-regulated the expression of cyclin D1 protein in EA cells.95
Another study found that cranberry proanthocyanidins inducted apoptosis and cell cycle arrest (G1 phase) and inhibited acid-induced proliferation of human EA cells.97 Using a grape seed proanthocyanidin extract (GSPE) against human gastric adenocarcinoma cells in vitro, researchers found that GA cancer cells treated with 50 mg/liter GSPE had 41% inhibition of cellular growth compared with GA cancer cells treated with 25 mg/liter GSPE that had a 34% inhibition of cellular growth.98
One animal study has shown that a synthetic flavone, Flavopiridol, reduces the development of EA. In this study, mice were exposed to a carcinogen that is known to induce esophageal cancer. Experimental mice (n=71) were given Flavopiridol and control mice (n=50) received diluent. Prevalence of EA in experimental mice was 11% compared to 32% in control mice (p=0.001).100
Flavonols. In a study mentioned above, researchers also found that flavonols (i.e., quercetin, kaempferol, and myricetin) induced cytotoxicity in human esophageal adenocarcinoma cells, which was mediated by G2/M cell cycle arrest and apoptosis. Of the flavonols, quercetin had the most cytotoxic potency.99
Summary. Experimental studies have shown that some classes of flavonoids have important chemopreventive effects against EA and GCA.29 This gives biological plausibility to the hypothesis of an inverse association between flavonoid
consumption and EA/GCA incidence and survival among EA/GCA cases.
Demonstration of an association between flavonoids and incidence of EA/GCA or survival among EA/GCA cases suggests potential to use flavonoids as a risk reduction strategy for these cancers.
Epidemiology of Flavonoids and Esophageal/Gastric Cardia Adenocarcinoma
Four previous epidemiological studies101-104 have analyzed the association between esophageal adenocarcinoma (EA) or gastric adenocarcinoma (GA) and total
flavonoid consumption. These studies found no association with total flavonoid consumption, but two studies101,102 did find positive associations with specific classes of flavonoids. In a U.S.-based study of EA, the odds ratio for EA comparing
individuals in the highest quartile of consumption of one class of flavonoid
can result in unstable effect estimates.101 In a Greece-based GA study, the odds ratio (OR) per one standard deviation increase in intake of one class of flavonoid (flavanones) was 0.55 (95% CI: 0.31-0.96). However, the study examined all adenocarcinoma of the stomach and did not consider anatomical subsites (i.e., cardia versus non-cardia), and it was also limited by small sample size (100 cases of GA).102
The European Prospective Investigation into Cancer and Nutrition examined the association between flavonoid intake and esophageal and gastric cancer, stratifying by histology (i.e., adenocarcinoma versus squamous cell carcinoma for esophageal cancer) and anatomic subsite (i.e., cardia versus non-cardia for gastric cancer).103,104 No associations were found in the main analyses. There was
suggestion of total flavonoids being associated with decreased risk of gastric cancer in women and esophageal cancer in current smokers. When results were stratified by histology or anatomic subsite, risk reductions were not detected for esophageal or gastric cardia adenocarcinoma possibly due to small sample size (EA n=142, GCA n=201).103,104
One other study, which was conducted in Sweden, examined the association between a specific flavonoid, quercetin of the flavonol class, and gastric
adenocarcinoma risk, both by cardia and cardia type. The study showed a non-significant decrease for the association between quercetin and gastric cardia adenocarcinoma (GCA) (highest versus lowest quintile OR=0.76, 95% CI: 0.40-1.44). This study included 81 cases of GCA.105
Two Swedish studies, by the same authors, have examined the association between dietary lignan intake and esophageal or GE junction adenocarcinoma.106,107 In the case-control study, which included 181 EA cases and 255 GE junction
junction adenocarcinoma (OR=0.37, 95 % CI: 0.23-0.58) was found for the highest quartile of lignan intake compared to the lowest.107 However, in a cohort study there was no association found between lignan intake and EA or GE junction
adenocarcinoma. This study was limited by small sample size of 83 cases of EA or GE junction adenocarcinoma.106
Summary. The association between flavonoids and EA/GCA risk has been studied previously.101-105 However, the sample sizes have been small; this can result in unstable effect estimates. No previous studies have been conducted examining survival among EA/GCA cases in relation to flavonoid intake.
Role of Cell Cycle-Related Genes: Cyclin D1 and p53
There is evidence that cyclin D1 (which regulates cellular proliferation, differentiation, and carcinogenesis)108 and p53 (which regulates cell cycle control, DNA repair, and apoptosis)109,110 mutations may reflect exposure to etiologic factors.84,108,111,112 Cyclin D1 regulates cell cycle in the mid to late G1 phase by phosphorylating retinoblastoma protein, which releases E2F and transitions to S-phase.113 Cyclin D1 has been implicated in EA and may be involved in the development of BE by predisposing the epithelium to malignant transformation.114 In the U.S. Multi-Center Study, 80 of 159 (50.3%) esophageal adenocarcinomas (EA) and 55 of 149 (36.9%) gastric cardia adenocarcinomas (GCA) were positive for cyclin D1.108
An in vivo experiment has suggested that overexpression of cyclin D1 may be an early event in the tumorgenesis process for esophageal cancer in rats induced by the carcinogen 2,6-dimethylnitrosomorpholine (DMNM), by causing an increase in proliferation of esophageal stem cells. In this study, increased p53 expression began at the dysplastic stage of carcinogenesis.115 It was hypothesized that cyclin D1 is an initiating event during Barrett’s metaplasia, and abnormal p53 is required during dysplasia to promote the development of EA.113,115
Summary. Cyclin D1 and p53 are involved in tumor differentiation, proliferation and apoptosis,84,108,109,111,112 and mutations may reflect exposure to etiologic factors.84,108,111,112 We will examine if the association between flavonoids and EA/GCA varies by p53 or cyclin D1 overexpression. Categorizing cases by these markers was conducted to examine potentially etiologically distinct subgroups.
Flavonoid use During Cancer Progression and Chemotherapy
Carcinogenesis is characterized by multistage genetic and cellular changes, and this sequence of events has many points for intervention, with the purpose of preventing, slowing down, or reversing the process.116 Therefore, targets for chemoprevention could be multiple and could vary by stage – from initiation to promotion to progression.117 In a normal cell, targets for chemoprevention include scavenging reactive oxygen species and altering carcinogen metabolism. In an initiated cell, targets for chemoprevention include preventing further DNA damage and inducing apoptosis. In a preneoplasic cell, targets for chemoprevention include preventing further DNA damage, inducing cell-cycle arrest, inducing apoptosis, and inhibiting angiogenesis. In a tumor cell, targets for
chemoprevention include preventing further DNA damage, inhibiting angiogenesis, and inhibiting invasion.116,117
influence the carcinogenic process during initiation, progression, and promotion.116 However, some concerns have been raised about using antioxidants, such as flavonoids, for chemoprevention or chemotherapy. Some scientists have expressed concerns that antioxidants may not differentiate between healthy cells and tumor cells and may protect tumors from cytotoxic cancer treatments.118-120 In a breast cancer study where participants were given mega-doses of antioxidants, including beta-carotene, vitamin C, niacin, selenium, coenzyme Q10, and zinc, risk of breast cancer-specific mortality and breast cancer recurrence was increased for the group given the antioxidant vitamins and minerals compared to a group given standard therapy [hazard ratio
(HR)=1.75, 95% CI: 0.83-2.69; 1.55, 95% CI: 0.94-2.54, respectively].121
In addition to mortality, there are potential adverse effects from antioxidants in high-risk patients. In both the alpha-tocopherol, beta-carotene trial (ATBC) and
β-carotene and retinol efficacy trial (CARET), participants were at high-risk for lung cancer (i.e., participants in both trials were current or former heavy smokers and participants in CARET were also exposed to asbestos). Vitamins A and E were given to participants as a chemopreventive, but the chemoprevention had unintended consequences.
Participants in both ATBC and CARET that were given vitamins A or E had higher risk of incident of lung cancer (HR=1.18, 95% CI: 1.03-1.36; HR=1.28, 95% CI: 1.04-1.57, respectively) and higher risk of mortality (HR=1.08, 95% CI: 1.01-1.16; HR=1.17, 95% CI: 1.03-1.33, respectively).122 While it is of interest to determine if there is potential to use flavonoids as a risk reduction or chemotherapy of these tumors, flavonoids will need to be carefully evaluated in the future for these therapy options.
esophageal and gastric cancer to be prevented before individuals develop these deadly cancers or offer support for use of flavonoids as novel chemotherapy drugs. While this study allowed investigation of these aims by utilizing data on dietary intake of flavonoids, care needs to be taken when thinking of utilizing flavonoids as a risk reduction or chemotherapy of these tumors in the future. There is potential, as evidenced by previous research with other antioxidants, that the use of flavonoids as a chemopreventive or chemotherapy could have unintended consequences.
Esophageal and Gastric Cardia Adenocarcinoma Prognostic Factors
As discussed above, EA and GCA are extremely lethal cancers, and there are very few factors that contribute to a better prognosis and survival benefit. However, several factors that have been explored include age, sex, BE, GERD, tumor location, stage, grade, dysphagia at presentation, weight loss, obesity, education, income, cigarette consumption, alcohol use, non-steroidal anti-inflammatory drugs (NSAIDs), type of surgical operation, and surgical complications.1,123
Demographic Factors. Non-modifiable factors of age, sex, and education
have not been shown to have a prognostic impact on EA and GCA.1 In the U.S. Multi-Center Study,1 income was an important prognostic factor. The adjusted hazard ratio (HR) comparing individuals with ≥$15,000 income to those with
<$15,000 income was 0.64 (95% CI: 0.48-0.87) for EA and 0.62 (95% CI: 0.43-0.88) for GCA. It was suggested that decreased survival among low income cases may indicate lack of access to medical care or death from other comorbidities.1
Epidemiologic Factors. Modifiable factors of cigarette consumption, alcohol use, and NSAIDs use also did not have a prognostic impact on EA and GCA.1
better overall survival compared to normal weight and obese individuals. This relationship between weight and survival was more defined for EA patients. Compared to normal weight participants (BMI <25 kg/m2), the adjusted HR for EA was 0.67 (95% CI: 0.51-0.88) for overweight participants (BMI 25-29.9 kg/m2) and 0.78 (95%CI: 0.55-1.12) for obese participants (BMI 30+ kg/m2). Compared to
normal weight participants, the unadjusted HR for GCA was 0.90 (95% CI: 0.67-1.20) for overweight participants and 0.98 (95% CI: 0.67-1.43) for obese participants.1 Pre-treatment weight loss is thought to indicate advanced disease. Patients, including both EA and esophageal squamous cell carcinoma, with pre-treatment weight loss of >10% body weight had a worse prognosis than those without weight loss (HR=0.63, 95% CI: 0.26-1.00).124
Medical Conditions/Clinical Characteristics. The presence of precursor lesions or dysphagia at diagnosis, as well as characteristics of the first primary such as tumor location, stage, and grade, have prognostic importance for patients with adenocarcinomas of the GE junction. Patients presenting with dysphagia have worse prognosis, likely reflecting an advanced disease.123 In a study of esophageal
Gastroesophageal reflux disease (GERD) has also been found to be associated with survival among patients diagnosed with GE junction cancers. Unadjusted HR comparing those with GERD to those without were 0.80 (95% CI: 0.63-1.03) for EA and 0.74 (95% CI: 0.56-0.98) for GCA.1
Tumors located in the esophagus have better prognoses than tumors in the gastric cardia. This is thought to be because tumors might be detected in the
esophagus due to screening or possibly because adenocarcinoma in the esophagus presents with dysphagia earlier than adenocarcinoma arising in the gastric cardia.123
As expected, stage is an important prognostic factor. Compared with distant stage, the adjusted HRs for regionalized, localized, and unknown stage, respectively, are 0.32 (95% CI: 0.23-0.45), 0.22 (95% CI: 0.15-0.31), and 0.42 (95% CI: 0.30-0.60) for EA and 0.48 (95% CI: 0.35-0.65), 0.18 (95% CI: 0.11-0.31), and 0.54 (95% CI: 0.35-0.83) for GCA.1
Grade of the tumor did not appear to be as important. Compared to
poor/undifferentiated tumors, the unadjusted HR for well/moderately differentiated tumors was 0.85 (95% CI: 0.65-1.11) for EA and 0.83 (95% CI: 0.62-1.10) for GCA.1
Precursor Lesion of Esophageal/Gastric Cardia Adenocarcinoma: Barrett’s Esophagus
The only known potential precursor of esophageal adenocarcinoma (EA) and gastric cardia adenocarcinoma (GCA) is Barrett’s esophagus (BE).2 EA appears to develop from normal mucosal lining through a sequence of pathologic events.42 Animal studies have shown that the squamous mucosa must be destroyed to allow for reepithelialization of the esophagus.127 The normal squamous mucosa is believed to be destroyed by chronic gastroesophageal reflux disease (GERD), which is an extremely common condition that affects 10-20% of individuals in Western countries. GERD is a digestive disease that is characterized by reflux of gastric contents, including gastric acid and potentially bile, into the esophagus.128 This reflux can cause ulceration of the esophagus, known as
esophagitis,129 followed by development of Barrett epithelium, commonly referred to as BE.130 The important metaplastic change from GERD to BE is intestinal metaplasia, which can progress from low-grade to high-grade dysplasia. It is not known if BE is a necessary precursor of EA,42 but high-grade BE dysplasia will be detected with simultaneous EA approximately 25% of the time.128
It has been postulated that gastric cardia adenocarcinoma (GCA) arises from a similar process where there is intestinal metaplasia of the gastric cardia;44,131-133
however, this is still controversial.128 In a study focused on early-stage cancers in an attempt to avoid concealment of underlying intestinal metaplasia, intestinal metaplasia was detected in 96% (25 of 26 patients) of esophageal adenocarcinomas and 69% (11 of 16 patients) of gastric cardia adenocarcinomas.131
intervene and prevent disease progression. Further, studying the etiology of cancer closer to the time of exposure can allow for more accurate effect measure estimates. When outcomes are assessed further from the exposure, it is more difficult to measure associations because effect measure estimates tend to be diluted over time. In other words, lengthy follow-up, as is often the case with latency periods for cancers, can lead to attenuated estimates. Therefore, studying the time period closer to disease onset, such as with precursor lesions, mitigates recall error and loss to follow-up.134 However, by studying the precursor lesion of BE versus EA/GCA, a different stage in the cancer process from initiation to promotion to progression could be examined. Risk factors for BE could be involved in initiation or promotion, while risk factors for EA/GCA could also be involved in progression of cancer. This could affect the interpretation of results if an association is seen between flavonoids and BE but not EA/GCA, or vice versa, as flavonoids may have an effect at different stages of the cancer process.135
Summary. EA appears to develop from normal mucosal lining through a
sequence of pathologic events.42 Normal squamous mucosa is thought to be destroyed by chronic GERD, which can cause esophageal ulceration followed by BE
development.130 It is postulated that GCA arises from similar processes,131 but this is controversial.128 By studying the precursor lesion of BE, the association between flavonoids and the EA/GCA cancer continuum can be examined. Studying BE will also help mitigate recall error and loss to follow-up by studying the time period closer to disease onset.134
Epidemiology of Barrett’s Esophagus Prevalence
diagnosed. The average age of diagnosis is 63 years, but the estimated median age of onset is 40 years.51 However, it is estimated that there are approximately 86,000 new cases of BE diagnosed each year.136
Between 1977 and 1996, newly diagnosed cases of BE increased 800-3000%.137-139 This drastic increase was attributed to a real increase in incidence,
increased knowledge of the condition by endoscopists, or both.137-139 Since 1996, newly diagnosed cases of BE has increased 150-200%.140,141 This increase is independent of the number of gastrointestinal endoscopies that arebeing performed.107,108 However, older studies show that BE was found when endoscopists looked for it. In a Swiss study of 4,950 endoscopies conducted between 1963 and 1971, 62 patients (1.25%) had BE.142 This is similar to the percentage of new cases of BE diagnosed during routine clinical endoscopies (1.5%), suggesting that the incidence of BE has not increased over the past 40 years.143
5.5-5.7).156 Using this prevalence estimate with the 2000 U.S. Census estimates,157 it is estimated that 11.7 million adults over 18 years of age in the U.S. have prevalent BE.
Summary. BE is the only known precursor of EA/GCA,2 whose incidence in the U.S. and other Western countries is increasing rapidly.5,8,9,39 Therefore, it is of
importance to determine the risk factors for BE because of the increasing incidence of EA/GCA in the U.S. Specifically, it is of interest to determine if flavonoids can be used as a risk reduction strategy for BE.
Barrett’s Esophagus Risk Factors
Medical Conditions/Clinical Characteristics. GERD. The main risk factor of BE is GERD symptoms.51,158-160 Liberman et al. studied the risk of BE with a history of reflux symptoms. Individuals with a longer history of reflux symptoms, compared to individuals without a history of reflux symptoms, had increased odds of having BE: odds ratio (OR) of 3.0 (95% CI, 1.2–8.0) for a 1- to 5-year history, OR of 5.1 (95% CI, 1.7–14.7) for 5- to 10-year history, and OR of 6.4 (95% CI, 2.4–17.1) for more than 10 years.160
Hiatal Hernia. BE occurs more frequently among individuals with a hiatal hernia, which is a condition where the stomach protrudes through an opening in the diaphragm into the chest cavity.161,162 A recent study of 48 BE patients and 103 controls found 2 cm or longer hiatal hernia in 96% of BE patients and 42% of controls, and the authors concluded that hiatal hernia likely contributes to the development of BE.162
Demographic Factors. Non-modifiable risk factors for BE include age,51,146,163 race,51,164,165 gender,51,146 and low socioeconomic status.166 Age of more than 40 years is an independent predictor of BE,163 and the prevalence of BE increases with age until it plateaus in 60-69 year olds.146 As with EA and GCA, BE is more common in Caucasians and males. In patients undergoing endoscopy in the Clinical Outcomes Research
Hispanics, 1.3% of Asian-Americans, and 1.1% of African-Americans.155 The
male:female sex ratio for BE ranges from 1.7:1 to 4:1.51 In a study by Kubo et al., they showed that individuals with at least a college education compared to individuals with high school or less education had a decreased risk of BE (OR=0.47, 95% CI: 0.27-0.82) and individuals with an income of >$75,000 compared to individuals with an income of <$50,000 were at a decreased risk of BE (OR=0.68, 95% CI: 0.42-1.11).166
Epidemiologic Factors. Obesity. Obesity is another risk factor for BE that has received attention.51,167,168 In the Study of Reflux Disease, Edelstein et al. showed that overweight and obese individuals, compared to normal weight, were at an increased risk of BE (adjusted OR=1.6, 95% CI: 0.9-2.8 and 2.6, 95% CI: 1.5-4.4, respectively) and individuals with a high, compared to low, waist-to-hip ratio (WHR) were also at an increased risk of BE (adjusted OR=2.4, 95% CI: 1.4-3.9). When BMI and waist-to-hip ratio were adjusted for each other, the estimate for BMI was more attenuated than the estimate for WHR.169 This suggests that central obesity could be more important to the development of BE, potentially through hiatal hernia, intragastric pressure promoting reflux, or high levels of insulin.170
Cigarette Smoking. Although cigarette smoking is a risk factor for esophageal adenocarcinoma, the association between cigarette smoking and BE is not clear, but there is a suggested trend of increasing risk with increasing pack-years of smoking and increased risk of BE for current smokers, compared to never smokers (adjusted
OR=1.27, 95% CI: 0.74-2.17).171
Aspirin. Risk reduction factors against these tumors include non-steroidal anti-inflammatory drugs (NSAIDs) and other COX-2 inhibitors,172 fruits and
CI: 0.19-0.81 and 0.53, 95% CI: 0.31-0.90, respectively).172
Dietary Intake. In the Study of Reflux Disease, researchers showed that individuals in the second and third tertile of fruit and vegetable intake had a lower risk of BE than individuals in the lowest tertile of intake (adjusted OR=0.40, 95% CI: 0.23-0.71 and 0.33, 95% CI: 0.17-0.63, respectively).26 In a case-control study conducted at Kaiser Permanente Northern California, individuals with high intakes of vitamin C or E were found to have a decreased risk of BE (4th versus 1st quartile, adjusted OR=0.48, 95% CI: 0.26-0.90 and 0.25, 95% CI: 0.11-0.59, respectively).27
Summary. Risk factors for BE include GERD,51,158-160 hiatal hernia,161,162 age,51,146,163 race,51,164,165 gender,51,146 low socioeconomic status,166 obesity,51,167,168 and potentially cigarette smoking.171 Risk reduction factors against these tumors include non-steroidal anti-inflammatory drugs (NSAIDs) and other COX-2
inhibitors,172 fruits and vegetables,21,26,27 and dietary antioxidants, including vitamin C and vitamin E.173 These risk factors were important to consider when designing the directed acyclic graph of the association between flavonoids and BE risk, as these are potential confounders or intermediates of this association.
Flavonoids and Barrett’s Esophagus: Biologic Mechanisms
Few studies have looked at the biological mechanisms of how flavonoids affect Barrett’s esophagus. In an in vitro study, mentioned above, researchers looked at BE cells and found that Polyphenon E, a flavan-3-ol derived from green tea, inhibited growth and down-regulated the expression of cyclin D1 protein in BE cells.95 One animal study, also mentioned above, has shown that a synthetic flavone,
Flavopiridol, reduces the development of BE. In this study, mice were exposed to a carcinogen that is known to induce esophageal cancer. Prevalence of BE in
Summary. Experimental studies have shown that some classes of flavonoids have important chemopreventive effects against BE.95,100 This gives biological
plausibility to the hypothesis of an inverse association between flavonoid intake and BE risk. Demonstration of an association between flavonoids and BE development suggests potential to use flavonoids as a risk reduction strategy.
Epidemiology of Flavonoids and Barrett’s Esophagus
One epidemiological investigation to date has examined the association between dietary flavonoid intake and risk of Barrett’s esophagus.174 This case-control study of 151 Barrett’s esophagus cases from the Veterans Affairs Medical Center in Houston, Texas, considered one flavonoid class, isoflavones, and found an inverse association (highest versus lowest tertile OR=0.45, 95% CI: 0.25-0.81).174
Summary. One previous study174 has reported on the association between isoflavone intake and BE. However, intake of isoflavone-containing foods in the United States is limited. The other five flavonoid classes are found in foods more commonly consumed by Americans,175 yet their associations with BE have not been considered.
Barrett’s Esophagus: Natural History
Although BE patients have a 125-fold greater risk of EA/GCA, the probability that BE will develop into adenocarcinoma is still rare – incidence of cancer is 1 out of 227 BE patient-years of follow-up.176 Therefore, it is of interest to determine which BE
patients will progress to EA/GCA. A recent review examined this question and discussed the use of chromosome abnormalities as markers of BE that will