REVIEW
Relationship between prenatal growth, postnatal growth and
childhood obesity: a review
EK Matthews1, J Wei2and SA Cunningham3
Evidence is accumulating that obesity risks become established early in life. The goal of this systematic review is to assess whether there is evidence that rapid postnatal growth holds different implications for childhood obesity risks for children who experienced different patterns of prenatal growth. We conducted systematic database searches in PubMed and Embase in October 2014 for studies assessing the implications of prenatal and postnatal growth for childhood obesity. The 18 studies meeting inclusion criteria indicated that risks of obesity increased with birthweight; risks of obesity also increased with rapid postnatal growth for children across the birthweight distribution. Fifteen studies indicated that rapid postnatal growth is linearly associated with obesity for children and adolescents of all sizes at birth, with no interaction effect. Three studies reported interaction effects with postnatal growth, conferring additional increased risk of obesity among children and adolescents who were small at birth. Both prenatal and postnatal growth are important risk factors for obesity, and their combined effects should be analyzed further to understand how obesity risks develop early in life.
European Journal of Clinical Nutrition(2017)71,919–930; doi:10.1038/ejcn.2016.258; published online 1 March 2017
INTRODUCTION
Obesity is a public health concern worldwide, with the global prevalence of childhood overweight and obesity estimated at 6.7% in 2010.1 There is mounting evidence that the path to obesity is established early in life, perhaps as early as prenatally and in infancy.2–5What the early life factors are and how they may work together to shape a child’s long-term weight trajectory are important areas of ongoing research.
Studies have indicated that prenatal growth patterns may influence body fat distribution and the development of obesity later in life.4,6–8It has been hypothesized that the relation between birthweight and obesity may follow a U or J-shaped curve, with higher risk at both extremes of the birthweight distribution.7,9 Empirical evidence has shown that obesity risks typically increase linearly with weight at birth: high birthweight infants are at higher risk of long-term overweight;8evidence of higher risk of obesity at the low end of the birthweight distribution has been less frequently observed.8,10–12 High birthweight may be associated with later obesity due to larger size stemming from high levels of lean mass,13,14 while low birthweight may be associated with higher central adiposity.15–18 Studies have also indicated that postnatal growthduring thefirst 1–2 years of life may be positively associated with subsequent obesity in childhood, adolescence and adulthood, as obesity risks, both in terms of body mass index (BMI) and adverse body composition, are higher for those who experienced rapid postnatal weight gain.19–23
An important consideration in understanding the early life emergence of obesity risks is the relationship between prenatal and postnatal growth and whether some combinations of growth increase risks. Prenatal growth has been shown to be inversely associated with postnatal growth, with babies born smaller experiencing higher growth during infancy compared with larger babies.21,24,25It has been suggested that babies who experience
growth restriction in utero and therefore are born small compensate by growing rapidly in early infancy, and that this mismatch between prenatal and postnatal growth may elevate risks of obesity and other chronic diseases.26–28If this is the case, there could be trade-offs between the short-term benefits of 'catch-up' growth and chronic disease risk in the longer-term.
Because most studies that have investigated the relationship between prenatal growth or postnatal growth and obesity have not taken both into account, the relative importance of prenatal and early postnatal growth for obesity risk is still unclear, and the idea of mismatch between prenatal and postnatal growth is difficult to assess. It is also unclear whether rapid postnatal growth confers additional risk across the entire birthweight spectrum, or whether rapid postnatal growth has different implications for obesity risk depending on size at birth. The clinical implications of understanding the relationship between postnatal growth and obesity across the birthweight spectrum are critical to efforts to ensure healthy growth in childhood.
The intention of this systematic review is to elucidate which patterns of prenatal and postnatal growth may be linked to childhood obesity, synthesizing evidence from studies that measured the interaction between prenatal and postnatal growth and their associations with obesity in childhood or adolescence. We summarize and assess evidence for the hypotheses that prenatal growth and obesity are associated independent of postnatal growth, that postnatal growth and obesity are associated independent of prenatal growth, and that interactions exist between prenatal and postnatal growth and subsequent obesity.
DATA AND METHODS
Literature searches were conducted in PubMed and Embase databases in October 2014 using combinations of the following
1
Department of Environmental Health, Rollins School of Public Health, Emory University, Atlanta, GA, USA;2
Department of Epidemiology, Gillings School of Global Public Health, University of North Carolina at Chapel Hill, Chapel Hill, NC, USA and3
Department of Global Health, Rollins School of Public Health, Emory University, Atlanta, GA, USA. Correspondence: Dr SA Cunningham, Department of Global Health, Rollins School of Public Health, Emory University, 1518 Clifton Road, NE, Atlanta, GA 30322, USA. E-mail: [email protected]
Received 29 October 2015; revised 16 October 2015; accepted 21 October 2016; published online 1 March 2017
search terms for whole articles:birthweight/low birthweight/small for gestational ageANDrapid growth/accelerated growth/catch up growth/catch up weight/rapid postnatal growth/rapid weight gain/ rapid infant weight gain/rapid neonatal weight gain/growth rate/ growth velocity/infant growth/infant weight gain AND obesity/ overweight/adiposity. Additional studies were sought from cita-tions listed in the retrieved papers and relevant review articles.
Abstracts were reviewed for presentation of original research (no review articles or commentaries) that assessed the interaction between prenatal and postnatal growth measures on subsequent obesity or adiposity in humans prior to age 21. Studies that assessed the independent associations between prenatal or postnatal growth and subsequent obesity but did not consider the interaction between them were excluded. Studies were excluded if full articles were not published in English.
We reviewed full articles if the abstracts met the inclusion criteria or if a decision could not be made from the abstract alone. Information regarding study design, population, sample size, methods, results and limitations was recorded from each article using a standardized abstraction form. The literature screening process is displayed in Figure 1. The study was reported following PRISMA guidelines.
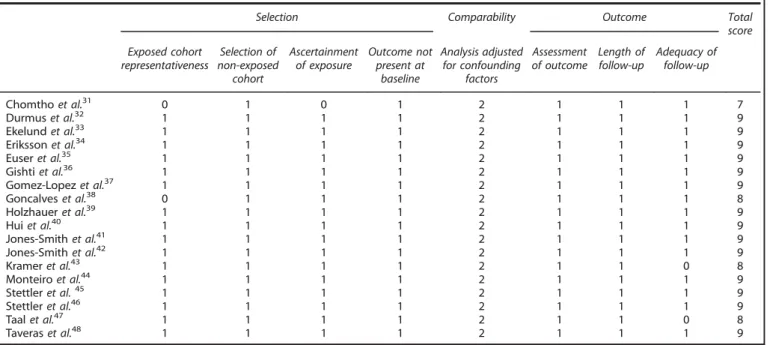
Two authors independently assessed the quality of all studies that met inclusion criteria using the Newcastle-Ottawa Scale.29The scale addresses three categories: Selection, Comparability and Outcome. Each category includes subitems that are assessed and scored for each study. The Selection category assesses four items, with a maximum score of four points: representativeness of the exposed cohort, selection of the non-exposed cohort, ascertain-ment of exposure and demonstration that the outcome of interest was not present at the start of the study. The Comparability category has one item: whether the study controls for confound-ing variables, with a maximum score of two points. The Outcome category assesses outcome ascertainment based on three items, with a maximum score of three points: assessment of the outcome, length of follow-up and adequacy of follow-up. Thus, a study is given one point for each item meeting criteria in the Selection and Outcome categories and two points for meeting criteria in the Comparability category, with a possible range between 0 and 9. Studies achieving 67% or higher (greater than 6 points) are considered 'good' quality; 34–66% (3–6 points) 'fair'; and below 33% (below 3 points) 'poor'.30
RESULTS
Characteristics of the 18 publications meeting the inclusion criteria, describing 16 studies, are shown in Table 1. All 18 publications reported results from cohort studies, 16 of which were prospective and 8 of which were population based. Study participants were born between 1959 and 2006. Four reports were published in 2000–2005, eight in 2006–2010 and six in 2011–2014. Nine (50%) reports were based on data from Europe, five (28%) from North America and four (22%) from other regions. Sample size ranged from 163 to 19 397: seven reports (39%) had 150–500 participants, three (17%) had 500–1000 participants, six (33%) had 1000–10 000 participants and two (11%) had 410 000 partici-pants. One study excluded infants weighing o2500 g at birth; nine studies excluded infants born preterm (gestational age o37 weeks).
The quality of the 18 studies included in this systematic review according to the Newcastle-Ottawa Scale is presented in Table 2.31–48 The mean total score was 8.7 out of a maximum score of 9 (range 7–9), indicating that, overall, the methodological quality was high. All 18 studies were awarded the highest possible score (2 stars) for the Comparability category, and 16 out of 18 studies were awarded the highest possible score (3 stars) for the Outcome category, with 2 studies receiving no stars for adequacy of follow-up. For the Selection category, two studies were awarded no stars for representativeness of the exposed cohort, and one study was awarded no stars for ascertainment of exposure.
Measures of prenatal growth
Birthweight is the most commonly used proxy measure of prenatal growth and is used as an indicator of fetal growth restriction when other indicators are not available. Low birth-weight (LBW) is generally defined as birthweight o2500 g, high birthweight as44000 g and normal birthweight as 2500–4000 g. Of the 18 studies included in this review, 12 used birthweight as a proxy of prenatal growth, with 4 using birthweight in grams or kilograms as a continuous variable, 3 using birthweight categories (quartiles or tertiles) and 5 using z-scores for birthweight4 or birthweight for length.1Two additional studies used age- and sex-specificz-scores for BMI at birth relative to a reference population. Four other publications considered birthweight in the context of gestational age: three used size-for-gestational-age categories, with small for gestational age (SGA) defined as birthweight⩽5th or⩽10th percentile and large for gestational age (LGA) defined as birthweight⩾90th or⩾95th percentile compared with a referent appropriate for gestational age (AGA) group; the fourth measured intrauterine growth restriction (IUGR), defined as birthweight for gestational age o10th percentile of the Williams curve, a US population-based reference for fetal growth which includes measurements from 20 weeks gestation onward.44,49
One publication further classified LBW infants based on body proportionality using the Ponderal Index (PI) (weight (g)/length (cm)3× 100) to distinguish between newborns who were stunted (length at birtho−2z-score and PI ⩾2.5) vs wasted (length at birth⩾−2z-score and PI o2.5).38
Measures of postnatal growth
Standard definitions for rates of growth in thefirst two years after birth have not been adopted and studies used varying terms and measurements, most commonly 'catch-up growth', 'rapid growth' and 'accelerated growth'. Postnatal growth has commonly been measured as change in weight z-scores or standard deviation (s.d.), often using 40.67 s.d. units. This cutoff was proposed by Onget al.24to distinguish 'catch-up' growth from normal growth, defined as changes within the range of −0.67 to 0.67 s.d. This cutoff is used because it represents the width of each percentile Figure 1. Literature screening for studies assessing the interaction
between prenatal and postnatal growth. Numbers indicate article counts retained or excluded at each step of the process.
Table 1. Desi gn chara cteristics of stud ies exam ining the int eraction of prenatal and po stnatal growth ( n = 18) Reference and (da ta set name) Location n Study design Study population P rena tal g rowth m easure/proxy Postna tal growth measure Timing o f growt h Obesit y outcomes Age at assessment Interaction analysis Chomtho et al. 31 Lo ndon, England 234 Retrospe ctive cohort Born a t term appro x . 1988 – 2004 a BW (s.d . score) Δ weigh t s.d . sco re Birth – 3 mos
BMI FMI FFMI WC
4 – 20 yrs Interaction term Durmus et al. 32 (Generation R Study) Rotterdam, The Netherlands 481 P opu lation-base d prospectiv e coh or t Born 2002 – 2006 BW (ter tiles) Catch-up g rowth (increase weigh t s.d . sco re 4 0.67) Birth – 2 y rs Ratio of preper itoneal to subcutan eous distanc e b 2 y rs Strati fi ed analysi s Ekelun d et al . 33 (SWEDES Study) Stockholm, Sweden 248 Pro spectiv e coh or t Born 1984 – 1986 BW (kg) Δ weigh t s.d . sco re Rapid weight gain (increase weigh t s.d . sco re 4 0.67) Birth – 6 mos
BMI WC Relati
v e fat mass (%) Fa t mass (kg) Fat-free mass (kg) 17 yrs Interaction term Erikss on et al. 34 (C OMP ASS Study) Stockholm, Sweden 2453 P opu lation-base d retrospectiv e cohort Born 1985 – 1987 BW ( z -score) W eight z -score B irth – 1 y r
BMI FMI FFMI Fat
mass (%) WC 15 yrs Interaction term Euse r et al. 35 (PO P S S tudy) The Netherlan d s 403 Pro spectiv e coh or t Born 1983 o 32 wks gestation and/ or BW o 1500 g BW (s.d . score) Δ weigh t s.d . sco re Birth – 3 mos
BMI WC Sum
of 4 SFT c Fa t mass (kg) Fat-free mass (kg) % body fat 19 yrs Interaction term Gishti et al. 36 (Generation R S tudy) Rotterdam, The Netherlands 6464 P opu lation-base d prospectiv e coh or t Born 2002 – 2006 Size for gesta tional age: SGA ( o 10th p c), A G A ( ⩾ 10th – 90t h p c), L G A ( 4 90th pc) Grow th acceleration ( Δ SDS score 4 0.67) Grow th decele ration ( Δ SDS score o 0.67) Birth – 2 y rs
BMI FMI FFMI Android/
gynoid fat ratio d 6 y rs Interaction term & strati fi ed analysis Gomez -L opez et al. 37 (QU A LIT Y S tud y ) Quebec , Canada 423 Pro spectiv e coh or t Term A GA born app ro x. 1995 – 2000 with parental histor y of obesit y BM I z -score at birth Δ BMI z -score B irth – 2 y rs BMI z-score
WC Wa
ist-to-height
ratio
FMI FFMI %
Table 1. (C onti nued) Referen ce and (data set name) Location n Study desi gn Study popula tion P renatal growt h m easure/proxy Postna tal growth measure Tim ing o f grow th Obesi ty outcomes Age at assessment Interacti on analysis Krame r et al. 43 (PR OBIT ) Republic of Belarus 13 879 Pro sp e ctive cohor t Term-born ⩾ 2500 g in 1996 – 1997 Size fo r gestational age: SGA ( o 10th p c), A G A ( ⩾ 10t h – 90th p c), LG A ( 4 90th pc) C atch-up g rowth (increase weigh t-f or-age z -score 4 0.67 amon g S GA children) C atch-down growth (decreas e weigh t-f or-age z -score 4 0.67 amon g LGA children) Birth – 3o r 6 mos BM I % body fat FM I
WC Wa
band or the distance between two percentile bands on a growth chart, and it has also been used in recent years to define 'accelerated' or 'rapid' growth relative to normal growth.
Studies in this review used eight measures of postnatal growth, six using change in weight s.d. scores and eight using 0.67 as a cutoff for change in weightz-scores (six studies) and/or change in weight-for-agez-scores (three studies). Other measures were rate of weight gain per month in 100-g increments (one study), change in weight in kilograms (one study), change in BMI z-score (two studies) and change in weight-for-length z-score quartiles (one study). Finally, one study measured postnatal growth using BMI velocity relative to the study population’s average growth curve, and another used weight z-score at age 1 year adjusted for birthweightz-score.
The term 'catch-up growth' has been used more consistently than other terms to reflect a change in weightz-score or weight-for-age z-score greater than 0.67 s.d. units; still, studies have differed in who can, by definition, experience catch-up growth. Originally, the term was applied exclusively to children who were low birthweight or small for gestational age, with the idea that these children were catching up to their intended growth curve after restricted intrauterine growth. Although children born small are more likely to experience growth that crosses centile bands upwards on a growth chart, children born at normal birthweight or appropriate for gestational age and children born at the high end of the birthweight distribution or large for gestational age can also cross centile bands. Some studies have expanded the use of the term catch-up growth to describe growth of any child who crosses centile bands upward in thefirst one or two years of life. Some studies also measured 'catch-down growth', representing a decrease inz-score greater than−0.67 s.d. units. The term catch-down growth has mostly been used to describe slow growth of children who were large for gestational age.
Studies included in this review assessed postnatal growth over varying time periods, most commonly between birth and 1 year (three studies) or birth and 2 years (six studies). Some used shorter time periods: birth to 3 months (three studies), to 4 months (one study) and to 6 months (four studies), and some took measures at multiple time points before age 1 year (nine studies).
Measures of obesity
The 18 publications meeting inclusion criteria used 19 obesity-related outcomes, with one to seven outcomes per study. The most commonly measured outcomes were BMI (12 studies), waist circumference (7 studies), and overweight or obesity based on cutoff points relative to various growth references (8 studies). BMI and cutoffs based on it are a commonly used measure of excess weight but do not account for body fat distribution, fat mass or lean mass. Their validity for use in children has been debated because their accuracy varies with degree of body fatness, having high accuracy as an indicator of excess body fat among obese children and poorer accuracy among overweight and thin children.50 Some studies also examined direct measures of adiposity: percent body fat (four studies), fat mass (three studies), fat-free mass (two studies), sum of skinfolds (four studies), relative fat mass (one study), subscapular to triceps skinfold ratio (one study), central fat ratio (one study), central to total fat ratio (one study), waist-to-hip ratio (one study), waist-to-height ratio (one study), ratio of preperitoneal distance to subcutaneous transverse distance (one study), android/gynoid fat ratio (one study), fat mass index (FMI) (five studies) and fat-free mass index (FFMI) (four studies). These measures were collected between the ages of 6 months39and 20 years,32with three studies at ages 1–5 years; seven studies at 6–12 years; four studies at 13–19 years; and three studies across age groups.31,41,45
Summary offindings
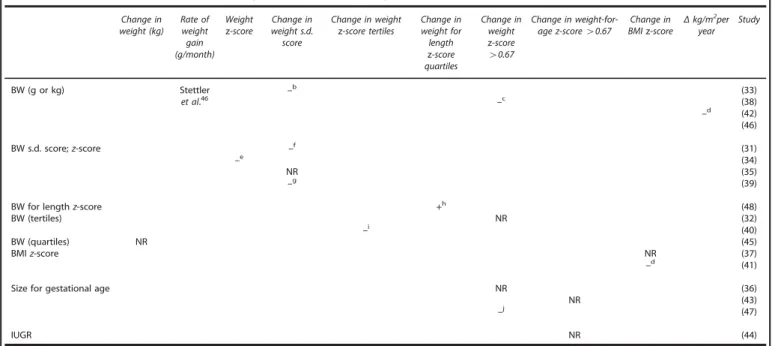
Independent associations between prenatal growth, postnatal growth and obesity. Ten studies eligible for this review assessed the relation between prenatal and postnatal growth (see Appendix Table A1), and nine of these found that children and adolescents born lighter were more likely to experience rapid growth in early life than children and adolescents born heavier; one study examining birthweight adjusted for length found that heavier newborns tended to have larger changes in weight for length between birth and 6 months.48 Since prenatal and postnatal growth patterns are correlated, it is important to understand the independent associations that each may have with obesity.
Table 2. Quality assessment of the 18 studies included in the systematic review according to the Newcastle-Ottawa Scale
Selection Comparability Outcome Total
score
Exposed cohort representativeness
Selection of non-exposed
cohort
Ascertainment of exposure
Outcome not present at
baseline
Analysis adjusted for confounding
factors
Assessment of outcome
Length of follow-up
Adequacy of follow-up
Chomthoet al.31 0 1 0 1 2 1 1 1 7
Durmuset al.32 1 1 1 1 2 1 1 1 9
Ekelundet al.33 1 1 1 1 2 1 1 1 9
Erikssonet al.34 1 1 1 1 2 1 1 1 9
Euseret al.35 1 1 1 1 2 1 1 1 9
Gishtiet al.36 1 1 1 1 2 1 1 1 9
Gomez-Lopezet al.37 1 1 1 1 2 1 1 1 9
Goncalveset al.38 0 1 1 1 2 1 1 1 8
Holzhaueret al.39 1 1 1 1 2 1 1 1 9
Huiet al.40 1 1 1 1 2 1 1 1 9
Jones-Smithet al.41 1 1 1 1 2 1 1 1 9
Jones-Smithet al.42 1 1 1 1 2 1 1 1 9
Krameret al.43 1 1 1 1 2 1 1 0 8
Monteiroet al.44 1 1 1 1 2 1 1 1 9
Stettleret al.45 1 1 1 1 2 1 1 1 9
Stettleret al.46 1 1 1 1 2 1 1 1 9
Taalet al.47 1 1 1 1 2 1 1 0 8
Taveraset al.48 1 1 1 1 2 1 1 1 9
Studies not adjusting for postnatal growth have reported that birthweight is positively associated with BMI and with odds of obesity in childhood and adolescence.4,7,51 In this analysis we report on the relationship between prenatal growth and subsequent obesity after accounting for postnatal growth (estimates shown in six studies) (see Table 3). The majority reported positive associations between prenatal growth and obesity measures even after accounting for postnatal growth. Four studies reported that birthweight or BMI at birth was significantly and positively associated with at least one obesity outcome, with larger newborns having higher measures of BMI (4/4), waist circumference (3/3), relative fat mass (1/1), fat-free mass or fat-free mass index (2/2), and waist-to-height ratio (1/1). On the other hand, two of the six studies reported significant negative associations between birthweight and some measures of obesity after accounting for postnatal growth, with lighter newborns having higher measures of sum of skinfolds (1/1), percent body fat or percent fat mass (2/3) and central fat ratio (1/2). The six studies showed no clear pattern between proxies of prenatal growth and odds of overweight or obesity, central fat ratio, or fat mass or fat mass index. The study that examined boys and girls separately reported that birthweight was positively associated with BMI, waist circumference, and fat-free mass for boys only, and that birthweight was negatively associated with percent body fat for girls only, with lighter newborn girls having a higher percentage of body fat compared with heavier newborn girls.34
Studies not adjusting for prenatal growth have reported that postnatal growth is positively associated with subsequent obesity.19,20In this analysis we report on the relationship between postnatal growth and subsequent obesity after accounting for prenatal growth (estimates shown in 11 studies) (see Table 3). All 11 studies found postnatal growth to be significantly positively associated with at least one measure of obesity: BMI (9/9), overweight or obesity (5/5), waist circumference (6/6), fat mass or fat mass index (6/6), fat-free mass or fat-free mass index (6/6), percent body fat or percent fat mass (4/4), relative fat mass (1/1), central fat ratio (2/2), waist-to-height ratio (1/1) and sum of skinfolds (2/3). These associations were observed in diverse populations across a variety of periods of growth and a range of ages at outcome assessment. They collectively indicate that postnatal growth is significantly associated with obesity indepen-dently of prenatal growth.
Interactions between prenatal growth and postnatal growth and obesity. Eighteen studies have reported on the interactions between prenatal and postnatal growth, assessing whether the implications of postnatal growth for obesity are different for children and adolescents who experienced different prenatal growth patterns. These studies used regression models with interaction terms (12 studies) and stratified analyses (10 studies) (see Table 3). Of the 18 studies, 15 reported that postnatal growth confers higher risk of obesity for children and adolescents of all sizes at birth. Four of the 15 studies reported that the interaction terms were not significant but did not show any further results, five reported only theP-values for the interaction terms, and six provided coefficient estimates.
Three studies found significant interactions between prenatal and postnatal growth variables, indicating that the relationship between postnatal growth and obesity differs for children according to their prenatal growth. Huiet al.,40one of the largest studies, with data from China, examined birthweight tertiles, change-in-weightz-score between birth and 3 months, and BMI and overweight at age 7 years. The interaction between birthweight and change-in-weight z-score was statistically sig-nificant (P= 0.001) and indicated that accelerated growth was more strongly associated with higher BMI in children with lower birthweight than children with higher birthweight. Children in the
lowest birthweight z-score tertile (mean birthweight of 2.8 kg) who experienced accelerated growth (change-in-weight z-score 40.67 s.d.) had similar increases in BMI z-scores by age 7 to children with medium birthweight (mean 3.2 kg) and medium growth (second tertile) and to children with high birthweight (mean 3.6 kg) and slow growth (first tertile) (ΔBMI z-score 0.71, 0.70 and 0.70). The interaction was more pronounced among boys, while girls’weight tracked more with their birthweight than did boys’, whatever their postnatal growth. Comparing odds of overweight at age 7 years, boys in the lowest birthweight tertile with accelerated growth had odds of overweight at least as high as boys in the highest birthweight tertile without accelerated growth (odds ratio (OR) = 2.50, 95% CI (1.71, 3.66) and OR = 2.31 (1.61, 3.30), respectively). Across analyses, children in the highest birthweight tertile with accelerated growth experienced the highest odds of overweight, though accelerated growth was much less common among these children compared with children in the lowest birthweight tertile (14.5% vs 53.3%).
The second study, Jones-Smithet al.,41examined BMIz-score at birth as a prenatal growth measure, any increase in linear BMI z-score between birth and 1 year as a measure of accelerated growth, and BMI and overweight at ages 4–6 years among Mexican children. They found significant interactions between BMI z-score at birth and increases in BMI z-score41in multiple linear and logistic regression analyses (interaction terms wereb=−0.15, (−0.25, −0.05) and OR = 0.64, (0.44, 0.90) respectively). A larger increase in BMI z-score in the presence of low or normal BMI z-score at birth, but not high BMIz-score at birth, was associated with higher odds of overweight at 4 to 6 years (low BMIz-score: OR 3.58, 95% CI (1.68, 7.44); normal BMIz-score: OR 2.23, 95% CI (1.12, 4.46); high BMIz-score: OR 1.41, 95% CI (0.63, 3.16)). Among children with low and normal BMIz-scores at birth, accelerated growth was associated with higher risks of overweight at ages 4–6 years compared with children with low and normal BMIz-scores at birth, respectively; however, among children with high BMI z-scores at birth, accelerated growth did not result in higher risks of overweight compared with children with high BMIz-scores at birth who did not experience rapid growth. Thus, accelerated growth in the first year of life conferred additional risk of overweight among children small or normal size at birth, but not among children who were large at birth. This result differs from other studies included in this review that found children born large who experience rapid growth typically have a greater risk of obesity compared with children born large who do not experience rapid growth.36,40,45,46The conflictingfinding reported by Jones-Smithet al.41 was may be due to the definition of large size at birth: it usedz-score to define size at birth, while others used size for gestational age or tertiles of birthweight. However, children in the Jones-Smith 2007 cohort who were large at birth (regardless of whether they experienced accelerated growth) still had the highest risk of overweight.
The third study, Gishtiet al., assessed birthweight for gestational age categories (SGA: o10th percentile, AGA: ⩾10th–90th percentile, LGA: 490th percentile), change in weight s.d.40.67 from birth to 2 years (catch-up, catch-down and normal growth), and measured BMI, fat mass index, lean mass index and android/ gynoid fat ratio at 6 years among children in the Netherlands.36 Interaction terms between gestational age categories and change in weight categories were significantly associated with fat mass and android/gynoid fat ratio; no details are provided. In stratified analyses, SGA children with catch-up growth had significantly higher measures of android/gynoid fat ratio, reflecting central body fat distribution in the abdomen and hip regions, compared with AGA children with normal growth; they had values of android/gynoid fat ratio similar to AGA children with catch-up growth and to LGA children with normal growth (SGA: 0.22 (0.09, 0.35); AGA: 0.26 (0.18, 0.34); LGA: 0.21 (0.04, 0.38)). SGA children with catch-up growth resembled AGA children with normal
Table
3.
Summ
ar
y
o
f
Resul
ts:
Assoc
iatio
ns
b
etween
P
renatal
Grow
th,
P
ost
natal
Grow
th,
and
Indic
ators
of
Obesit
y
a
BMI
or
BMI
z-score
Odds
of
overweight
or
obesity
Waist
circumference
Fat
mass
or
fat
mass
index
Fat-free
mass
orfat-free mass
index
%
body
fat
or
fat
mass
Relative fat
mass
Central
to
total
ratio
or
central
fat
ratio
b
Waist
to
height ratio
Waist-to-hip
rati
o
or
android/gynoid fat
rati
o
Sum
of
skinfold thickness
c
subscapular
to
triceps
skinfold
thickness
ratio
d
Ratio
of
preperitoneal
to
subcutaneous distance
e
Central fat mass
f
Peripheral fat
mass
f
Stu
dy
Prena
tal
growth
BW
+
+
NS
+
(33)
NR
(42)
+
h
(46)
NR
NR
(38)
NR
NR
NR
NR
(31)
NR
NR
NR
NR
NR
NR
(35)
−−
−
(39)
+Bo
ys
only
+Boys
only
NS
+Boys
only
−
Girls only
(34)
NR
NR
NR
(48)
NR
(32)
NR
NR
(40)
NR
(45)
BMI
+
+
+
+
+
NS
+
(37)
++
(41)
Size
fo
r
gestational
age
NR
NR
NR
NR
NR
(43)
NR
NR
NR
NR
NR
(47)
NR
NR
NR
NR
(36)
IUGR
NR
(44)
Postnat
al
growth
Δ
weight
+
(45)
+
(46)
++
+
+
+
(34)
++
+
+
(31)
++
+
+
+
(33)
i
+
+
+
+
+
N
S
(35)
+
+
+
(39)
++
(40)
i
+
g
+
g
+
g
(48)
NR
(32)
NR
NR
NR
NR
NR
(47)
NR
NR
NR
NR
(36)
NR
NR
(38)
NR
NR
NR
NR
NR
NR
(43)
NR
(44)
BMI
+
+
+
+
+
+
+
(37)
++
(41)
NR
(42)
Interactio
n:
Prenatal
×
Postnat
al
BW
s.d
.
score
×
Δ
weight
s.d
.
score
NS
NS
NS
NS
(31)
j
BW
×
catch-up
growth
k
–
,N
S
l
(32)
BW
(kg)
×
weight
NS
NS
NS
NS
NS
(33)
j
NS
NS
NS
NS
NS
(34)
s
NS
NS
NS
NS
NS
NS
(35)
j
−
P
=
0.76
t
−
P
=
0.06
u
NS
(39)
P
4
0.10
(45)
j
P
=
0.50
(46)
j
Size
fo
r
gestational
age
×
presence
of
catch-up
growth
k
SGA:
NS
A
GA:
+
LGA:
+
v
SGA:
+,
NS
A
GA:
+
LGA:
+
w
SGA:
−
,N
S
A
GA:
−
LGA:
−
x
SGA:
+
A
GA:
+
LGA:
+,
NS
y
(36)
SGA:
NS
LGA:
+
m
SGA:
NS
LGA:
+
n
SGA:
NS
LGA:
+
o
SGA:
NS
LGA:
NS
p
SGA:
NS
LGA:
NS
q
SGA:
+
LGA:NS
r
(43)
SGA:
−
A
GA:
+
LGA:
+
z
SGA:
NS
A
GA:
+
LGA:
+
aa
SGA:
NS
A
GA:
+
LGA:
+
ab
SGA:
NS
A
GA:
+
LGA:
+
ac
SGA:
NS
A
GA:
+
LGA:
+
ad
(47)
BMI
×
BMI
N
S
N
S
N
S
N
S
N
S
N
S
N
S
(37)
j
−
P
o
0.01
ae
−
P
o
0.05
af
(41)
Table 3. (C ontinue d) BMI or BMI z-score Odds of overweight or obesit y Waist circumfe rence Fat mass or fat mass index Fat-free mass orfat-free mass index % body fat or fat mass Relative fat mass Central to total ratio or central fat ratio b Waist to height ratio Waist-to-hip ratio or android/gynoid fat ratio Sum of skinfold thickness c subscapular to triceps skinf old thickness ratio d Rati o o f preperitoneal to su bcutaneous distance e
Central fat mass
f Peripheral fat mass f Study BW × rapid growth LBW : + , N S ABW : + , NS ag LBW : + , N S ABW : + ah (38) + P = 0.01 ai + aj (40) BW × B MI P = 0.78 (42) j IUGR × Rapid growth ak OW : IUGR: NS; non − IUGR: + Obesity : IUGR: NS; non − IUGR: NS al OW: P = 0.42
Obesity: P=
0.33 (44) WFL × WFL P = 0.92 NR (48) Abbreviations: A GA, appropriate for g estational a ge; B MI, b ody m ass index; BW , b ir thweight; CUG, catch-up growth; FM, fat mass; FMI, fat mass index (kg/m 2); FFM, fat-free mass; FFMI, fat-free mass index (kg/m 2); g , grams; IUGR, intrauterine g rowth restricted; k g , kilograms; L GA, large for gestational age; mos , months; O W , ov er weight; R G, rapid g rowth; s.d ., standard deviation; SFT , sk inf old thickness; SGA, small for g estational a ge; STR, subscapular to triceps sk inf old thicknes s ratio; PP/SC-distance, preperitoneal to subcutaneous distance; WC, waist cir cumfe rence; W FL, w eight-f or-length; WHR, waist-to-hip ratio; wks , weeks; Δ , change. aThis table presents a summar y of results from all ar ticles included in this review that assessed the independent eff ec t o f p renatal growth, while acco unting for the effe ct of postnatal growth, the independent effe ct of postnatal growth, while accounting for the e ffe ct of prenatal growth, and the interacti on between prenatal growth a nd post natal growth. Symbols indicate the sign a nd signi fi cance of associations with each obesity-related outcome: signi fi cant p ositiv e association (+), signi fi cant n egativ e association ( − ), and nonsigni fi cant association (NS). Blanks cells indicate the association w as not assessed . bThe central fat ratio ref ers to a ratio of the sum of suprailliacal and subscapular SFT to the sum of triceps a nd biceps SFT . cThe sum of four SFT ref ers to the sum o f biceps, triceps, suprailliacal and subscapular sk inf old thicknesses. dThe subscapular to triceps skinfold thicknes s ratio (STR) is used to assess regional d iff erences in subcutaneous fat distribution, with a h igher rat io representing increased central fat deposition. eThe ratio of preperitoneal to subcutaneous distance (PP/SC-distance) ref ers to the ratio between preperitoneal fat thickness and subcutaneous thi ckness, with a h igher ratio representing a more a dvers e d istribution o f a bdominal fat. fC entral fat mass ref ers to the sum of suprailliacal and subscapular SFT . P eripheral fat mass ref ers to the sum of triceps and biceps SFT . gResults were not signi fi cant for quar tile 2 o f postnatal growth with an y outcomes b ut were positiv e for quar tiles 3 and 4 with all outcomes. hThis association b ecame nonsigni fi cant a fter adjusted fo r b reastfe eding a nd weight a t 1 year . iThese studies used multiple postnatal growth m easurements. jSign a nd/or P -value o f interacti on term not repor ted . kIncrease in weight s.d .score 4 0.67. lWithin each BW ter tile , CUG not signi fi cantly associated with adv erse abdominal fat distribution (compared with 2nd ter tile BW , normal g rowth): 1st ter tile BW − 4.40 ( − 15.89, 8 .76); 2nd ter tile BW : − 12.10 ( − 25.40, 3.56); 3rd ter tile BW − 4.78 ( − 36.17, 4 2.05), P trend = 0.02. mSGA w ith CUG no signi fi cant d iff erence in BMI compared with AGA with normal growth − 0.2 ( − 0.4, − 0.1); LG A w ith continued g rowth had signi fi cantly increased BMI (0.8 (0.4, 1.1)). nSGA w ith CUG no signi fi cant d iff erence in WC compared with AGA with normal growth ( − 0.3 ( − 0.9, 0.3)); LG A w ith continued growth signi fi cantly increased W C compared w ith A G A w ith normal growth (1.9 (1.1, 2 .8)). oSGA w ith CUG no signi fi cant d iff erence in FMI compared with A G A w ith normal g rowth ( − 0.1 ( − 0.3, 0.05)); LG A w ith continued g rowth signi fi cantly increased FMI compared with A G A w ith normal growth (0.2 (0.01, 0.50)). pSGA w ith CUG no signi fi cant d iff erence in % b ody fat compared with AGA with normal growth ( − 0.2 ( − 0.9, 0.4)); L G A w ith continued g rowth n o signi fi cant d iff erence in % b ody fat compared with AGA with normal g rowth (0.5 ( − 0.4, 1.5)). qSGA w ith CUG no signi fi cant d iff erence in WHR compared to AGA with normal growth (0.003 ( − 0.001, 0 .007)); A G A w ith continued g rowth n o signi fi cant diff erence in WHR compared to AGA with normal g rowth (0.005 ( − 0.001, 0.011)). rSGA w ith CUG signi fi cantly increased S:T ratio compared with AGA with normal g rowth (0.002 (0.003, 0 .04)); LG A w ith continued g rowth h ad no signi fi cant d iff erence in S:T ratio compared with A G A w ith normal growth ( − 0.02 ( − 0.04, 0.01)).
sP4
growth in BMI, fat mass index and lean mass index but had body fat more centrally distributed.
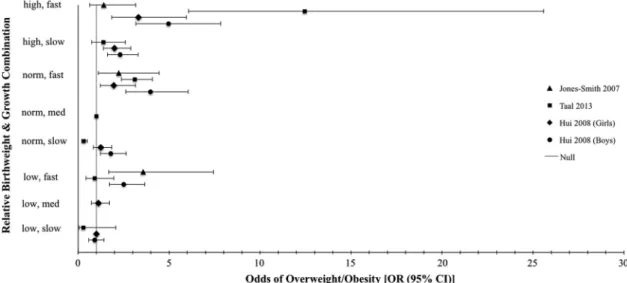
Figure 2 depicts odds of overweight and obesity among children aged 2–7 years according to prenatal and postnatal growth patterns among the three studies that presented odds of overweight or obesity by size at birth and speed of growth (see Huiet al.,40Jones-Smith41 and Taalet al.47). Odds of overweight and obesity were highest for children born heavier who also grew rapidly. Children of normal birthweight who grew rapidly were at higher risk of overweight or obesity than children born heavier who then grew more slowly but had lower risks than children born heavier who then grew rapidly. Children born light (though not necessarily low birthweight) who experienced rapid growth had higher odds of overweight and obesity compared with children born light who experienced slow or normal growth; they also experienced higher odds of overweight and obesity compared with normal birthweight children with slow or normal growth; their risks approximated those of normal birthweight children with rapid growth.
Among the 15 studies that did notfind significant interactions between prenatal and postnatal growth, four studies found no significantly higher risk of obesity in the presence of rapid postnatal growth among children or adolescents born SGA, IUGR, LBW stunted or LBW wasted.38,43,44,47 Monteiro et al.44 reported that rapid growth was not significantly associated with overweight or obesity risks among adolescents (ages 14–16 years) who had experienced IUGR (overweight prevalence ratio (PR) = 2.46 (0.70, 8.65); obesity: PR = 2.69 (0.22, 32.51)), but it was positively associated with obesity among adolescents who had not experienced IUGR (PR = 1.63 (1.10, 2.43)). This result warrants further study, since infants who experience IUGR have higher mortality than those who do not,52which is a potential competing risk to obesity, potentially biasing results towards the null. Kramer et al.43compared SGA children who did and did not experience catch-up growth with AGA children who experienced normal growth and found no significant differences at age 11.5 years in BMI, percentage body fat, fat mass index, waist circumference or waist-to-hip ratio.43However, SGA children with catch-up growth resembled AGA children on almost all measures and had healthier measures on all outcomes than SGA children without catch-up growth, who remained significantly lighter, shorter, and thinner
than AGA children. Similarly, Taal et al.47 found no difference between SGA children with catch-up growth and AGA children with normal growth in terms of odds of overweight, obesity or skinfold thickness measured at ages 2–4 years: for each group (SGA, AGA and LGA) catch-up growth resulted in higher fat mass and BMI. However, odds of obesity were similar among SGA children with catch-up growth and AGA children with normal or catch-down growth. Goncalveset al.38 compared the association between rapid postnatal growth and BMI and waist circumference at age 8 years between children with appropriate BW (ABW) and children with low birthweight who were either stunted (16.6%) or wasted (22.1%) based on the Ponderal Index. LBW children with rapid growth had similar measures of BMI and waist circumference to ABW children with and without rapid growth. These results entail that postnatal growth may be less problematic for children or adolescents who are growth-restrictedin uterothan for others.
DISCUSSION
This review evaluated evidence of the independent and combined effects of prenatal growth and postnatal growth for childhood obesity. Results indicate that, accounting for subsequent postnatal growth patterns, prenatal growth is generally positively associated with obesity, though there are some inconsistencies when assessing adiposity and some differences between boys and girls. Accounting for prenatal growth, postnatal growth is positively associated with obesity and adiposity across the birthweight distribution. Of the 18 studies that have examined whether the implications of postnatal growth for obesity differ by size at birth, 15 reported that this association is similar for children/adolescents of all sizes at birth. However, three studies found that postnatal growth increased risks of obesity as much or more for infants at the lower end of the birthweight distribution as for infants born at a normal size or large size.
Across studies, children and adolescents who were born heavy and experienced rapid postnatal growth had the highest odds of obesity, highest BMIs and indicators of adiposity. Children and adolescents born in the normal range of birthweight who experienced rapid postnatal growth were also at higher risk of obesity-related outcomes, with risk approximating those of high birthweight children and adolescents who experienced slow
Figure 2. Odds of overweight and obesity among children aged 2–7 according to their relative birthweight and postnatal growth strata. Results are from three studies reporting odds ratios and 95% confidence intervals for overweight or obesity for each combination of birthweight, categorized as low, normal (norm) or high, and postnatal growth categorized as slow, medium (med) or fast. These strata reflect the relative sizes at birth for each report’s study population and do not correspond with clinical definitions of low birthweight (o2500 g) or high birthweight (44000 g).▲Jones-Smith 2007.■Taal 2013.♦Hui 2008 (Girls).●Hui 2008 (Boys).—Null.
postnatal growth. Children and adolescents born lighter who experienced rapid growth may also be at higher risk of some obesity-related outcomes, although there is some evidence that those who are growth-restrictedin uteromay benefit from rapid postnatal growth. More research is needed to confirm the patterns indicated by previous studies to assess the balance between the risks and benefits of rapid growth, and to refine recommenda-tions. These studies highlighted that it is important to monitor growth from birth to 2 years of age, as this is an important developmental period for all children. A priority for research will be to examine the implications of specific prenatal growth patterns and of specific types and timing of postnatal growth patterns; it will be important to examine patterns from across the distribution of prenatal and postnatal growth.
An important question is which groups should be compared to understand the implications of prenatal and postnatal growth for health: should low-birthweight infants who grow rapidly be compared with (1) low-birthweight infants who do not grow rapidly, (2) average-birthweight infants with average postnatal growth or (3) average-birthweight infants who grow rapidly? An informative approach is to make comparisons with ideal prenatal and postnatal growth to get an overall sense of risk (i.e. reference category being those with normal birthweight and normal postnatal growth). Another approach would be to make comparisons with a group that differs only on postnatal growth in order to determine whether rapid postnatal growth is beneficial or harmful given the growth pattern experienced before birth. There is currently no standard practice, and studies have used each of these approaches along with proxy measures for both prenatal and postnatal growth (such as birthweight and change in weight between two time points) that do not fully capture the dynamic patterns of infant growth. Afirst step to addressing this challenge will be to systematically assess each of these comparisons, preferably within the same population. This step will identify which groups are different from each other and where are the differences, when we hold other conditions constant. It will also elucidate which components of prenatal and postnatal growth are being captured with various measures and which are relevant for subsequent growth. A novel modeling method, SuperImposition by Translation and Rotation (SITAR), has been proposed as a way to independently examine factors that may influence growth parameters, such as size and velocity, in different ways.53,54 Latent class growth modeling is one method used recently to distinguish groups of children with biologically distinct growth trajectories and estimate the effects of prenatal and postnatal exposures on the odds of membership in a specific growth trajectory group.55 Future research could benefit from utilizing these advanced methods of studying early life growth patterns.
Among the studies that found similar associations between postnatal growth and obesity for all infants, some features may entail that thefindings are not definitive. One study had very few low-birthweight children,32three did not report on the proportion of participants in their studies born low birthweight45–47and one included no low-birthweight children.43 For six of the studies, sample sizes of the subgroups are not shown, and the numbers of participants who were born small and then grew rapidly may be small.32,44–48Samples with few participants born low-birthweight, as well as stratification of participants resulting in small subgroups, can result in an inability to detect significant differences across groups. Another study assessed effect modification only among adolescents born low-birthweight;35 the inclusion of only those born low-birthweight precludes assessment of whether there is a different association between postnatal growth and obesity for those born low-birthweight compared with those born larger. Future studies could be designed and powered to be general-izable across the birthweight distribution.
Our study and the literature it described have limitations. Comparison of results between the studies is complicated by differences across them in measures of prenatal growth, postnatal growth and obesity-related outcomes. The periods of postnatal growth varied in duration and age, as did age at outcome assessment and reference standards used for overweight and obesity. Standard definitions and measures of prenatal and postnatal growth have not been uniformly adopted, nor have measures of obesity and adiposity in childhood and adolescence. While studies have used measures such as weight at birth and BMIz-score at birth as measures of prenatal growth, these proxies are neither equivalent to each other nor accurately capture prenatal growth. A child of the same birthweight can have reached that birthweight through very different growth patterns, including unimpaired intrauterine growth or asymmetrical or symmetrical intrauterine growth retardation—all of which follow different growth patterns and may have different implications for subsequent metabolic conditions. To better understand the relationships between prenatal growth and obesity, future studies should consistently measure prenatal growth by gestational age, as has also been previously recommended.22,56Studies that use other proxies, such as birthweight, should be very clear about what such a measure can and cannot tell us about prenatal growth. Lack of standard terminology is a major concern: several studies used the same terms for different measures of postnatal growth and others used different terms for the same measure. For example, of studies reporting on 'rapid growth', one used the term to describe an increase in weight-for-agez-score greater than 0.67 units,44while the other used it to refer to the highest quintiles of weight gained per month;46a third study used the same cutoff but named it 'accelerated growth'.40 Adoption of standard definitions and measures of prenatal growth, postnatal growth and obesity-related indicators using a standard reference popula-tion will help solidify our understanding of these topics. For example, though it is often difficult to discern between physiology and pathology, the term catch-up growth should be used for a physiological condition of temporary overgrowth, as catch-up growth takes the child back onto his or her original growth centile trajectory; in contrast, the term rapid growth should be limited to denote an abnormal condition of overgrowth.
Research is needed to better understand associations between prenatal growth, postnatal growth and obesity, and whether growth patterns have different implications for girls and boys, as one of the studies suggested. It will also be important to determine which aspects of body size and body composition may be affected by prenatal or postnatal growth, and whether rapid postnatal growth is linked with a general increase in body size or a selective increase in some aspect of body composition. The mechanisms by which early life growth patterns are associated with subsequent adiposity require more research, including an examination of the links between environmental and behavioral factors and early life growth patterns, such as sleep, activity levels and family resources.57
Based on thefindings summarized here, we can conclude that early life growth patterns have implications for future disease risk, with prenatal and postnatal periods each contributing to the development of later obesity. Prenatal and postnatal growth patterns could be used to construct an early life risk profile to identify children who may benefit from early intervention to reduce the risk of chronic disease later in life.
REFERENCES
1 de Onis M, Blossner M, Borghi E. Global prevalence and trends of overweight and obesity among preschool children.Am J Clin Nutr2010;92: 1257–1264. 2 Cunningham SA, Kramer MR, Narayan K. Incidence of childhood obesity in the
United States.N Engl J Med2014;370: 401–409.
3 Dabelea D, Hanson RL, Lindsay RS, Pettitt DJ, Imperatore G, Gabir MMet al.
Intrauterine exposure to diabetes conveys risks for type 2 diabetes and obesity: a study of discordant sibships.Diabetes2000;49: 2208–2211.
4 Brisbois TD, Farmer AP, McCargar LJ. Early markers of adult obesity: a review.Obes Rev 2012;13: 347–367.
5 Monasta L, Batty GD, Cattaneo A, Lutje V, Ronfani L, Van Lenthe FJet al.Early-life determinants of overweight and obesity: a review of systematic reviews.Obes Rev
2010;11: 695–708.
6 Araujo de Franca GV, Restrepo-Mendez MC, Loret de Mola C, Victora CG. Size at birth and abdominal adiposity in adults: a systematic review and meta-analysis.
Obes Rev2014;15: 77–91.
7 Yu ZB, Han SP, Zhu GZ, Zhu C, Wang XJ, Cao XGet al.Birth weight and subsequent risk of obesity: a systematic review and meta-analysis.Obes Rev2011;12: 525–542. 8 Schellong K, Schulz S, Harder T, Plagemann A. Birth weight and long-term over-weight risk: systematic review and a meta-analysis including 643,902 persons from 66 studies and 26 countries globally.PLoS One2012;7: e47776. 9 Dunger DB, Ong KK. Babies born small for gestational age: insulin sensitivity and
growth hormone treatment.Hormone Res2005;64(Suppl 3): 58–65.
10 Newby PK, Dickman PW, Adami HO, Wolk A. Early anthropometric measures and reproductive factors as predictors of body mass index and obesity among older women.Int J Obes (2005)2005;29: 1084–1092.
11 Tian JY, Cheng Q, Song XM, Li G, Jiang GX, Gu YYet al.Birth weight and risk of type 2 diabetes, abdominal obesity and hypertension among Chinese adults.Eur J Endocrinol2006;155: 601–607.
12 Garnett SP, Cowell CT, Baur LA, Fay RA, Lee J, Coakley Jet al.Abdominal fat and birth size in healthy prepubertal children.Int J Obes Relat Metab Disord2001;25: 1667–1673.
13 Singhal A, Wells J, Cole TJ, Fewtrell M, Lucas A. Programming of lean body mass: a link between birth weight, obesity, and cardiovascular disease?.Am J Clin Nutr
2003;77: 726–730.
14 Kahn HS, Narayan KM, Williamson DF, Valdez R. Relation of birth weight to lean and fat thigh tissue in young men.Int J Obes Relat Metab Disord2000;24: 667–672. 15 Elia M, Betts P, Jackson DM, Mulligan J. Fetal programming of body dimensions
and percentage body fat measured in prepubertal children with a 4-component model of body composition, dual-energy X-ray absorptiometry, deuterium dilution, densitometry, and skinfold thicknesses.Am J Clin Nutr2007;86: 618–624. 16 Okosun IS, Liao Y, Rotimi CN, Dever GE, Cooper RS. Impact of birth weight on
ethnic variations in subcutaneous and central adiposity in American children aged 5-11 years. A study from the Third National Health and Nutrition Examination Survey.Int J Obes Relat Metab Disord2000;24: 479–484. 17 Barker M, Robinson S, Osmond C, Barker DJ. Birth weight and body fat distribution
in adolescent girls.Arch Dis Child1997;77: 381–383.
18 Malina RM, Katzmarzyk PT, Beunen G. Birth weight and its relationship to size attained and relative fat distribution at 7 to 12 years of age.Obes Res1996;4: 385–390.
19 Baird JF, Fisher D, Lucas P, Kleijnen J, Roberts H, Law C. Being big or growing fast: systematic review of size and growth in infancy and later obesity.BMJ (Clin Res Ed)
2005;331: 929.
20 Monteiro PO, Victora CG. Rapid growth in infancy and childhood and obesity in later life—a systematic review.Obes Rev2005;6: 143–154.
21 Sacco MRDC NP, Euclydes VLV, Souza JM, Rondo PHC. Birth weight, rapid weight gain in infancy and markers of overweight and obesity in childhood.Eur J Clin Nutr2013;67: 1147–1153.
22 Hitze BB-W A, Plachta-Danielzik S, Bielfeldt F, Hermanussen M, Muller MJ. Long-term effects of rapid weight gain in children, adolescents and young adults with appropriate birth weight for gestational age: The Kiel Obesity Prevention Study.Acta Paediatr 2010;99: 256–262.
23 Karaolis-Danckert NB, Buyken AE, Bolzenius K, Perim de Faria C, Lentze MJ, Kroke A. Rapid growth among term children whose birth weight was appropriate for gestational age has a longer lasting effect on body fat percentage than on body mass index.Am J Clin Nutr2006;84: 1449–1455.
24 Ong KK, Ahmed ML, Emmett PM, Preece MA, Dunger DB. Association between postnatal catch-up growth and obesity in childhood: prospective cohort study.
BMJ (Clin Res Ed)2000;320: 967–971.
25 Chrestani MA, Santos IS, Horta BL, Dumith SC, de Oliveira Dode MA. Associated factors for accelerated growth in childhood: a systematic review.Matern Child Health J2013;17: 512–519.
26 Gluckman PD, Hanson MA, Beedle AS. Early life events and their consequences for later disease: a life history and evolutionary perspective.Am J Hum Biol2007;19: 1–19.
27 Gluckman PD, Hanson MA. Developmental and epigenetic pathways to obesity: an evolutionary-developmental perspective.Int J Obes (2005)2008;32(Suppl 7): S62–S71.
28 Inadera H. Developmental origins of obesity and type 2 diabetes: molecular aspects and role of chemicals.Env Health Prev Med2013;18: 185–197. 29 Wells G, Shea B, O’connell D, Peterson J, Welch V, Losos Met al.The
Newcastle-Ottawa Scale (NOS) for assessing the quality of nonrandomised studies in meta-analyses. 2000. Available at: http://www.ohri.ca/programs/clinical_epidemiology/ oxford.asp (accessed on 21 December 2016).
30 Wong WCW, Cheung CSK, Hart GJ. Development of a quality assessment tool for systematic reviews of observational studies (QATSO) of HIV prevalence in men having sex with men and associated risk behaviours.Emerg Themes Epidemiol
2008;5: 23.
31 Chomtho S, Wells JC, Williams JE, Davies PS, Lucas A, Fewtrell MS. Infant growth and later body composition: evidence from the 4-component model.Am J Clin Nutr2008;87: 1776–1784.
32 Durmus B, Mook-Kanamori DO, Holzhauer S, Hofman A, van der Beek EM, Boehm Get al.Growth in foetal life and infancy is associated with abdominal adiposity at the age of 2 years: the generation R study.Clin Endocrinol2010;72: 633–640. 33 Ekelund U, Ong K, Linne Y, Neovius M, Brage S, Dunger DBet al.Upward weight
percentile crossing in infancy and early childhood independently predicts fat mass in young adults: the Stockholm Weight Development Study (SWEDES).Am J Clin Nutr2006;83: 324–330.
34 Eriksson M, Tynelius P, Rasmussen F. Associations of birthweight and infant growth with body composition at age 1—the COMPASS study.Paediatr Perinat Epidemiol2008;22: 379–388.
35 Euser AM, Finken MJ, Keijzer-Veen MG, Hille ET, Wit JM, Dekker FW. Associations between prenatal and infancy weight gain and BMI, fat mass, and fat distribution in young adulthood: a prospective cohort study in males and females born very preterm.Am J Clin Nutr2005;81: 480–487.
36 Gishti O, Gaillard R, Manniesing R, Abrahamse-Berkeveld M, van der Beek EM, Heppe DHet al.Fetal and infant growth patterns associated with total and abdominal fat distribution in school-age children.J Clin Endocrinol Metab2014;
99: 2557–2566.
37 Gomez-Lopez L, Van Hulst A, Barnett TA, Roy-Gagnon MH, Tremblay A, O'Loughlin J
et al.Does parental body mass index status modify the associations among birth weight, early growth and childhood adiposity?Paediatr Child Health2013;18: e2–e9. 38 Goncalves FC, Amorim RJ, Eickmann SH, Lira PI, Lima MC. The influence of low birth weight body proportionality and postnatal weight gain on anthropometric measures of 8-year-old children: a cohort study in Northeast Brazil.Eur J Clin Nutr
2014;68: 876–881.
39 Holzhauer S, Hokken Koelega AC, Ridder M, Hofman A, Moll HA, Steegers EAet al.
Effect of birth weight and postnatal weight gain on body composition in early infancy: The Generation R Study.Early Hum Dev2009;85: 285–290.
40 Hui LL, Schooling CM, Leung SS, Mak KH, Ho LM, Lam THet al.Birth weight, infant growth, and childhood body mass index: Hong Kong's children of 1997 birth cohort.Arch Pediatr Adolesc Med2008;162: 212–218.
41 Jones-Smith JC, Fernald LC, Neufeld LM. Birth size and accelerated growth during infancy are associated with increased odds of childhood overweight in Mexican children.J Am Dietetic Assoc2007;107: 2061–2069.
42 Jones-Smith JC, Neufeld LM, Laraia B, Ramakrishnan U, Garcia-Guerra A, Fernald LC. Early life growth trajectories and future risk for overweight.Nutr Diabetes2013;3: e60.
43 Kramer MS, Martin RM, Bogdanovich N, Vilchuk K, Dahhou M, Oken E. Is restricted fetal growth associated with later adiposity? Observational analysis of a randomized trial. Am J Clin Nutr2014;100: 176–181.
44 Monteiro PO, Victora CG, Barros FC, Monteiro LM. Birth size, early childhood growth, and adolescent obesity in a Brazilian birth cohort.Int J Obes Relat Metab Disord2003;27: 1274–1282.
45 Stettler N, Bovet P, Shamlaye H, Zemel BS, Stallings VA, Paccaud F. Prevalence and risk factors for overweight and obesity in children from Seychelles, a country in rapid transition: the importance of early growth.Int J Obes Relat Metab Disord
2002a;26: 214–219.
46 Stettler N, Zemel BS, Kumanyika S, Stallings VA. Infant weight gain and childhood overweight status in a multicenter, cohort study.Pediatrics2002b;109: 194–199. 47 Taal HR, Vd Heijden AJ, Steegers EA, Hofman A, Jaddoe VW. Small and large size for gestational age at birth, infant growth, and childhood overweight.Obesity (Silver Spring, MD)2013;21: 1261–1268.
48 Taveras EM, Rifas-Shiman SL, Belfort MB, Kleinman KP, Oken E, Gillman MW. Weight status in thefirst 6 months of life and obesity at 3 years of age.Pediatrics
2009;123: 1177–1183.
49 Williams RL, Creasy RK, Cunningham GC, Hawes WE, Norris FD, Tashiro M. Fetal growth and perinatal viability in California.Obstet Gynecol1982;59: 624–632. 50 Freedman DS, Sherry B. The validity of BMI as an indicator of body fatness and risk
among children.Pediatrics2009;124(Suppl 1): S23–S34.
51 Parsons TJ, Power C, Logan S, Summerbell CD. Childhood predictors of adult obesity: a systematic review.Int J Obes Relat Metab Disord1999; 23(Suppl 8): S1–107.
52 Garite TJ, Clark R, Thorp JA. Intrauterine growth restriction increases morbidity and mortality among premature neonates.Am J Obstet Gynecol2004;191: 481–487. 53 Cole TJ, Donaldson MD, Ben-Shlomo Y. SITAR—a useful instrument for growth
curve analysis.Int J Epidemiol2010;39: 1558–1566.
54 Pizzi C, Cole TJ, Richiardi L, dos-Santos-Silva I, Corvalan C, De Stavola B. Prenatal influences on size, velocity and tempo of infant growth:findings from three contemporary cohorts.PLoS One2014;9: e90291.
55 Giles LC, Whitrow MJ, Davies MJ, Davies CE, Rumbold AR, Moore VM. Growth trajectories in early childhood, their relationship with antenatal and postnatal factors, and development of obesity by age 9 years: results from an Australian birth cohort study.Int J Obes (2005)2015;39: 1049–1056.
56 Gaskins RB, LaGasse LL, Liu J, Shankaran S, Lester BM, Bada HSet al.Small for gestational age and higher birth weight predict childhood obesity in preterm infants.Am J Perinatol2010;27: 721–730.
57 Woo Baidal JA, Locks LM, Cheng ER, Blake-Lamb TL, Perkins ME, Taveras EM. Risk factors for childhood obesity in thefirst 1,000 days: a systematic review.Am J Prev Med2016;50: 761–779.
APPENDIX
Table A1. Correlations between prenatal growth and postnatal growtha
Change in weight (kg)
Rate of weight gain (g/month)
Weight z-score
Change in weight s.d. score
Change in weight z-score tertiles
Change in weight for length z-score quartiles
Change in weight z-score
40.67
Change in
weight-for-age z-score40.67
Change in BMIz-score
Δkg/m2per
year Study
BW (g or kg) Stettler
et al.46 –
b
–c
–d
(33) (38) (42) (46)
BW s.d. score;z-score
–e – f
NR
–g
(31) (34) (35) (39)
BW for lengthz-score +h (48)
BW (tertiles)
–i
NR (32)
(40)
BW (quartiles) NR (45)
BMIz-score NR
–d
(37) (41)
Size for gestational age NR
–j NR
(36) (43) (47)
IUGR NR (44)
Abbreviations: BMI, body mass index; BW, birthweight; g, grams; IUGR, intrauterine growth restricted; kg, kilograms; r, correlation coefficient; s.d., standard
deviation;Δ, change.aThis table summarizes results from articles that reported the correlation between prenatal growth and postnatal growth. Symbols
indicate the following correlations between prenatal growth and postnatal growth were measured: positive (+), negative (−), relationship not reported (NR).
Blank cells indicate the correlation was not assessed.br=−0.48,Po0.001.cSignificantly higher proportion of LBW children experienced rapid weight gain than
children of appropriate BW (LBW stunted: 51.9%, LBW wasted: 75.0%, ABW: 28.0%,Po0.001). dResults not shown. er=−0.53.fLower BW SDS inversely
correlated with change in weight SDS: 0–3 wksr=−0.36*; 3–6 wks:r=−0.19**; 6–12 wks:r=−0.12; 3–6 mos:r=−0.16**; 6–12 mos:r=−0.07; *Po0.001,
**Po0.05.g0–6 wks:r=−0.35; 0–6 mos:r=−0.56,Po0.001.hChildren with higher 6 mos WFLz-score more likely to have higher birth WFLz-score,P=0.06.
i
Lowest BW tertile had highest percentage of fast growers 0–3 months (53.3% vs 14.5% for highest BW tertile).jSGA children had greater change in weight SDS
from birth to 3 months than AGA (1.12 (0.96, 1.29),Po0.001); LGA children experienced a decrease in weight SDS from birth to 3 months compared with AGA
children (−1.25 (−1.41,−1.10),Po0.001).