Peptide-Based Biosensors and Light-Activatable Proteins: Tools for Studying Cell Signaling and Developing Cancer Diagnosis
Weichen Xu
A dissertation submitted to the faculty of the University of North Carolina at Chapel Hill in partial fulfillment of the requirements for the degree of Doctor of Philosophy in the UNC Eshelman School of Pharmacy (Division of Chemical Biology and Medicinal Chemistry).
Chapel Hill 2012
Approved by:
ii © 2012 Weichen Xu
iii ABSTRACT
WEICHEN XU: Peptide-Based Biosensors and Light-Activatable Proteins: Tools for Studying Cell Signaling and Developing Cancer Diagnosis
(Under the direction of David Lawrence)
iv
cAMP-dependent protein kinase (PKA) via active site-directed peptide-based affinity labeling. This modified PKA displays minimum catalytic activity and low fluorescence. Light illumination restored enzymatic activity and induced stress fibers lose in living cells. A 6.2-fold fluorescence enhancement was also observed.
v Dedication
I dedicate this work to my parents Mr. Xiaodong Xu and Ms. Li Li, and my fiancé Dr. Zhancheng Zhang, who are always there to help, support, inspire and love me through the
vi
Acknowledgements
I give my truehearted thanks to my advisor, Dr. David Lawrence, for his scientific guidance throughout my graduate study and research. This dissertation would not have been possible without his support. His insight, determination, critical thinking and positive attitude all inspired me to dedicate myself to hard work and becoming a true scientist. I thank him for nurturing me to become a proud chemical biologist. I have received great inheritance from the Lawrence laboratory and hope to pass it on in my future life.
I am also very grateful to Dr. Nancy Allbritton. Her broad knowledge in biology and analytical chemistry, her great attention to details and her cheerful encouragement have helped me through some hard times and eventually accomplished the project that I am so proud of. I also owe my deepest gratitude to Dr. Hsien-ming Lee, not only for his invaluable help and scientific inspirations, but for his professional skills and close mentorship. Dr. Lee is not only a great mentor to me, but also a close friend. I will never forget those tough but happy days when we tried to finish the project together. I also want to thank my committee members Dr. Michael Jarstfer, Dr. Qisheng Zhang, and Dr. Klaus Hahn. They have provided me with wonderful ideas for my projects and helped me finish my Ph.D training smoothly.
vii
I thank Dr. Qunzhao Wang for his help and suggestion in peptide chemistry. I thank Dr. Haishan Lee for providing invaluable scientific training for me during my rotation. I want to thank Dr. Melanie Priestman for sharing her comprehensive knowledge in biology and microscopy, her help in preparing this dissertation, and also her friendship. I also thank Dr. Jennifer Shell, Dr. Robert Hughs, Dr. Vyas Sharma, and Dr. Thomas Shell for their help with my dissertation and scientific discussions. I want to thank Weston Smith, Luong Nguyen, Finith Jernigan, Nate Oien, Collin O’Banion and Ana Kamilaris for their help with my research projects. I want to give my special thanks to Danielle Cook. She is one of my truest friends. She has inspired me to work hard, to be a true scientist and to enjoy American life.
I would also like to thank my collaborators and friends in the Allbritton Lab: Angie Proctor, Ryan Phillips, Abby Turner and Jazz Dickenson. I want to give my special thanks to Angie. She is the most organized, detail oriented and lovable person I have ever met. I have learned so much from her. She always selfishlessly give me so much help not only on my project and dissertation, but also in life.
Dr. Lee Graves of the Department of Pharmacology is not a member of my thesis committee, but he has nonetheless provided indispensable help for part of the work presented in this dissertation. I thank him for his guidance and help.
viii Preface
Chapter 2 and chapter 3 represent unpublished research that was designed and performed by myself. Chapter 4 represents work done in collaboration with Dr. Hsien-ming Lee. The paper was published previous to writing this dissertation with the following citation:
Lee, H-M., Xu, W., and Lawrence, D.S. (2011). Construction of a Photoactivatable
Profluorescent Enzyme Via Propinquity Labeling. J. Am. Chem. Soc. 133, 2331–2333.
Permission to include the article in its entirety in a Ph.D dissertation was retained from American Chemical Society as explained at
http://pubs.acs.org.libproxy.lib.unc.edu/page/copyright/permissions.html
ix
Table of Contents
Abstract ... iii
Dedication ... v
Acknowledgements ... vi
Preface ...viii
Table of Contents ... ix
List of Tables ... xi
List of Schemes ... xii
List of Figures ...xiii
List of Abbreviations ... xvi
Chapter I. BACKGROUND AND SIGNIFICANCE ... 1
STRUCTURE AND REGULATION OF SRC FAMILY KINASES ... 1
SRC FAMILY KINASE SIGNALING ... 7
SRC FAMILY KINASES IN T-CELL SIGNALING... 12
SENSING KINASE ACTIVITY ... 15
II. SRC KINASE ACTIVITY PROFILING IN PROSTATE CANCER: A CORRELATION WITH CANCER CELL INVASIVENESS ... 24
MATERIALS AND METHODS ... 27
RESULTS AND DISCUSSION ... 37
x
III. UNRAVELING THE ROLES OF FYN AND LCK IN TCR SIGNALING
BY A LIGHT-DEACTIVATABLE FYN KINASE INHIBITOR ... 84
MATERIALS AND METHODS ... 88
RESULTS AND DISCUSSION ... 96
CONCLUSIONS ... 116
IV. CONSTRUCTION OF A PHOTOACTIVATABLE PROFLUORESCENT ENZYME VIA PROPINQUITY LABELING ... 118
MATERIALS AND METHODS ... 122
RESULTS AND DISCUSSION ... 129
CONCLUSIONS ... 143
xi List of Tables
Table 1.1 Cell type specific expression of Src family kinases. ... 2
Table 1.2 Signaling molecules associated with Lck and FynT in T cells. ... 12
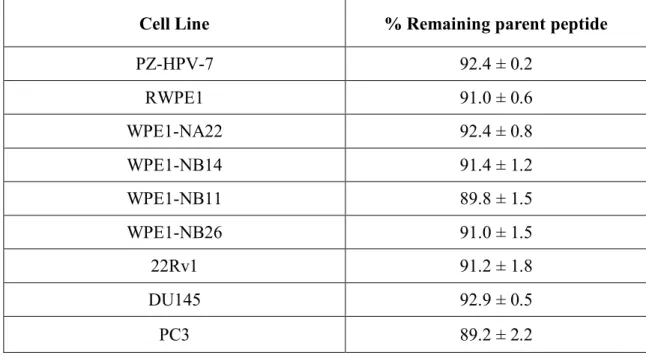
Table 2.1 Stability of the Src peptide sensor in prostate cell lysates. ... 43
Table 2.2 Peptide library for identifying selective Src substrate against EGFR. ... 81
Table 3.1 IC50 and selectivity of peptide inhibitors for Src, Fyn, Lck and Blk. ... 99
xii List of Schemes
xiii List of Figures
Figure 1.1 Domain structure of Src family kinases. ... 3
Figure 1.2 The structures of inactive and active Src family kinases. ... 4
Figure 1.3 The activation of Src family kinases. ... 5
Figure 1.4 Role of Src during cell migration. ... 9
Figure 1.5 Src mediate EGF- and HGF-induced epithelial-mesenchymal transition and cell migration and invasion. ... 10
Figure 1.6 Lck and FynT recruitment and activation upon TCR stimulation. ... 13
Figure 1.7 FRET-based kinase sensor based on phosphorylation induced conformational change. ... 15
Figure 1.8 Different approaches to construct “caged” proteins. ... 23
Figure 2.1 CE-LIF separation and visualization of the Src peptide substrate 1 and its chemically synthesized phosphorylated counterpart 2. ... 40
Figure 2.2 Src kinase-catalyzed phosphorylation of the Src substrate as a function of time. ... 41
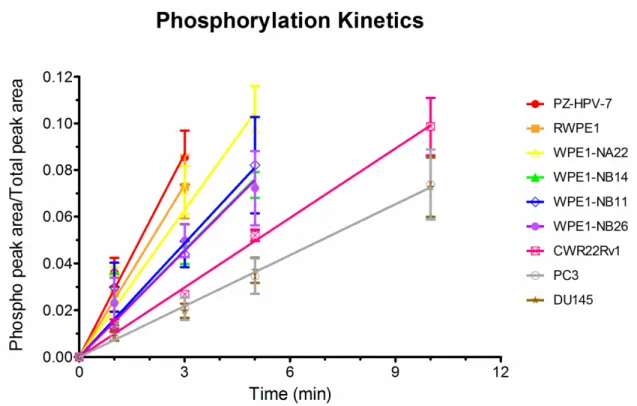
Figure 2.3 Phosphorylation kinetics of the Src substrate by lysates from nine prostate cell lines. ... 42
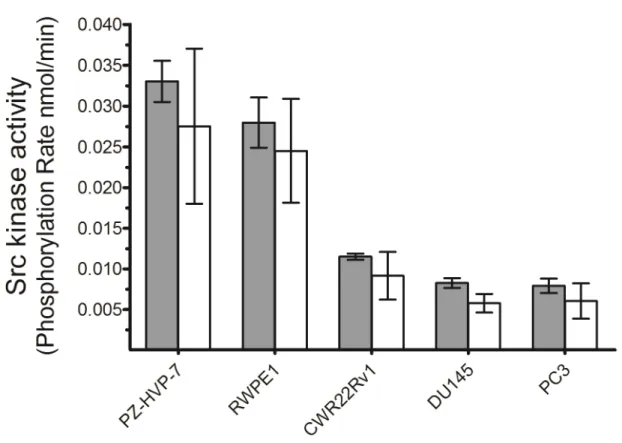
Figure 2.4 Src kinase activities of PZ-HPV-7, RWPE1, CWR22Rv1, DU145 and PC3 prostate cell lines. ... 46
Figure 2.5 Immunodepletion of Src kinase from prostate cell lysates. ... 48
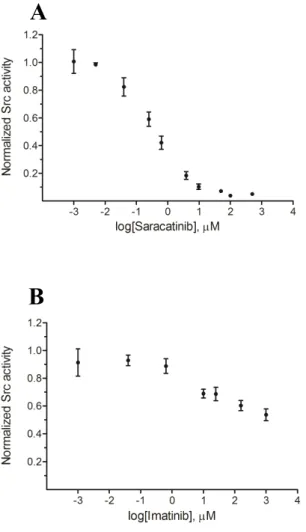
Figure 2.6 Src activity in DU145 lysates as a function of inhibitor concentration. ... 49
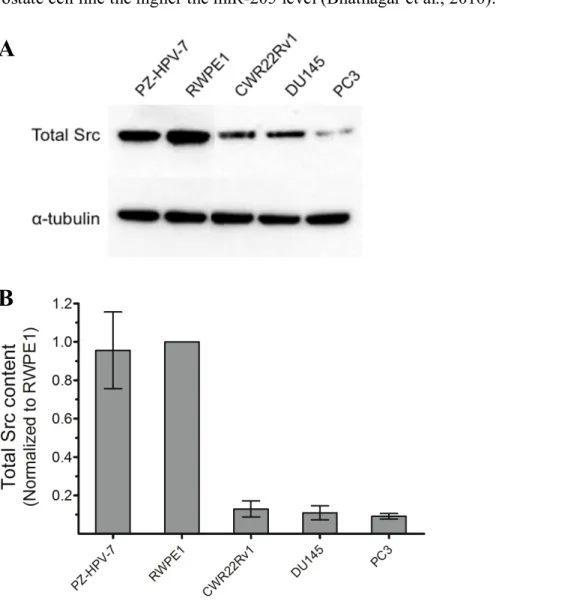
Figure 2.7 Src protein levels in PZ-HVP-7, RWPE1, DU145, PC3 and CWR22Rv1 prostate cell lines. ... 51
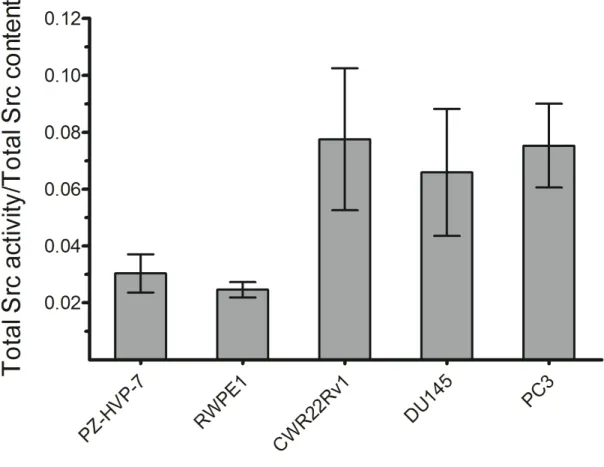
Figure 2.8 Fractional Src kinase activity in PZ-HVP-7, RWPE1, DU145, PC3 and CWR22Rv1 prostate cell lines. ... 52
Figure 2.9 Phosphorylation status of Src in PZ-HVP-7, RWPE1, DU145, PC3 and CWR22Rv1 prostate cell lines. ... 55
Figure 2.10 Total Src kinase activity in prostate cancer progression model cell lines. ... 57
xiv
Figure 2.12 Fractional Src kinase activity in prostate cancer progression model cell
lines. ... 59
Figure 2.13 Phosphorylation of Src in prostate cancer progression model cell lines. ... 60
Figure 2.14 Invasiveness of prostate cell lines assessed by Matrigel invasion assay. ... 62
Figure 2.15 Single cell analysis of Src kinase activity in DU145 cells by CE. ... 65
Figure 2.16 Uptake of peptide 3 by prostate cells. ... 69
Figure 2.17 CE-LIF separation and visualization of Src sensor and Akt sensor. ... 71
Figure 2.18 Kinase-catalyzed phosphorylation of Src and Akt sensors as a function of time as assessed by CE-LIF. ... 73
Figure 2.19 Phosphorylation and degradation of Src sensor and Akt sensor in DU145 and PC3 cell lysate. ... 76
Figure 2.20 Radiolabeled ATP kinase assay. ... 77
Figure 2.21 Phosphorylation of Src sensor and EGFR sensor by Src or EGFR kinase. .. 80
Figure 3.1 A light-deactivatable Src family kinase inhibitor. ... 87
Figure 3.2 Fluorescence microscopy imaging of peptide 26 uptake by Jurkat T cell. . 105
Figure 3.3 Immobilized peptide 25 selectively pulls-down Fyn over Lck from Jurkat cell lysate. ... 109
Figure 3.4 TCR induced phosphorylation of Pyk2 and LAT requires Src family kinase activity. ... 111
Figure 3.5 Effect of Lck selective inhibitor damnacanthal treatment on Pyk2 and LAT phosphorylation. ... 114
Figure 3.6 Effect of the cell permeable Fyn selective inhibitor 26 treatment on Pyk2 and LAT phosphorylation... 115
Figure 4.1 The uncage-and-report design of a caged profluorescent PKA. ... 121
Figure 4.2 Design of the caged profluorescent PKA. ... 130
Figure 4.3 Structure of the caging agent 28. ... 131
Figure 4.4 Caging agent 28 labeling PKA reaction is driven by protein-ligand recognition. ... 132
xv
Figure 4.6 Actin staining of untreated and CPT-cAMP-treated REF52 cells. ... 137
Figure 4.7 Morphology change in wtPKA injected REF52 cell. ... 138
Figure 4.8 Stress fibers in photolyzed non-microinjected cells were retained. ... 139
Figure 4.9 Microinjected REF52 cells in the absence of illumination. ... 140
Figure 4.10 Photolysis of caged PKA induced stress fiber disappearance and fluorescence increase... 141
xvi
List of Abbreviations ACN – Acetonitrile
ADP – Adenosine 5’-diphosphate
Ahx – L-2-aminohexanoic acid
Ala – Alanine
Aloc – Allyloxycarbonyl
AM – Acetoxymethyl ester
AML – Acute myeloid leukemia
ANP linker – 3-Nα-Fmoc-amino-3-(2-nitrophenyl)propionic acid
APC – Antigen presenting cell
AR – Androgen receptor
ATP – Adenosine 5’-triphosphate
Ba – 3-Methoxy-4-nitrobenzoic acid
BGP – β-glycerophosphate
Bis-Tris – Bis(2-hydroxyethyl)amino-tris(hydroxymethyl)methane
Blk – B lymphocyte kinase
Boc – t-Butyloxycarbonyl
xvii BSA – Bovine serum albumin
C – Cysteine
C subunit – Catalytic subunit
CaMKII – Ca2+/calmodulin-dependent protein kinase II
cAMP – Cyclic adenosine monophosphate
CaP – Prostate cancer
CD4 – Cluster of differentiation 4
CD45 – Lymphocyte common antigen
CD8 – Cluster of differentiation 8
CE-LIF – Capillary electrophoresis-laser induced fluorescence
CFDA-SE – Carboxyfluorescein diacetate-succinimidyl ester
CPM – Counts per minute
CPP – Cell penetrating peptide
CPT-cAMP – 8-(4-Chlorophenylthio) adenosine-3’,5’-cyclic monophosphorothioate
CRY2 – Cryptochrome 2
CSK – C-terminal Src kinase
xviii Cys – Cysteine
D – Aspartic acid
Dap – 2,3-Diaminopropionic Acid
DCM – Dichloromethane
DHFR – Dihydrofolate reductase
DIC – N,N’-Diisopropylcarbodiimide
DIPEA – N,N-Diisopropylethylamine
DMEM – Dulbecco's modified eagle medium
DMF – N,N-Dimethylformamide
DNA – Deoxyribonucleic acid
Dock180 – Dedicator of cytokinesis
DPBS – Dulbecco's phosphate buffered saline
DTT – Dithiothreitol
E – Glutamic acid
ECB – Extracellular buffer
ECL – Enhanced chemiluminescence
xix EDTA – Ethylenediaminetetraacetic acid
EGF – Epidermal growth factor
EGFR – Epidermal growth factor receptor
ELMO1 – Engulfment and cell motility protein 1
Em – Emission
EMEM – Eagle's minimal essential medium
EMT – Epithelial-mesenchymal transition
EPL – Expressed protein ligation
eq (equiv) – Equivalent
ER – Estrogen receptor
ERK – Extracellular signal-regulated kinase
ESI-MS – electrospray ionization-mass spectrometry
Ex – Excitation
F – Phenylalanine
FAK – Focal adhesion kinase
FAM – Carboxyfluorescein
xx FCS – Fetal calf serum
FGFR – Fibroblast growth factor receptor
FITC – Fluorescein isothiocyanate
Fmoc – N-9-Fluorenylmethoxycarbonyl
FRET – Fluorescence resonance energy transfer
FynT – Fyn kinase T cell specific isoform
G – Glycine
Glu – Glutamic acid
Gly – Glycine
H – Histidine
HBSS – Hank's balanced salt solution
HCTU – O-(1H-6-Chlorobenzotriazole-1-yl)-1,1,3,3-tetramethyluronium hexafluorophosphate
HEPES – 4-(2-hydroxyethyl)-1-piperazineethanesulfonic acid
HGF – Hepatocyte growth factor
HGFR – Hepatocyte growth factor receptor
Hna – 1,4,5,6,7,7-hexachloro-5-norbornene-2,3-dicarboxylic acid
xxi HPLC – High-performance liquid chromatography
HRP – Horseradish peroxidase
I – Isoleucine
IGFR – Insulin-like growth factor
IgG – Immunoglobulin G
IL-2 – Interleukin-2
IL-8 – Interleukin-8
Ile – Isoleucine
IPA – Isopropyl alcohol
IPTG – Isopropyl-β-D-thiogalactoside
ITAMs – Immunoreceptor tyrosine-based activation motifs
ivDde – 4,4-dimethyl-2,6-dioxocyclohex-1-ylidene
JNK – Jun N-terminal kinase
K – Lysine
K-SFM – Keratinocyte-serum free medium
LAT – Linker for activation of T cells
xxii LOV – Light-oxygen-voltage
Lys – Lysine
MALDI-TOF – Matrix assisted laser desorption/ionization- time of flight
MAPK – Mitogen-activated protein kinase
Met – Methionine
MHC – Major histocompatibility complex
miR – Micro RNA
MK2 – MAP kinase-activated protein kinase 2
MMP – Metalloproteinases
MOPS – 3-(N-Morpholino) propanesulfonic acid
MS/MS – Tandem mass spectrometry
N – Asparagine
Nd:YAG – Neodymium-doped yttrium aluminium garnet
NHS – N-Hydroxysuccinimide
NK cells – Natural killer cells
NMM – N-methylmorpholine
xxiii OBzl – O-Benzyl
Orn – Ornithine
OtBu – t-butyl ester
P – Proline
P/S – Penicillin/Streptomycin
p130Cas – Crk-associated substrate
p190RhoGAP – Rho GTPase activating protein
PAG – Phosphoprotein associated with GEMs
pbf – 2,2,4,6,7-pentamethyl-dihydrobenzofuran-5-sulfonyl
PBS – Phosphate buffered saline
PBST – Phosphate buffered saline with Tween 20
PDGF – Platelet-derived growth factor
PDGFR – Platelet-derived growth factor receptor
PDMS – Polydimethyl siloxane
PEG – Polyethylene glycol
PEP – PEST domain-enriched tyrosine phosphatase
xxiv PET – Polyethylene terephathalate
PhyB – Phytochrome B
PI3K – Phosphoinositide 3-kinase
PKA – Protein kinase A or cAMP-dependent protein kinase
PKC – Protein kinase C
PKG – Protein kinase G or cGMP-dependent protein kinase
PKI – PKA inhibitor
PL – Photo linker
PR – Progesterone receptor
PTK – Protein tyrosine kinase
PTP – Protein tyrosine phosphatase
pTyr – Phosphorylated tyrosine
PVDF – Polyvinylidene fluoride
pY – Phosphorylated tyrosine
PyBop – Benzotriazole-1-yl-oxy-tris-pyrrolidino-phosphonium hexafluorophosphate
Pyk2 – Proline-rich tyrosine kinase 2
xxv Rac1 – Ras-related C3 botulinum toxin substrate 1
REF – Rat embryo fibroblasts
RFU – Relative fluorescence units
RT – Room temperature
RTK – Receptor tyrosine kinase
SDS – Sodium dodecyl sulfate
SDS-PAGE – Sodium dodecyl sulfate-polyacrylamide gel electrophoresis
SEM – Standard error of the mean
Ser – Serine
SFK – Src family kinase
SH – Src Homology
SHP-1 – SH2 domain-containing phosphatase 1
SLP-76 – SH2 domain-containing leukocyte protein of 76 kDa
T – Threonine
T-ALL – T-adult lymphoblastic leukemia
TAMRA – Carboxytetramethylrhodamine
xxvi TBS – Tris Buffered Saline
tBu – t-Butyl
TCR – T cell receptor
TFA – Trifluoroacetic acid
Thr – Threonine
TIS – Triisopropylsilane
TrpR – Tryptophan repressor
Trt – Trityl
Tyr – Tyrosine
UV – Ultraviolet
Val – Valine
VEGFR – Vascular endothelial growth factor receptor
WASP – Wiskott–Aldrich syndrome protein
wt – Wild type
ZAP-70 – Zeta-chain-associated protein kinase 70
βA – 3-aminopropanoic acid
CHAPTER I
BACKGROUND AND SIGNIFICANCE
Structure and Regulation of Src Family Kinases
Src kinase family members. Protein tyrosine kinases (PTKs) play central roles in cell signaling pathways by catalyzing phosphoryl transfer from ATP to the tyrosine residues on the protein substrates. Based on sequence homology, the 90 identified tyrosine kinases are divided into the receptor PTK family (58 members) and the non-receptor PTK family (32 members). Src kinase family is one of the 10 subfamilies further divided from the non-receptor PTK family, and has attracted much attention (Robinson et al., 2000). To date, there are over 10,000 papers published that involve the study of Src family kinases (SFKs). The 9 members of Src kinase family are: Src, Fyn, Lck, Hck, Blk, Lyn, Fgr, Yes, and Yrk. Members of this family are expressed in different cell types as listed in Table 1.1 (Parsons and Parsons, 2004; Benati and Baldari, 2008).
Src kinase
family member Pattern of expression Isoforms
Src Ubiquitous Neuron specific isoforms
Yes Ubiquitous
Yrk Ubiquitous
Fyn Ubiquitous T cell specific isoform (FynT)
Lck T cells, NK cells, brain
Blk B cells
2 Fgr B cells, myeloid cells
Hck Myeloid cells Two different translational starts (Parsons and Parsons, 2004; Benati and Baldari, 2008)
Table 1.1 Cell type specific expression of Src family kinases.
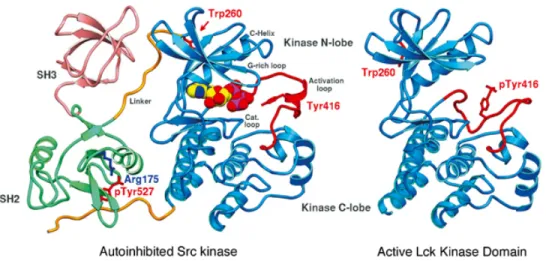
Src family kinase domain structure. SFKs share a conserved multidomain structure that contains SH1 (kinase domain), SH2 (phosphotyrosine containing sequence binding domain), SH3 (proline-rich sequence binding domain) and SH4 (membrane targeting region) domains. SFK also has a divergent “unique” domain between SH4 and SH3 domains (Fig. 1.1) (Boggon and Eck, 2004). The kinase domain (SH1) is composed of the N-terminal lobe and the C-terminal lobe. ATP binding and phosphoryl transfer occur at the cleft between these two lobes. The C-terminal lobe contains a peptide substrate binding site and an activation loop, where the critical regulatory tyrosine residue (Tyr-416 in Src) resides (Xu et al., 1997).
The SH2 domain has a highly conserved recognition pocket for phosphorylated tyrosine residue (pTyr), and a more divergent hydrophobic residue binding pocket that specifically recognize different pTyr containing sequences. The preferred SH2 domain binding sequence for SFKs is pTyr-Glu-Glu-Ile (Eck et al., 1993). SH2 domains serve as protein-protein recognition and interaction modules, mediating important regulatory events in cell signaling pathways.
3
proline-rich sequences (Jia et al., 2005; Li, 2005; Kaneko et al., 2008), suggesting a much more diverse role of SH3 domain in cell signal transduction.
The N-terminal membrane localization region (SH4) in SFKs contains a consensus Met-Gly-Cys sequence for myristoylation and palmitoylation. The lipid modification is necessary for the localization of SFKs to the plasma membrane (Resh, 1999). The “unique” domain is different for each Src family members, but its function for most members is still unclear. However, the unique domain of Lck kinase has been shown to contain a “CxxC” motif that mediates interactions of Lck with T cell coreceptors CD4 and CD8 (Shaw et al., 1990; Turner et al., 1990), and also regulates selection of Lck specific substrates and biological functions of T cells (Carrera et al., 1995).
(Boggon and Eck, 2004; Benati and Baldari, 2008)
4
Src family kinase activity regulation. The widely accepted model of SFKs activity regulation is based on the phosphorylation and dephosphorylation of two critical residues, tyrosine 416 and 527 (p60Src, will be used in this chapter to indicate the equivalent sites in SFKs). Tyr-416 is located in the activation loop of kinase domain, and Tyr-527 is located in the terminal tail. Phosphorylation of Tyr-527 is catalyzed by C-terminal Src kinase (CSK). The crystal structures (Fig. 1.2) of the autoinhibited Src kinase showed that pTyr-527 docks into the SH2 domain phosphotyrosine recognition pocket, which facilitates the SH3 domain to form intramolecular interaction with the polyproline-type II helix of the SH1-SH2 linker region and also the N-lobe of kinase domain. As a consequence of the SH3 interaction, the two lobes of the kinase domain are pushed closer, and results in blocking of ATP binding cleft and burying of Tyr-416. Switching to the active conformation is induced either by dephosphorylation of pTyr-527 or SH2 and SH3 domain binding partners, or a combination of the two. As a result, the SFKs employ an “open” conformation, and Tyr-416 becomes available for autophosphorylation (Boggon and Eck, 2004; Benati and Baldari, 2008).
Figure 1.2 The structures of inactive and active Src family kinases.
5
The SFK activity regulation model described above is based on the crystal structures of N-terminal truncated forms of SFKs. Therefore, the position and role of myristoylation and palmitoylation in full-length SFKs is not clear. Resh and co-workers have recently found that myristoylation and membrane association positively regulate Src kinase activity, but render it more susceptible to ubiquitin-mediated degradation than their nonmyristoylated counterpart (Patwardhan and Resh, 2010). This confirmed the previous findings by Hakak et al. that activation of Src increase the extent of polyubiquitination (Hakak and Martin, 1999). However, their study also suggested that membrane binding plays a role in Src activation. They proposed that myristoylation mediates insertion and alignment of Src to lipid bilayers, which may facilitate an optimal conformation for Tyr-416 phosphorylation and kinase activity (Fig. 1.3) (Patwardhan and Resh, 2010).
Figure 1.3 The activation of Src family kinases.
6
7
Src Family Kinase Signaling
Src family kinase signaling in cancers. Src family kinases have been implicated in many types of cancers. In colon cancer, a mutation that results in a C-terminal tail truncated Src kinase was identified, which leads to enhanced kinase activity and cancer metastasis (Irby et al., 1999). However, despite this finding, genetic mutations of SFKs are rarely detected in cancers. The major association of SFKs with cancers is through changes in protein expression, phosphorylation, and enzymatic activity. These changes have been observed in a variety of human malignancies, including prostate cancer, breast cancer, colorectal cancer, lung cancer, pancreatic endocrine tumor and hematologic malignancies (Benati and Baldari, 2008; Kim et al., 2009).
8
The synergistic roles played by EGFR and Src may have particularly important clinical relevance since both tyrosine kinases are frequently overexpressed in breast cancer (Abram and Courtneidge, 2000). Studies have shown that Src tightly associates with activated EGFR and is required for EGFR induced mitogenesis. Overexpression of Src can increase EGF-stimulated DNA synthesis and tumor cell proliferation (Belsches et al., 1997; Kong et al., 2003). Other studies also indicated a role of SFKs in growth factor stimulated DNA synthesis and mitogenesis, although the requirement of SFKs may depend on cell types and the cellular context in the studies (Bromann et al., 2004).
Src signaling in cancer cell migration and invasion. Cancer patients often suffer from metastasized tumors. Much attention has been devoted for developing diagnostics and therapeutics for metastatic cancer. In order for tumor cells to become metastatic, they need to acquire abilities to migrate, degrade the extracellular matrix (ECM), invade the stroma and enter the lymph or vascular system to reach a distant site (Geho et al., 2005). SFKs not only support tumor cell survival and mitogenesis during local and metastatic growth, but have a more profound role in reorganizing actin cell cytoskeleton, disrupting cell-cell and cell-matrix adhesion, altering cell morphology and ultimately promoting cell migration and invasion.
9
domain, promoting Src activation (Huveneers and Danen, 2009). Therefore, Src is recruited and activated at the adhesion and protrusion leading edge during cell migration. Activated Src then recruits and activates the scaffold protein p130Cas, which binds Dock180 and ELMO1 through association with the adaptor protein Crk. The Dock180-ELMO1 complex serves as a guanine-exchange factor to activate Rac1 and induce actin-driven cell protrusions (Huveneers and Danen, 2009). Src also mediate suppression of Rho through phosphorylating p190RhoGAP, which is important for relieving contractile forces during migration. At the cell’s trailing edge, Src recruits ERK/MAPK and calpain, which induces proteolytic cleavage to promote adhesion disassembly and cell-matrix detachment (Fig. 1.4) (Guarino, 2009).
Figure 1.4 Role of Src during cell migration.
10
Src also induces activation of the PI3K/Akt pathway either through direct binding of PI3K to the Src SH3 domain or phosphorylation of PI3K. PI3K plays a central role in cell migration by generating asymmetrical signaling that establishes cell polarity. Src mediated PI3K/Akt activation can also enhance tumor cell survival during growth, invasion and metastasis due to the anti-apoptotic effect of Akt (Guarino, 2009).
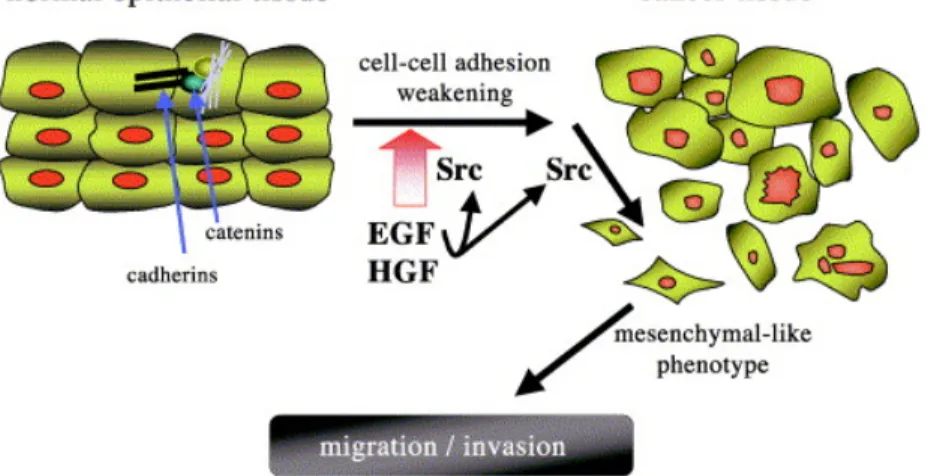
Epithelial cells become migratory through the epithelial-mesenchymal transition (EMT), during which the cell-cell junctions are disrupted. Src is required for EGF- and HGF-induced EMT by phosphorylating the E-cadherin-β-catenin complex, thus altering the interaction between the two proteins and thereby interfering with E-cadherin functionality (Fig. 1.5) (Behrens et al., 1993; Frame, 2002). Furthermore, for tumor cells to invade, they not only need to acquire the migratory phenotype, but also have to translocate through matrix barriers. Src is known to mediate “mesenchymal-type” invasion by promoting the expression of matrix degrading proteases, such as metalloproteinases (MMPs) (Kuo et al., 2006; Wang and McNiven, 2012).
Figure 1.5 Src mediate EGF- and HGF-induced epithelial-mesenchymal transition (EMT) and cell migration and invasion.
11
The Interplay of Src with sex steroid receptors in cancer. Sex steroid hormones including estrogen, progesterone and androgen are key regulators in the development and progression of endocrine-related cancers. These hormones function through estrogen receptor (ER), progesterone receptor (PR) and androgen receptor (AR), respectively. These receptors are members of the nuclear receptor (NR) superfamily, and function as transcription factors to regulate gene expression (Gao et al., 2002). Src has been suggested to play a role in hormone receptor signaling and resistance. Studies have shown that blocking Src interaction with AR or ER strongly inhibits prostate cancer or breast cancer growth (Saad and Lipton, 2010). Prostate and breast cancer patients who receive hormone-deprivation/blocking therapies often develop androgen-independent prostate cancer or antiestrogen-resistant breast cancer, which results in a poor prognosis. Src kinase has been demonstrated to contribute to hormone-independent tumor growth by transactivating AR/ER mediated signaling through other mechanisms, including growth factor and cytokine receptor activation (Hiscox et al., 2006; Mellado et al., 2009). Moreover, active Src kinase can also drive the transition of prostate cancer from the androgen-dependent to -independent type (Unni et al., 2004).
12
Src Family Kinases in T-Cell Signaling
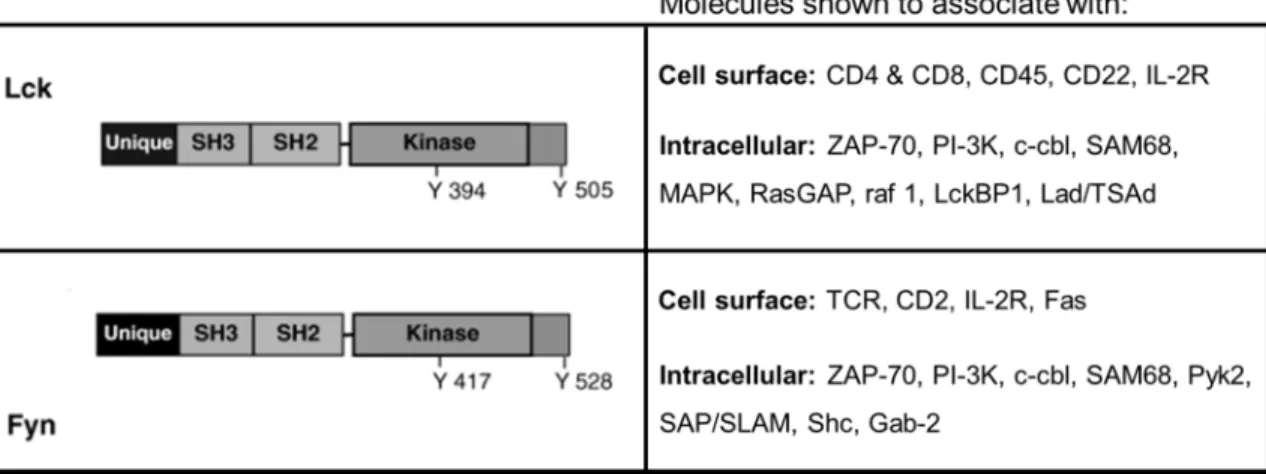
Lck and FynT (the T cell specific isoform of Fyn) are the predominant SFKs found in T cells. They are believed to have overlapping and distinct functions during T cell receptor (TCR) proximal signaling. Lck associates with CD4 and CD8 receptors through cysteine residues in the “unique” domain (Turner et al., 1990; Kim et al., 2003), whereas the “unique” domain of FynT interacts with the TCR-CD3 complex (zur Hausen et al., 1997). The SH2 and SH3 domains of Lck and FynT also exhibit different binding specificities. Different molecules have been shown to interact with Lck or FynT, as demonstrated by coimmunoprecipitation experiments (Table. 1.2) (Zamoyska et al., 2003).
Table 1.2 Signaling molecules associated with Lck and FynT in T cells.
Adapted from Zamoyska, R., Basson, A., Filby, A., Legname, G., Lovatt, M., and Seddon, B. (2003). The influence of the src-family kinases, Lck and Fyn, on T cell differentiation, survival and activation. Immunological Reviews 191, 107–118. © 2003 Blackwell Munksgaard, used with permission.
13
dephosphorylated by other phosphatases including PEP, PTP-PEST and SHP-1 (Salmond et al., 2009). Lck also contains a serine phosphorylation site that is not present in FynT. Serine/threonine kinase MAPK/ERK phosphorylation of this site leads to changes in Lck SH2 binding affinity to phospho-proteins (Stefanová et al., 2003).
The different roles of Lck and FynT can also be attributed to their different cellular localizations. Lck is often found at plasma membrane, whereas FynT is intracellular and colocalizes with the centrosome and microtubules (Ley et al., 1994). It is still unclear how each kinase is specifically recruited and activated upon T cell stimulation. One possible mechanism proposed by Julius and co-workers is that Lck is activated outside of lipid rafts, and then recruited into rafts (Filipp et al., 2003). This translocation is required for Fyn colocalization and activation (Filipp et al., 2008) (Fig. 1.6).
Figure 1.6 Lck and FynT recruitment and activation upon TCR stimulation.
14
Upon T cell stimulation, activated Lck phosphorylate CD3 and ζ-chain ITAMs, leads to recruitment and activation of ZAP-70, which then phosphorylates an adapter protein LAT. LAT is central to the recruitment of multiple signaling molecules that leads to T cell activation. Activated FynT is believed to also contribute to activating some of these pathways, and can partially compensate for loss of Lck (Samelson, 2002). However, FynT is also sufficient to initiate some signaling pathways, as demonstrated in studies using Lck deficient cell lines. For example, FynT alone can activate MAPK/ERK or PI3K upon TCR stimulation (Lovatt et al., 2006; Salmond et al., 2009).
15
Sensing Kinase Activity
As the complex regulation mechanisms of kinases and their important roles in cell signaling and diseases are revealed, the ability to measure kinase activity in living cells and understand precise regulation in a spatiotemporal manner has become critical. Therefore, biosensors and “caged” enzymes aiming to visualize or/and control kinase activity, dynamics and localization have been developed.
FRET-based sensors. Fluorescence resonance energy transfer (FRET) is the transfer of energy from the donor to the acceptor fluorophore, which strongly dependents on donor and acceptor distance and orientation. One major class of FRET-based kinase biosensors is based on the phospho-amino acid binding induced orientation change between the donor and acceptor. When the target kinase is activated, the substrate sequence of the biosensor become phosphorylated, and then binds to the adjacent phospho-amino acid binding domain. As illustrated in Fig. 1.7, this binding result in an orientation change of the fluorescent proteins, thus inducing a FRET change (VanEngelenburg and Palmer, 2008).
Figure 1.7 FRET-based kinase sensor based upon phosphorylation induced conformational change.
16
This type of FRET-based kinase sensors has been developed for a variety of kinases, and new biological phenomena have been discovered. Tsien and co-workers are among the first to develop FRET-based kinase sensors, which include sensors for Abl, Src, EGFR, PKB, PKC and PKA. Studies using these sensors have lead to some interesting findings. For example, PDGF-induced Abl activity is strongest in membrane ruffles (Ting et al., 2001); local mechanical stimulation induces directional and long range Src activation (Wang et al., 2005); phosphorylation of the PKC sensor coincides with calcium oscillations (Violin et al., 2003), and PKB signaling is more rapid in the cytosol than in the nucleus (Kunkel et al., 2005). Umezawa and co-workers also used a FRET based PKB/Akt sensor to discover that activated PKB localizes to subcellular compartments, and different stimuli triggers different localization (Sasaki et al., 2003). Studies using FRET sensors to monitor the activity of other kinases, including ERK (extracellular signal-regulated kinases) (Sato et al., 2007), JNK (Jun N-terminal kinase) (Pereira et al., 2011) and MAPK (mitogen-activated protein kinase) (Timm et al., 2011) have also been published.
The FRET pair can also be introduced onto a kinase itself, if the kinase employs a conformational change upon activation. This approach has been used to monitor several kinases in living cells, including PKB/Akt (Calleja et al., 2003, 2007), Ca2+ /calmodulin-dependent protein kinase II (CaMKII) (Takao et al., 2005; Erickson et al., 2011), ERK2 (Fujioka et al., 2006) and MAP kinase-activated protein kinase 2 (MK2) (Neininger et al., 2001).
17
distance and orientation, or changing FRET partners (Zhang et al., 2005; Allen and Zhang, 2006). Although these sensors are advantageous in the aspect that they are genetically encoded and don’t require cellular delivery, the small FRET signal change and other possible issues including donor-to-acceptor stoichiometry, bleed-through and cross excitation, and donor/accepter orientation all lead to difficulties in designing and analyzing FRET-based kinase sensing (Kremers et al.).
Fluorescent peptide-based sensors. Peptide-based sensors are advantageous in that they can be easily synthesized, are relatively small, and can be modified to contain functional groups to achieve high affinity and specificity. The traditional way of assessing kinase activity using peptide substrates is radioactive ATP-based assays, where phosphorylation is quantified by the amount of radiolabeled gamma phosphate transferred to the substrate. However, these types of assays are discontinuous and require special handling of radioactive materials.
18
resolution, high sensitivity, minimum sample consumption, high sample capacity, short detection time and automated high-throughput analysis (Pang et al., 2004; Wang and Audet, 2009). These features not only allow single cell level analysis and multiplexed kinase measurement, but also provide drug screening and disease diagnosis applications. The drawback, however, is that the assays are discontinuous. Moreover, live cell application requires peptide delivery and the sensors lack spatial resolution (Wang and Audet, 2009).
A popular continuous peptide-based kinase sensing is based on phosphorylation induced fluorescence change. Because peptide sensing strategy doesn’t rely on FRET, the fluorescence response is generally over 100%, which can significantly improve sensitivity (Lawrence and Wang, 2007). The phosphorylation induced fluorescence change can be achieved by several mechanisms. One type of kinase sensor initially developed by Lawrence and workers and then further developed by Imperiali and co-workers is based on chelation enhanced fluorescence (CHEF). The substrate peptides contain a chelation sensitive fluorophore, which exhibit enhanced fluorescence upon phosphate group mediated metal binding. CHEF-sensors for a variety of kinases have been developed, including PKC, Src, Abl, IRK, PKB, MK2, Pim2, PKA and p38α (Chen et al., 2002; Shults and Imperiali, 2003; Luković et al., 2008; González-Vera et al., 2009; Stains et al., 2011; also reviewed in González-Vera, 2012).
19
phosphorylation site. Kinase-mediated phosphorylation modifies the local polarity and thus induces a fluorescence change (Yeh et al., 2002b). Another strategy utilizes the phopho-peptide recognition protein domains. Binding of a protein domain upon peptide phosphorylation will embed the fluorophore in a hydrophobic pocket, thus enhancing fluorescence (Wang and Lawrence, 2005). Environmentally sensitive fluorophores-mediated kinase sensing has also been successfully applied in living cells. Hahn and co-workers have developed a Src kinase sensor, in which a solvent-sensitive merocyanine dye was conjugated to a monobody that contain SH3 domain binding motif. When the Src kinase becomes activated, the SH3 domain is released from the “closed” conformation and recognized by the monobody. This binding induces a fluorescence enhancement of the dye, which is possibly due to the decrease in water-exposed surface area. Using this sensor, they found that Src kinase with an “open” conformation localizes to dorsal ruffles during cell protrusion (Gulyani et al., 2011).
20
different wavelengths also allowed the development of a multicolor sensing system for two or more kinases (Wang et al., 2010b). Lee and colleagues have developed another quenching strategy based on micelle formation. Phosphorylation introduces negative charges and thus disrupts the micelle, which leads to a 4-6 fold fluorescence increase (Sun et al., 2005). In addition, fluorescence fold change has been significantly enhanced (>60-fold) using a “deep quench” strategy also developed by Lawrence and co-workers. A quencher molecule non-covalently interacts with the substrate peptide. Kinase phosphorylation induces the phospho-peptide binding to a protein domain, thereby disrupting the quencher interaction (Sharma et al., 2007).
Peptide-based kinase sensors have been developed rapidly over the past few years. However, only a few have been applied to biological systems. Current peptide-based kinase biosensors need to be improved in their sensitive, specificity, protease resistance and photophysical properties, as well as cell delivery.
Photoactivatable (“caged”) proteins. The complex spatial and temporal regulation of cell signaling networks provides a challenge in elucidating the role of intracellular protein activity and its affect on cellular behavior. Therefore, in the past decade, much attention has been given to developing photoactivatable (“caged”) proteins, whose activities can be spatially and temporally controlled using light in a living cell system.
21
Heidecker, 1996), β-galactosidase (Golan et al., 1996) and PKG (Priestman et al., 2011). The difficulties commonly associated with this strategy are: (a) lack of precise control of modification for proteins that contain multiple reactive residues, and (b) not all proteins contain reactive residues that regulate enzymatic activity. Molecular biology, however, has provided alternative strategies that allow specific modification. One way is using site-directed mutagenesis to introduce reactive residues (e.g., cysteine) at key active sites (Chang et al., 1995; Ghosh et al., 2004), or to generate single reactive residue mutant (Chang et al., 1998). Another strategy pioneered by Schultz and co-workers (Wang et al., 2006a) is unnatural amino acid mutagenesis, which allows direct protein expression with the desired caging groups at specific sites of the target protein. A variety of proteins have been caged using unnatural amino acid mutagenesis (reviewed in Lee et al., 2009; Riggsbee and Deiters, 2010). Single key residue modification has also been described using an enzyme-directed caging protocol (Zou et al., 2002).
22
which the critical tyrosyl phosphate moiety is protected by a photolabile group. Microinjecting this peptide into living cells and followed by UV irradiation induced light-dependent PI3K activation (Kawakami et al., 2008). Dieters and co-workers used a caged rapamycin to induce protein dimerization by light in living cells (Karginov et al., 2010). In addition, Lawrence et al. have reported a coumarin-caged cAMP that was used in conjunction with nitrobenzyl-caged PKG to achieve wavelength-distinct photoactivation of PKA and PKG in living cells (Priestman et al., 2011). Deiters et al. have recently developed an inhibitor-like caging strategy, in which protein function is sterically blocked by bulky PEG polymers attached to lysine residues through a photo-labile linker. Upon UV irradiation, the PEG photocage will be removed to release the native protein (Georgianna et al., 2010).
23
Figure 1.8 Different approaches to construct “caged” proteins.
(A) Key residues modified by photo-cleavable groups. (B) Control of protein function by light using caged small molecule effectors. (C) Reversible regulation of protein activity by light-responsive domains.
Adapted from Chad W. Riggsbee, Alexander Deiters. (2010). Recent advances in the photochemical control of protein function. Trends in Biotechnology. 28, 468-475. © 2010 Elsevier, used with permission.
A
B
CHAPTER II
SRC KINASE ACTIVITY PROFILING IN PROSTATE CANCER: A CORRELATION WITH CANCER CELL INVASIVENESS
Conventional strategies for identifying the biochemical basis of tumorigenesis and metastasis rely upon the search for aberrant up- (or down-) regulated genes and proteins. Although this approach has lead to life-saving discoveries (Gora-Tybor and Robak, 2008), many areas of cancer diagnosis, treatment, and prognosis remain intractable. For example, a majority of men diagnosed with prostate cancer (CaP; e.g. >200,000 American men/year), a typically slow growing disease, will eventually die from other disorders. For these patients, treatment is both unnecessary and expensive, with the cost of a typical radical prostatectomy running approximately $5000 - $7500 (based on data from 2007) (Bolenz et al., 2010). On the other hand, a significant fraction of CaP patients will find themselves dealing with the deadly metastatic form of the disease: approximately 27,000 American men die from CaP each year (Wolf et al., 2010). The absence of clear-cut biochemical markers precludes the design of a satisfactory treatment protocol at the time of diagnosis. In short, a burning and unresolved issue in the field of CaP is how to distinguish between the benign and deadly forms of the disease at the time of diagnosis.
25
invadopodia, protease-active protrusions displayed by metastatic cancer cell lines and by patient-derived tumor cells (Buccione et al., 2009). Invadopodia promote the breakdown of the extracellular matrix in a machete-like fashion, a behavior required for the subsequent invasion of surrounding tissue. The protein tyrosine kinase Src is both sufficient and necessary for invadopodia formation and function (Bowden et al., 2006; Buccione et al., 2009; Kelley et al., 2010). This is due, at least in part, to the Src kinase-mediated phosphorylation of cortactin, an action that triggers the cofilin-promoted assembly of F-actin in invadopodia (Oser and Condeelis, 2009; Mader et al., 2011). In addition, Src is known to play a critical role in promoting protrusions at the leading edge, an essential element of migratory behavior that is likewise a cofilin-dependent process. Recently, it has been proposed that the cofilin pathway in metastatic cells is globally inhibited, yet contains spatially-localized pockets of dynamic activity (Soon, 2007). In short, the intracellular topography of this key signaling pathway may form the biochemical basis of metastatic potential. In addition to invasion, Src has also been implicated in the transition to and maintenance of androgen-independent growth, another hallmark of aggressive CaP (Fizazi, 2007; Tatarov et al., 2009).
26
27
Materials and Methods
Peptide synthesis. Analytical grade reagents N,N-dimethylformamide (DMF), dichloromethane (DCM), N,N-diisopropylethylamine (DIPEA), acetonitrile (ACN), trifluoroacetic acid (TFA) and other common reagents were purchased from Fisher or Sigma-Aldrich. Fmoc amino acids, O-(1H-6-chlorobenzotriazole-1-yl)-1,1,3,3-tetramethyluronium hexafluorophosphate (HCTU), N-hydroxybenzotriazole (HOBT) and NovaSyn TGR resins were obtained from NovaBiochem. Fmoc-Orn(Aloc)-OH was obtained from Bachem. 5-carboxyfluorescein (5-FAM) was purchased from Anaspec. The non-phosphorylated peptide–resin Fmoc-Orn(Aloc)-Glu(OtBu)-Glu(OtBu)-Glu(OtBu)-Ile-Tyr(tBu)-Gly-Glu(OtBu)-Phe-Orn(Aloc)-amide-Resin and the phosphorylated peptide–resin Fmoc-Orn(Aloc)-Glu(OtBu)-Glu(OtBu)-Glu(OtBu)-Ile-Tyr(PO(OBzl)OH)-Gly-Glu(OtBu)-Phe-Orn(Aloc)-amide-Resin were synthesized using a standard Fmoc peptide synthesis protocol on the Prelude automatic peptide synthesizer (Protein Technologies). Briefly, amino acid (5 equiv), HCTU (5 equiv) and DIPEA (10 equiv) were mixed with TGR resin in DMF and reacted with nitrogen bubbling mixing for 10 min at room temperature. Fmoc deprotection was achieved by using 20% piperidine in DMF for 20 min. The allyloxycarbonyl (Aloc) protecting group on the ornithine (Orn) residues was selectively removed with 3 equivalent of tetrakis (triphenylphosphine) palladium [Pd(PPH3)4] in chloroform/acetic
28
incubating with 30% piperidine for 15 min. The peptides were cleaved with TFA/H2O/TIS (triisopropylsilane) (95:2.5:2.5) and purified via HPLC (Waters), and their
structures confirmed by ESI-Mass Spectrometry (Agilent Technologies). C81H97N13O27
(peptide 1) calculated Mass: 1684.7, found (ESI+) 1684.0 and C81H98N13O30P (peptide 2)
calculated Mass 1764.7, found 1764.0.
Cell permeable Src sensor peptide 3 was prepared by mixing free N-terminal amine containing peptide with 1.5 equivalent of carboxyfluorescein diacetate, succinimidyl ester (CFDA-SE, AnaSpec) in anhydrous DMF, and react in the presence of 10 equiv of anhydrous DIPEA for 2 h. Reaction mixture was then purified by HPLC and confirmed by ESI-MS. C85H103N13O29 (peptide 3) calculated Mass: 1770.8, found 1768.2.
Peptides 9-14 were synthesized in a similar fashion described above. Briefly, the peptide backbones were prepared using a peptide synthesizer, and followed by 5-FAM coupling on the free N-terminal amine. All the peptides were HPLC purified and confirmed by ESI-MS. C63H67N9O21 (peptide 9) calculated Mass: 1286.2, found 1285.6;
C65H69N9O23 (peptide 10) calculated Mass: 1344.3, found 1343.8; C64H69N9O21 (peptide
11) calculated Mass: 1300.3, found 1300.0; C66H71N9O23 (peptide 12) calculated Mass:
1358.3, found 1357.8; C63H67N9O21 (peptide 13) calculated Mass: 1286.2, found 1286.0;
C63H69N9O19 (peptide 14) calculated Mass: 1256.3, found 1256.0.
Cell culture and cell lysate preparation. All cell lines were acquired from ATCC and grown in a humidified incubator at 37 ˚C with 5% CO2. PZ-HPV-7, RWPE1,
29
Invitrogen), and 1% penicillin/streptomycin (P/S; Invitrogen). 22Rv1 cells were cultured in RPMI 1640 medium (Invitrogen) supplemented with 10% heat-inactivated fetal bovine serum (HI-FBS, Invitrogen) and 1% P/S. DU145 cells were cultured in Eagle’s Minimum Essential Medium (EMEM, ATCC) supplemented with 10% HI-FBS and 1% P/S. PC3 cells were cultured in F-12K medium (ATCC) supplemented with 10% HI-FBS and 1% P/S. Cell lysates were prepared as followings: confluent cells were first trypsinized and collected into 15 mL tubes and then washed 3 times with 10 mL ice cold Dulbecco's phosphate-buffered saline buffer (DPBS, no calcium, no magnesium, Invitrogen). The cells were lysed by M-PER mammalian protein extraction reagent mixed with 5/100 (v/v) Halt protease and phosphatase inhibitor cocktail EDTA-free (Thermo Fisher Scientific), and rotated for 10 min at 4 ˚C. Cell debris was removed by centrifuging samples at 14,000 x g for 10 min at 4 ˚C. The total protein concentrations were determined by comparing to known concentrations of bovine serum albumin (BSA) using the Dc Protein assay (Bio-Rad).
30
voltage of 12 kV. The running buffer was 100 mM Borate/100 mM SDS buffer at pH 7.7. For samples containing EGFR substrates, the concentrated samples were diluted in 100 mM Borate buffer at pH 7.5 and hydrodynamically injected and separated at 25 ˚C at a constant voltage of 12 kV. The running buffer was 140 mM Borate/70 mM SDS buffer at pH 7.7. Before each run, the capillary was rinsed with 0.1 M NaOH, distilled water, and then the running buffer for 2 min under 20 psi pressure. Data was collected and analyzed using 32 Karat Software (Version 8.0, Beckman Coulter).
Protein kinase phosphorylation assay. Kinase assay reagents including 4-morpholinepropanesulfonic acid (MOPS), ethylenedinitrilotetraacetic acid (EDTA), magnesium chloride (MgCl2) and adenosine 5′-triphosphate disodium salt hydrate (ATP)
were purchased from Sigma Aldrich. The pure Src kinase phosphorylation assays were performed with a total volume of 40 µL from the following stock solutions: 30.9 µL of H2O, 0.5 µL of 1.14 mM substrate stock solution, 4 µL of 10X Src kinase reaction buffer
(80 mM MOPS, 2 mM EDTA, 40 mM MgCl2, pH 7.0), 0.6 µL of 100 ng/µL active Src
kinase (Millipore 14-326), 4 µL of 10 mM ATP. Final concentration of the assay solution was 8 mM MOPS, 0.2 mM EDTA, 4 mM MgCl2, 1.5 ng/µL Src kinase, 14.25 µM
substrate, and 1 mM ATP. Assays were initiated by adding ATP. At each time point, 2 µL of the reaction mixture was removed and diluted with 8 µL 0.1 M HCl to stop the reaction.
The Src and Akt kinase phosphorylation assays were performed in a similar fashion, but the final concentration of the assay solution was 8 mM MOPS, 0.2 mM EDTA, 4 mM MgCl2, 0.25 ng/µL Src kinase or/and Akt1 kinase (S473D, Millipore
31
kinase phosphorylation assays were performed using a total assay volume of 15 µL, and the final concentration of the assay solution was 8 mM MOPS, 0.2 mM EDTA, 4 mM MgCl2, 10 mM MnCl2, 0.1 µg/µL BSA, 0.05 mM DTT, 1.7 ng/µL Src kinase or 6 ng/ µL
EGFR kinase (Millipore 14-531), 40 µM Src substrate or EGFR substrate, and 1 mM ATP.
Cell lysate phosphorylation assays were also performed similarly as described above under the following conditions: 2.5 µg/µL cell lysate, 6.75 mM Tris (pH 7.5), 1 mM ATP, 4 mM MgCl2, 57 µM substrate in the absence of presence of different
concentrations of tyrosine kinase inhibitors Gleevec (imatinib mesylate) or AZD0530 (Selleck Chemicals). Assays were initiated by adding substrate(s).
32
membranes were incubated with primary antibodies for various times (non-phospho antibodies were diluted 1.7:1000 in blocking buffer and incubated for 15 min (X2); phospho-antibodies were diluted 1.7:1000 in PBST and incubated for 3 h. The membranes were washed with PBST 3 times following manufacture’s instruction. Then secondary antibodies (1:1000 dilution in blocking buffer for non-phospho protein detection; 1:1000 dilution in PBST for phospho-protein detection) were applied for 15 min. The membranes were subsequently washed with PBST (X3), 0.5% NaCl (X3) and PBS (X3). The blots were detected by Amersham ECL Plus (GE Healthcare) and the chemiluminescence images were obtained by the FluoChemFC2 system (Alpha Innotech). The densitometry analysis of the bands was performed using the AlphaView software.
Immunodepletion of Src kinase from cell lysates. A Pierce Classic IP kit was employed for these experiments. The immune complex was formed by mixing (via rotation) 500 µg of cell lysate with 5 µg of Src antibody Src (36D10): 2109 or 5 µg bovine serum albumin (BSA) as control overnight at 4 ˚C. The immune complex was then captured by mixing (via rotation) the cell lysate-antibody mixtures with Pierce protein A/G agarose; the BSA control was mixed with Pierce control agarose resin for 1 h at 4 ˚C. Both treatments (with antibodies and with bovine serum albumin) were separately repeated (3 h exposure time to antibodies/bovine serum albumin and 1 h agarose-capture). Finally, the pre-cleared lysate was collected and concentrated using the Vivaspin 500 centrifugal concentrator, 10 kD (GE Healthcare) for western blot analysis and kinase assays.
O-33
ring to a glass coverslip (Fisher). The day before use, DU145 cells in suspension were diluted in 500 µL of complete media, plated on the chamber, and incubated in a 5% CO2
humidified incubator at 37 ˚C. Single cell capillary electrophoresis was performed using a custom-made CE-LIF system, as described previously (Kottegoda et al., 2008; Proctor et al., 2012). Briefly, capillaries (30 µm inner diameter, 360 µm outer diameter, total length 38 cm with an effective length 21.5 cm) were conditioned with 0.1 M NaOH for 12 h, distilled water for 1 h, 0.1 M HCl for 6 h and distilled water again for 12 h. To initiate electrophoresis, the inlet reservoir was held at ground and a voltage of -10 kV was applied to the outlet. The electrophoretic buffer was 300 mM Borate buffer at pH 7.5. Each new chamber of cells was first washed with a constant flow of extracellular buffer (ECB; 135 mM NaCl, 5 mM KCl, 1 mM MgCl2, 1 mM CaCl2, and 10 mM HEPES, pH
34
Fluorescence microscopy. Cells were plated on glass bottom dish the day before experiment and let adhere in a 37 ˚C, 5% CO2 humidified incubator. The cells were
washed with ECB buffer once before treated with cell permeable Src sensor 3 for 30 min at 37 ˚C. Peptide 3 stock solution (in anhydrous DMSO, stored at -80 ˚C) was diluted in ECB buffer to reach a final concentration of 5 µM. After removing peptide containing buffer, the cells were washed with ECB buffer again. Transmitted light images and fluorescein fluorescence images were taken using an inverted Olympus IX81 microscope with transmitted light and FITC filter cube.
Matrigel invasion assay. Invasion assay was performed using BD BioCoatTM Tumor Invasion System. One key component of the tumor invasion system is the BD FluoroBlokTM insert, which contains polyethylene terephathalate (PET) membrane that blocks 490-700 nm light transmission. Therefore, fluorescence from cells in the top chamber is shielded from bottom-reading fluorescence plate readers and microscopes, whereas cells that invaded through the membrane to the bottom chamber can be easily detected without cell scraping and manual cell counting (BD Biosciences, 2010). The other key component is the BD MatrigelTM Matrix coating, which is a biologically active extracellular matrix preparation extracted from the Engelbreth-Holm-Swarm mouse sarcoma (BD Biosciences, 2008).
The 24-multiwell tumor invasion system was warmed up to room temperature, and rehydrated with 500 µL serum free media (according to the cell line to be used) in a 37 ˚C, 5% CO2 incubator for 2 h. The rehydrating media was then carefully removed
35
~80% confluency in T75 flasks. The cells were washed with 10 mL DPBS, and lifted with 3 mL 0.53 mM EDTA, pH 8.0. Serum free medium (7 mL) was added to the detached cells, and centrifuge at 200 x g for 5 min to remove supernatant. The cells were then resuspended in serum free media containing 0.1% BSA. 500 µL cell solution containing 5 X 10⁴ cells (counted using Scepter 2.0 handheld automated cell counter, Millipore) were added to the upper chamber of each well, and 750 µL complete medium (without antibiotics) was added to the lower chamber. The plate was then incubated at a 37 ˚C, 5% CO2 incubator for 24 h. The cells were labeled with calcein
acetoxymethylester (calcein AM, BD Biosciences), a non-fluorescent, cell-permeable dye that becomes fluorescent after being hydrolyzed in live cells. The PET membrane can block >99% of calcein fluorescence (Ex = 494 nm, Em = 517 nm) (BD Biosciences, 2006). 100 µg calcein AM powder was first dissolved in 40 µL DMSO, then diluted in 20 mL Hank's balanced salt solution (HBSS) to reach the final concentration of 5 µg/mL. The calcein AM solution was added to a new BD FalconTM 24 well plate at 500 µL/well. The upper chamber from the invasion system was taken out after incubation. The media was carefully removed and the chamber was transferred to the calcein AM containing plate. The cells in the upper chamber were labeled as well with 300 µL calcein AM solution. Labeling was allowed at 37 ˚C, 5% CO2 incubator for 1 h. The fluorescence
reading from bottom and top was separately taken using a SpectraMax Gemini™ EM fluorescence plate reader at 494 nm excitation and 517 nm emission.
36
Assay solutions contain: (1) Cell lysis buffer (CLB, 150 mM NaCl, 9.1 mM Na2HPO4,
1.7 mM NaH2PO4, 1.0% nonidet P-40, 0.5% deoxycholic acid, pH 7.4) (2) kinase buffer
(8 mM MOPS, 0.2 mM EDTA, 4 mM MgCl2), (3) RWPE1 cell lysate prepared in CLB,
(4) RWPE1 cell lysate from (3) with addition of 46 mM β-glycerophosphate (BGP), and (5) RWPE1 cell lysate from (3) heat inactivated at 100 ˚C for 10 min. In addition, 10 mM MgCl2, 13.4 µM Akt substrate (peptide 6) or H2O for background controls were present
37
Results and Discussion
38
A variety of peptide-based substrates have been described to assay kinase activity. Generic ELISA- (Rijksen et al., 1996) and γ-32P-ATP-based (Braunwaler et al., 1996) methods are two of the most common, and very sensitive, strategies used for assessing activity with pure enzyme under in vitro conditions. In addition, fluorophore-labeled peptides (Wang and Lawrence, 2005; Wang et al., 2006b, 2006c, 2010b; Lawrence and Wang, 2007), as well as GFP-based proteins, have been described that exhibit a fluorescent response to phosphorylation, thereby allowing Src kinase activity to be continuously sampled in live cells via fluorescent microscopy (Ting et al., 2001; Wang et al., 2005). A biosensor that generates a fluorescent readout through binding to the “open” conformation of Src kinase has also been described (Gulyani et al., 2011). Although the latter technologies furnish a window into the biochemical basis of cell behavior, it is less readily translated into a routine and economical methodology for the rapid screening of the limited number of cells available in patient samples.
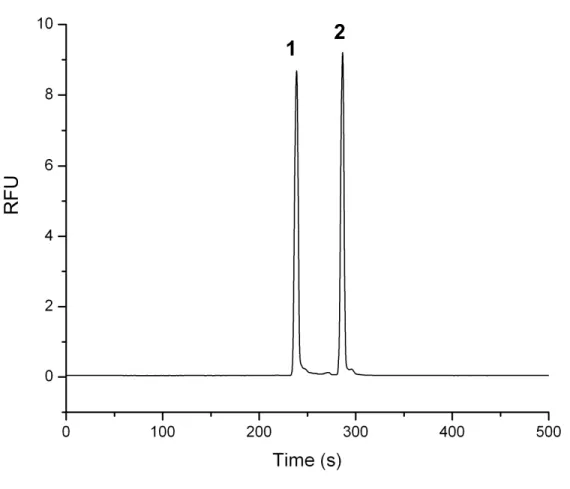
CE is an ultrasensitive method by which small amounts of analytes are separated and quantified, via the application of an electric field and subsequent detection of the analytes (Borland et al., 2008). The Src kinase catalyzes the transfer of the -phosphoryl group from ATP to the tyrosine residue of the substrate, which results in a change of the electrophoretic mobility. The latter enables separation of the starting nonphosphorylated peptide substrate from the final phosphorylated product (Li et al., 2001, 2004; Sims and Allbritton, 2003).
5-FAM-Orn(Ac)-Glu-Glu-Glu-Ile-Tyr-Gly-Glu-Phe-39
Orn(Ac)-amide (peptide 1), where Tyr represents the site of phosphorylation. Ornithine (Orn) residues were placed on each terminus of the peptide sequence, in the event that the peptide proved to display poor selectivity for Src versus other protein kinases. We have previously shown that side chain modification of active site-directed peptides with unnatural substituents can dramatically enhance the selectivity for the target protein kinase (vide infra) (Lee and Lawrence, 1999, 2000; Shen et al., 2001; Yeh et al., 2002a; Lee et al., 2004, 2008b; Li and Lawrence, 2005). Both the non-phosphorylated and the phosphorylated forms [5-FAM-Orn(Ac)-Glu-Glu-Glu-Ile-pTyr-Gly-Glu-Phe-Orn(Ac)-amide (peptide 2)] of the peptide were prepared via solid-phase peptide synthesis. 5-FAM (5-carboxyfluorescein) was chosen as the fluorophore for substrate and product detection by laser-induced fluorescence (LIF).
40
pace. In the latter case, initial rate kinetics (<10% peptide phosphorylation) were acquired within 10 min of cell lysate incubation. (Fig. 2.3)
Figure 2.1 CE-LIF separation and visualization of the Src peptide substrate 1 and its chemically synthesized phosphorylated counterpart 2.
A 1:1 mixture of Src kinase substrate peptide 1 and its chemically synthesized phosphorylated counterpart peptide 2 was diluted in the CE running buffer (100 mM Borate/100 mM SDS buffer at pH 7.7) and hydrodynamically loaded into the capillary and separated at a constant voltage of 12 kV. The substrate peptide 1 emerges at 240 s, and the phosphorylated product peptide 2 appears at 290 s. (RFU = relative fluorescence units).
RFU
41
Figure 2.2 Src kinase-catalyzed phosphorylation of the Src substrate as a function of time..
42
43
Stability of the Src kinase peptide substrate in prostate cell lysates. Peptides commonly suffer protease-catalyzed degradation in cells as well as in cell lysates (Proctor et al., 2012). Consequently, prior to examining Src kinase-catalyzed phosphorylation of peptide 1 with lysates, we monitored the stability of the peptide as a function of time. Cells were lysed using Pierce’s M-PER mammalian cell lysis buffer and, in the absence of ATP and Mg2+ (i.e. no observable kinase activity), the lysate was added to Src substrate peptide 1. The stability of the peptide in the presence of lysate from the nine prostate cell lines is shown in Table 2.1. Only approximately 10% of the peptide is degraded after 1 h. Since the phosphorylation rate is measured within 10 min of incubation, the peptide is sufficiently stable for our needs.
Cell Line % Remaining parent peptide
PZ-HPV-7 92.4 ± 0.2
RWPE1 91.0 ± 0.6
WPE1-NA22 92.4 ± 0.8
WPE1-NB14 91.4 ± 1.2
WPE1-NB11 89.8 ± 1.5
WPE1-NB26 91.0 ± 1.5
22Rv1 91.2 ± 1.8
DU145 92.9 ± 0.5
PC3 89.2 ± 2.2
Table 2.1 Stability of the Src peptide sensor in prostate cell lysates.
44
Assessment of Src activity in prostate cell line lysates. Tatarov et al. recently found a diminished survival rate in androgen-independent CaP patients with high levels of pTyr-416 Src (Tatarov et al., 2009). However, although pTyr-416 is necessary for Src kinase activity, it is not sufficient. As noted above, it is unclear what affect the presence or absence of a phosphorylated Tyr-527 residue has on Src activity given the possible existence of nearby protein binding partners. Src activity, as opposed to phosphorylation status, is a key point since recent preclinical and clinical studies have revealed that Src inhibitors, in particular dasatinib and saracatinib, hold significant promise for the treatment of CaP (Edwards, 2010). Both of these inhibitors target the ATP binding pocket of Src and therefore this form of therapy only makes sense for patients who actually display enhanced Src kinase activity. Consequently, we examined whether any correlation exists between total Src kinase activity and cell invasiveness using a series of prostate cell lines.
Our initial studies focused on the non-invasive immortalized normal prostate epithelial cell lines PZ-HPV-7 and RWPE1 and the highly invasive CaP cell lines DU145 and PC3. We also investigated Src activity in the non-metastatic CWR22Rv1 cell line, which exhibits androgen-independent growth, a characteristic behavior of advanced stage CaP (Hsieh and Wu, 2009) correlated with the Src kinase (Tatarov et al., 2009).
45
46
Figure 2.4 Src kinase activities of PZ-HPV-7, RWPE1, CWR22Rv1, DU145 and PC3 prostate cell lines.