ASSOCIATIONS BETWEEN PATELLAR TENDON STRUCTURE, MOVEMENT QUALITY, AND TRAINING CHARACTERISITICS IN MALE COLLEGIATE ATHLETES
Kelsey M. Rankin
A thesis submitted to the faculty at the University of North Carolina at Chapel Hill in partial fulfillment of the requirements for the degree of Master of Arts in the Department of Exercise
and Sport Science (Athletic Training) in the College of Arts and Sciences.
Chapel Hill 2018
Approved By: Darin Padua
William Prentice
ABSTRACT
Kelsey M. Rankin: Associations between Patellar Tendon Structure, Movement Quality, and Training Characteristics in Male Collegiate Athletes
(Under the direction of Darin Padua)
Purpose: Ultrasound tissue characterization (UTC) is an imaging tool used to quantify tendon
structural integrity. UTC has quantified patellar tendon response to load in athletes; PT structure between two conversely loaded high volume sports has yet to be compared. Methods: The JV Men’s Basketball team (n=13) and Varsity Men’s Swim team (n=13) at the University of North
Carolina at Chapel Hill were imaged using the UTC device with a 10-MHz linear-array
transducer mounted in a tracking device. UTC algorithms quantified the stability of pixel brightness over every 17 contiguous transverse images into 4 echo-types (I-IV). Participants completed a jump-landing task using the Electromagnetic Motion Capture System. The dominant
limb of each participant was analyzed for patellar tendon structure and landing biomechanics. All participants completed a self-report training load questionnaire, including the validated PT
assessment the VISA-P. Independent Samples T-tests, correlations and multiple linear regression model were used to assess association and correlation between tendon structure and measures of training intensity. Results: 26 subjects completes this study. There was significant difference in
tendon structure between basketball and swim athletes (p = 0.04) with basketball athletes presenting with significantly less aligned tendon structure. There was moderate association
TABLE OF CONTENTS
ABSTRACT ... III
TABLE OF CONTENTS ... IV
LIST OF TABLES ... VII
LIST OF ABBREVIATIONS... VIII
CHAPTER I: INTRODUCTION ... 1
INTRODUCTION... 1
RESEARCH AIMS AND HYPOTHESES ... 4
CHAPTER II: LITERATURE REVIEW ... 8
ETIOLOGY ... 8
Sports Specific ... 8
Training Load ... 9
Plyometric Loading ... 10
CONTINUUM OF TENDON PATHOLOGY ... 11
Reactive Tendinopathy ... 11
Tendon Disrepair... 12
Degenerative Tendinopathy ... 12
DIAGNOSIS ... 13
Tendon Morphology ... 14
Cross-Sectional Area ... 14
Neovascularization ... 15
LOWER EXTREMITY BIOMECHANICS ... 15
Lower Extremity Musculature ... 16
Landing Error Scoring System ... 18
DIAGNOSTIC IMAGING... 19
Traditional Ultrasound ... 19
Ultrasound Tissue Characterization ... 19
CLINICAL SIGNIFICANCE ... 20
CHAPTER III: METHODS ... 21
STUDY DESIGN ... 22
PARTICIPANTS ... 22
SELF-REPORTED FUNCTION &TRAINING LOAD QUESTIONNAIRES ... 23
BIOMECHANICAL DATA COLLECTION ... 24
Instrumentation... 24
Jump-Landing Task ... 25
Phase Identification ... 26
Data Processing ... 26
DEPENDENT VARIABLE CALCULATION ... 27
ULTRASOUND TISSUE CHARACTERIZATION ... 27
STATISTICAL ANALYSIS ... 29
CHAPTER IV: RESULTS ... 32
UTCCHARACTERIZATION ... 33
BIOMECHANICS ... 34
CORRELATIONAL ANALYSIS ... 37
MULTIPLE LINEAR REGRESSION MODEL ... 39
CHAPTER V: MANUSCRIPT ... 42
INTRODUCTION... 42
METHODS ... 44
Participants ... 44
Self-Reported Function & Training Load Questionnaires ... 45
Instrumentation... 46
Jump-Landing Task ... 47
Biomechanical Data Reduction ... 47
Ultrasound Tissue Characterization ... 48
Statistical Analysis... 50
RESULTS... 52
DISCUSSION... 57
Limitations ... 61
Conclusion ... 61
APPENDIX 1: TRAINING LOAD QUESTIONNAIRE ... 63
APPENDIX 2. VICTORIAN INSTITUTE OF SPORT OF SPORT ASSESSMENT ... 70
APPENDIX 3. PAIN MAP FOR SLDS ... 72
APPENDIX 4. SUBJECT SET-UP FOR UTC PATELLAR TENDON SCAN. ... 73
LIST OF TABLES
TABLE I:DESCRIPTIVE STATISTICS OF STUDY PARTICIPANTS ... 32
TABLE II:DESCRIPTIVE STATISTICS COMPARING UTCECHO TYPES (%) ... 34
TABLE III:DESCRIPTIVE STATISTICS COMPARING BIOMECHANICAL VARIABLES ... 35
TABLE IV:CORRELATION ANALYSIS BETWEEN BIOMECHANICS AND UTCECHO TYPES (%) ... 38
TABLE V:EFFECT OF MOVEMENT QUALITY AND TRAINING TO PREDICT AFS ON UTCIMAGES ... 39
LIST OF ABBREVIATIONS
PT Patellar Tendinopathy
PTA Patellar Tendon Abnormalities
UTC Ultrasound Tissue Characterization
AFS Aligned Fibrillar Structure
DIS Disorganized Tissue Structure
ROI Region of Interest
CSA Cross Sectional Area
KFD Knee Flexion Displacement
vGRF Vertical Ground Reaction Force
KEM Knee Extension Moment
IGC Initial Ground Contact
VAS Visual Analog Scale
VISA-P Victorian Institute of Sport Assessment- Patella
OSTRC Oslo Sports Trauma Research Centre
Chapter I: Introduction Introduction
Anterior knee pain is a challenging condition to manage for healthcare providers. It’s
chronic and non-specific nature makes diagnosis and prognosis challenging. Patellar tendon
pathology is gradual in onset and continuous if unmanaged.1,2 Cook et al.3 proposes that tendon
pathology occurs along a continuum of three stages; reactive tendinopathy, tendon disrepair, and degenerative tendinopathy. Tendon structure is adaptable and can be driven along this
continuum, dependent on what intrinsic and extrinsic factors are present. Load is the primary stimulus underlying the development of structural tendon pathology and symptoms.3
Tendinopathy is a load-based pathology, commonly developing due to excessive load from high training and competition bouts.4 While diagnosis of tendinopathy is traditionally based on
location of self-reported pain, load-based pain reproduction, and/or structural pathology on diagnostic imaging, the literature demonstrates that the clinical presentation of tendinopathy can vary, with tendon-related symptoms and structural pathology not always occurring
simultaneously. 5,6
Patellar tendon structural abnormities (PTA) present as structural changes in tendon
tissue commonly found at either tendon origin or insertion, inferior patellar pole and tibial tuberosity respectively, associated with or without pain, functional limitations, and change in
load.7 Cook et al.8 reported that 22% of the athletes that had patellar tendon abnormalities (PTA)
on ultrasound had no clinical symptoms. Rudavsky et al.9 found that tendon pathology on
prevalence as female athletes. It was theorized that males are at higher risk of developing PTA due to a larger knee extension moment compared to females. Often, athletes may choose to
continue to participate in sport (practices and competitions) despite the presence of tendon-related pain; however, eventual reduction in sport participation and physical activity may result from the continued demand placed on this highly responsive tissue, leading to eventual reduction
loading capacity, self-limiting physical activity, and reduced overall quality of life.4,10
Sports involving high volumes of jumping and landing, such as basketball and volleyball,
experience the highest incidence of patellar tendinopathy (PT).11,12 It is estimated that over 13%
of athletes involved in basketball and volleyball will experience patellar tendon pain at some point in their competitive career.11 The effect of tendinopathy on sport participation is difficult to
measure, as it is rare that an individual will miss a training or competition bout due to this condition, especially early in its pathoetiologic process.8 It has been shown that lower extremity
loading in combination with jumping sports increases the risk for developing PT.13 Sport-specific
motions (squatting, lunging, cutting) are typically reported as painful by athletes with
symptomatic patellar tendinopathy. External load, or the load exerted on the body, is a primary
pathoetiologic component in PT; however, some sports known for their high training and competition volumes, such as competitive swimming, aren’t represented in the literature.3
Swimmers train an average of 5-6 hours per day through a competitive season that can last up to 12 months.14 Their training is unique, as the majority takes place in an aquatic environment with
un-weighted horizontal gravitational and rotational forces acting on the musculoskeletal system
through their loading period.14 Therefore, differences in loading parameters between basketball
between sports.1,3 However, associations between type of loading parameters and patellar tendon
structure have not been systematically assessed in these specific athlete groups.
New ultrasound imaging techniques allow for improved visual analysis of tendon structure through ultrasound images.15 Traditional ultrasonographic (US) technology typically
quantifies and describes tendon structure based on grey-scale images; the most commonly
reported outcomes to describe tendon structure in the literature include cross-sectional area (CSA), echogenicity, and neovascularization.16–18 Grey-scale ultrasound imaging relies on more
subjective interpretation of these tendon structural characteristics, and is not able to detect subtle changes in tendon structural integrity that are thought to represent positive or negative
adaptation.15 Ultrasound Tissue Characterization (UTC) is an novel ultrasonographic imaging
technology that quantifies tendon structural integrity through advanced computer algorithms that categorize the characteristics, specifically the orientation and stability, of the collagen fibers
within the tendon.15,19,20 The ability of UTC to quantify tendon structure and assess response to
training load makes it an ideal tool to assess differences existing tendon structure between dynamic and non-dynamic sport athletes.19,21,22
Lower extremity kinematics and kinetics in athletes with symptomatic PT may contribute to presentation of pathology. Rosen et al.23 found that individuals with PT displayed different
movement strategies compared to a healthy population during a double limb jump-landing task, including increased knee flexion displacement and increased peak internal knee extension moment. One key variable that influences tendon structure is the overall magnitude of
mechanical load and the direction of mechanical load endured by the patellar tendon.4,10 Changes
in sagittal plane movement patterns in those with PT may be due to the associated alterations of
in dissipating externally applied load and in generation of internal moment through the knee extensor mechanism, understanding movement characteristics of individuals at high-risk of
developing patellar tendinopathy is important in order to prescribe and manage injury prevention and rehabilitation programs.
Clinical Significance
Current literature suggests that athletes with structural abnormalities of the patellar tendon have a higher risk of developing patellar tendinopathy than athletes without structural
pathology.6,20,24,25 However, it is unknown how type of training load (plyometric vs.
non-plyometric) and lower extremity biomechanics influence tendon structure. The primary aim of this study is to determine the differences in patellar tendon structure between athletes
participating in primarily land-based training (basketball) and aquatic-based training
(swimming). This will be accomplished by examining the percentages of the four echo-types, all
reflecting stages of tendon structural integrity, in the dominant limb’s patellar tendon between male collegiate basketball athletes and male collegiate swimmers. The second aim will examine if specific landing kinematic & kinetic patterns influence patellar tendon structure of the
dominant limb of male collegiate basketball players and swimming athletes. Finally, the third aim will examine the influence of both training load variables and biomechanical variables on
tendon structure.
Research Aims and Hypotheses
Aim 1: Determine if there are differences in pre-season patellar tendon structural integrity of the
Hypothesis 1: We hypothesize that male collegiate basketball athletes will exhibit a significantly lower percentage of aligned fibrillar structure of the dominant limb patellar tendon than that of
male collegiate swimmers.
Aim 2: Determine if landing kinematics & kinetics are associated with pre-season patellar tendon structural integrity of the dominant limb of male collegiate basketball athletes and male
collegiate swimming athletes.
Hypothesis 1: We hypothesize that there will be a negative association between peak vertical
ground reaction force and patellar tendon structural integrity, such that higher peak vertical ground reaction force will be associated with a lower percentage of aligned fibrillar structure of the dominant limb patellar tendon.
Hypothesis 2: We hypothesize that there will be a negative association between peak internal knee extension moment and patellar tendon structural integrity, such that higher peak internal
knee extension moment will be associated with a lower percentage of aligned fibrillar structure of the dominant limb patellar tendon.
Hypothesis 3: We hypothesize that there will be a negative association between knee flexion
motion displacement and patellar tendon structural integrity, such that greater knee flexion motion displacement will be associated with a lower percentage of aligned fibrillar structure of
the dominant limb patellar tendon.
Hypothesis 4: We hypothesize that there will be a negative association between vertical ground reaction force loading rate and patellar tendon structural integrity, such that increased loading
Aim 3: Determine if patellar tendon structural integrity can be predicted based on a series of independent variables pertaining to training load characteristics and landing kinematics and
kinetics in male collegiate basketball and swimming athletes.
Hypothesis 1: We hypothesize that there will be a significant predictive value between the following biomechanical variables and patellar tendon structural integrity, such that higher values of these variables will statistically significant predictor of patellar tendon structural
integrity of the dominant limb patellar tendon:
• Peak Vertical Ground Reaction Force
• Loading Rate (Time between IGC and toe-off)
• Peak Internal Knee Extension Moment
• Peak Knee Flexion Angle
• Total Knee Flexion Displacement
Hypothesis 2: We hypothesize that there will be a positive predictive value between training load volume and patellar tendon structural integrity, such that increased training volume will
Patellar Tendon
Stuctural
Integrity
Volume of Training LoadTime Spent Dry-Land Training
RPE during Training/Competition
Peak VGRF Loading Rate Peak Internal KEM Peak Knee Flexion
statistically significant predicter of patellar tendon structural integrity of the dominant limb patellar tendon.
Hypothesis 3: We hypothesize that there will be a positive predictive value between dry land training and patellar tendon structural integrity, such that increased duration of dry land training will present as a statistically significant predicter of patellar tendon structural integrity of the
dominant limb.
Hypothesis 4: We hypothesize that there will be a positive predictive value between rate of
Chapter II: Literature Review
Patellar tendon abnormalities are misunderstood musculoskeletal condition. Pathology is defined as “an overuse injury that involves pain at either the proximal or distal aspect of the
patellar tendon, commonly associated with a decrease in functional ability.”26 Due to its chronic
nature athletic participation may not be restricted, yet it’s shown a significant impact on
performance. Patellar tendon abnormalities are most prevalent in dynamic, high velocity sports, specifically volleyball and basketball.11,27 Repetitive plyometric activity, such as jumping, leads
to increased demand from lower extremity musculature causing abnormal stress through tendon
tissue. 6,28 There is an estimated 20% incidence rate in athletic population.26 Factors such as type
of training, training load, and movement mechanics have all shown to effect the development of PTA.5,29,30 This review will look into the role that each of these play in development of tendon
tissue.
Etiology
PTA are thought to originate from an imbalance between intrinsic changes and external
load.3 Tendon has the ability to adapt to a mechanical load, with intensity, frequency and
volume all influencing structural change.31 In this paper, it will be referred to as “tendon load”.
Athletes experience a range of training load between their training seasons, leaving them more susceptible of developing pathology.32
Sports Specific
and basketball athletes. They found that 13% of the participants developed symptomatic patellar tendinopathy over a three-year period. Combining physically demanding work (i.e. squatting,
lifting, mentally tasking) with either sport increased risk for pathology.13 Results suggested that
while total training hours between participants did not differ, those who developed pathology reported increased volume of plyometric activities during training hours.11 Biessling et al.35
reported up to 45% of volleyball players will display pathological symptoms at some point throughout their athletic career. It’s been hypothesized that early specialization in plyometric
load could predispose an athlete to structural changes compared to a multi-faceted regimen.10
Low-impact, high volume sports such as swimming show a high prevalence for chronic conditions. Their imposed training philosophy transmits forces and loads differently due to the
aquatic environment. Watanabe et al.36 studied how a swimmer’s horizontal posture through
activity both transmits and resists force in water. Buoyancy torque, breathing techniques and
drag resistance all contribute into a swimmer’s ability to maintain position through motion. Kilani et al. compared the ground reaction force of three athletic positions: a swimmer starting off the block, a sprinter starting off the block, and a volleyball block jump. The volleyball
vertical jump produced a greater GRF impulse than the other take-offs. Swimming starts get swimmers off the block slower than sprinters and volleyball players, but cover a greater
horizontal distance covered. This is due to their constant linear momentum. Force absorbed through aquatic environments transmit through the body different than a land-based sport.
Training Load
Training load is directly associated the development of chronic pathologies.4 Rosengarten
et al.19 demonstrated that tendons produce responsive inflammation to micro-bouts of increased
training. Tendon changes observed following a 4-day period of high volume training in
extra-cellular matrix. Increased inflammatory tendon response results following acute activity without compromising the integrity of tendon collagen structure.19 Plyometrics are effective in
increasing muscular power generation. High velocity muscle contractions rapidly stimulate mechanical loading signals, called mechano-transducers through the patellar tendon.12 Quick,
explosive movements such as jumping and squatting elicit muscular and tendon development.
Muscle, tendon collagen and the extracellular matrix network are known to respond to altered levels of physical activity.37 While both tissues respond to a mechanical stimulus, muscle adapts
to increased load sooner than tendon. Following an acute bout of high training load, muscle will be able to create the same or greater force. Tendon tissue however is expected to sustain
increases in muscular force to create motion. Tendon maladaptation will follow leading to
abnormalities through the structure. 1,2,32 Whereas a single episode of exercise has little effect on
the level of tendon adaptation, prolonged exercise or weeks of training can increase tendon
collagen turnover and lead to a pathological state.37
Plyometric Loading
The term “eccentric strength” refers to the ability of a muscle to produce force as it is
lengthening. The quadriceps function eccentrically when the knee is flexing. During the landing
phase of a jump, rapid eccentric contraction from the quadriceps is required. This type of contraction places high tensile stress on the patellar tendon. High energy tasks such as a jump landing require strong eccentric control from the quadriceps. This creates an internal knee
extension moment which can effect motor unit recruitment from antagonist musculature, coordinated contraction of the quadriceps, and firing frequency of muscle fibers from both
structures.1,20,38 Knee extension results in inferior movement of the patella, and knee flexion
causes superior migration of the patellar. This superior migration partnered with a strong
being a main component in plyometric exercise, it is important that the clinician understands the different loads and stresses that the tendon is experiencing at different phases of the
jump-landing cycle. Individualizing athletes’ training, monitoring changes in symptoms and adjusting training load is essential to maintain appropriate distribution of load through sport. Addressing this prior to any significant change in training load can increase muscle-tendon conditioning and
enhance kinetic chain utilization.32 Continuum of Tendon Pathology
Several models have been developed to describe tendon pathology, each allowing for a
better understanding of tendon pathology, treatment and prevention.3 It’s come into question if
pathological tendon damage occurs along a continuum, and possibly even reversible. Cook et al.3
believes there are three phases of tendon pathology: reactive tendinopathy, tendon disrepair, and
degenerative tendinopathy. While each are presented as separate stages, there is continuity between the three.
Reactive Tendinopathy
Reactive tendinopathy is a result of a short-term adaptive thickening of a portion of tendon that acts to reduce stress and allow adaption to compressive loads.3 This differs from
typical tendon reaction to tensile load in that it increases cross sectional area as a whole, rather
than just an increase in stiffness3,20 It results from acute overload or a direct blow to the structure,
such as occurs during the first days of practice or in three consecutive heavy training days.
Tissue response is a homogeneous, non-inflammatory response that results in metaplastic changes in cellular proliferation. It is important to note that collagen integrity is maintained
Tendon Disrepair
Tendon disrepair is the second stage of the continuum. During this phase, there is an attempt at tendon healing.3 It is characterized by an overall increase in chondrocytes resulting in
separation of collagen and disorganization of the cellular matrix. It may present with an increase in vascularity, thickness and neuronal ingrowth.3 Imaging presents with discontinuity of collagen
fibers and a “swollen” appearance through the structure. Potential for reversibility exists during
this stage with appropriate load management and exercise to stimulate matrix restructuring. The frequency, volume or length of time over which load has been applied (ie, months or years of
overload) determine the prognosis from this stage.3
Degenerative Tendinopathy
The final stage is considered degenerative tendinopathy. It presents with areas of
cellularity, matric disorganization, neo-vessels, and little collagen regeneration. Imaging presents
with islands of degenerative pathology interspersed between normal and degenerating tendon. With little chance of reversibility, if a degenerative tendon is placed under a high load rupture is
likely. Research shows that 97% of tendons that rupture had reached degenerative state.3,39
Ruptures represent end-stage of degeneration, supporting the non-reversible nature of the continuum32. It is important to note that reversibility is possible between reactive tendinopathy
and tendon disrepair. Longitudinal studies show that between 10% and 30% of elite volleyball player’s tendons reflected hypoechoic tissue when imaged at baseline and at the conclusion of
their season. However at their follow-up screening, most returned to their normal state, reflecting that reversibility is possible through the early stages.33,39
It is not uncommon for tendon to progress to a degenerative state and not exhibit painful signs or symptoms. Cook et al.27 found that 14% of adult basketball players and 24% of
of knee pain. Diagnostic tools, such as Ultrasound Tissue Characterization (UTC), allow
clinicians to determine is at risk of developing tendon pathology based on the structural integrity
of the structure.20 Pathology can exist for years without causing pain, leading researchers to
question whether is it magnitude or response to load that is responsible. UTC allows
quantification of tissue quality and can objectively measure a tendon response to acute load.32,33
This can allow for better care and load management throughout competitive season.
Diagnosis
Accurate diagnosis of patellar tendinopathy is based upon thorough clinical examination.
Intrinsically the presence of a hypoechoic region and/or increased cross-sectional area on sonographic ultrasound can be used diagnostically. 40,41 Identifying pain patterns, quantifying
structural qualities, and assessing physiologic changes within tissue will provide an
understanding of loads effect on tendon structure.17,20,23 Diagnosis is difficult due to obscurity of
symptom presentation. Presence of pain is not considered necessary for a tendon to be considered pathological.17 Cook et al.3 demonstrated that 2/3 of patellar tendons that were
considered degenerated presented without pain. Assessment
The most common finding with tissue injury is pain. Identifying and quantifying pain through subjective outcome measures allows clinicians to track any changes, progress or trends when a patellar tendon symptoms present3,33 Self-report questionnaires such as the Victorian
Institute of Sports Assessment (VISA-P) and Visual Analog Scale (VAS) are the gold standard for assessing a patient for patellar tendon abnormailities.42,43 Both assessments are proven to be
valid and reliable for assessing patients with patellar tendinopathy.40,44 The questions of the
VISA scale that test functional performance distinguish this measurement tool from others and
jumper’s knee.43 Included with the VISA-P assessment is a single-limb (SL) decline squat, where
the individual is instructed to perform a decline squat on a 45 slant board. The tendon is
provocatively loaded through an eccentric quadriceps contraction to fully evaluate the perceived tendon response. The motion creates an eccentric quadriceps contraction, and targets to
reproduce painful symptoms.40 Pain is the clinical factor we seek to change through treatment
and rehabilitation, and an improvement indicates treatment success.3
Tendon Morphology
Secondary to pain, tendon tissue quality is necessary to consider when assessing for PTA. Fiber type, tendon thickness, and the extracellular matrix determine the integrity of tendon
structure. Abnormal tendon cells will produce signals that upregulate the production of protein and pain receptors. This results in an influx of inflammatory regulators, vascular vessels, and
collagen producers. All signals acutely increase neural and pain sensitivity.32
Cross-Sectional Area
An increase in tendon thickness can also indicate internal mechanical stress to the structure. Mersmann et al.2 found that during late adolescence, hypertrophy of the PT led to
mechanical strengthening and increased stiffness of the tendon in relation to the morphological development of the quadriceps. They concluded that a larger cross-sectional area is a major
mechanism leading to increased stiffness and thus tendon pathology. Typical tendon response to load is a short bout of stiffening to tensile loads, followed by eventual return to normal state. Short-term adaptive responses in pathological tendon include a homogeneous thickening of the
portion of tendon under stress, increasing CSA and allowing adaption to compression.3,32 Mann
et al.25 found that direction of an applied load can affect where the tendon is more susceptible to
tendon abnormalities (PTA). The areas of tendon that experience the most tensile force will respond with the most cellular proliferation, and therefore a larger CSA comparably. Athletes are
considered to have a PTA if a hypoechoic area is evident on scans both longitudinally and transversely.8
Neovascularization
Neovascularization is the formation of new blood vessels in tissue, typically indicative of
tissue overload or damage.45 Imaging techniques are able to show vascular changes that develop
in the extracellular matrix. Alterations, such as neovessels, in the extracellular matrix occur
according to loads leading to stiffer tendon structure.44 Hiksrud et al.16 demonstrated that the
presence of neovessels in abnormal patellar tendons was associated with more pain than in abnormal tendons without. Neovascularization upregulates the release of proteins and signals that induce cellular proliferation, therefor decreasing tendon’s tolerance to load. Cook et al.39 in a
cohort of symptomatic and asymptomatic volleyball players, reported significantly lower VISA-P scores in patients with abnormal tendons with neovascularization than in patients with
abnormal tendons without neovascularization. This is believed to occur along a continuum where if cellular dysfunction begins to compromise matrix structural integrity, then tendon damage
would be irreversible.3,46 To prevent further matrix damage, appropriate progression of loads is
essential to maintain integrity of the tendon matrix.46 Lower Extremity Biomechanics
Assessing lower extremity motion during functional tasks is crucial for evaluating restrictions. Observing movement through the lower extremity and trunk identifies muscular
Lower Extremity Musculature
A relationship exists between the quadriceps and hamstring group to balance loads through the lower extremity. The patellar tendon is the most distal attachment of the quadriceps
muscle group. It is the main structure that transmits force from the powerful muscle to bone. The hamstring muscle group has three musculotendinous attachments to evenly distribute muscular force and load. Haddas et al.28 suggested that the quadriceps fatigue faster than the hamstrings
due to decreased efficiency transferring loads through the knee. Thirty-two participants were instructed through a fatigue protocol utilizing free body-weight squats with 15% body weight
until failure. Results showed fatigue produced a greater maximum knee-flexion moment, reflecting an alteration in the shock-absorbing mechanism at the knee joint. Increased knee flexion moments created high moments of compressive force through the PT, subjecting it to
additional stress. The fatigue protocol effected the strength and control of the quadriceps more so than the hamstrings. A decrease in gross knee extension moment was experienced. 47–49
Similarly, Crossley et al.33 found athletes with patellar tendinopathy present with decreased knee
extension torque through an explosive jump. Their ability to efficiently activate their quadriceps to explode through the motion is attributed to muscular inhibition.47 The compressive forces of
the tendon through jump countermovement (knee flexion) inhibits the quadriceps to contract appropriately.
Muscle imbalances impact the musculotendinous junction.50 During adolescence, muscle
develops at a rate that is directly relates to bone growth. Tenocytes are the cells responsible for the metabolic, reproductive, and mechanical responses that occur in musculotendinous units.
This includes the formation and turnover of proteins and growth factors within the extracellular matrix.51 Mersmann et al.2 found that dynamic changes in tenocytes through the quadriceps
imbalance between tenocytes and muscle fibers. The mechanism of skeletal muscle adapting faster than its tendon is known as “Sports Specific Loading”.2 The result is a muscle capable of
the strength of a developed knee extensor with an adolescent, immature patellar tendon.
Lower Extremity Kinetics and Kinematics
Tendons have a unique ability to adapt through alterations in the extracellular matrix according to changes in mechanical loads.44 Dynamic movements, such as an overhead squat or a
jump landing task, are used in laboratory settings to identify movement patterns that put individuals at risk of lower extremity injury. Motion is evaluated using a tri-planar system.52
Side-to-side (frontal plane), forward-backward (sagittal plane), and rotational (transverse) motion place load and stress on the lower extremity. If these stresses are not distributed appropriately, a higher risk of injury exists.52 Mann et al.44 utilized a cohort of 22 male
basketball players to determine the risk factors through a drop-landing task that can predict the incidence of patellar tendon abnormalities. Landing with more hip extension creates greater sagittal plane motion relative to the base of support increasing tensile and compressive loads
through the tendon. In addition, athletes presenting with increased knee flexion at initial contact presented with patellar tendon abnormalities. Landing with greater knee flexion increased
compressive loading on the tendon. This is attributed to an increased quadriceps force ratio, with resultant tensile load through the lengthened tissue. Crossley et al.33 found that individuals
presenting with increased normalized knee extension torque were more at risk of presenting with
patellar tendon abnormalities.33 Similarly, Rosen et al.23 indicated that maximum knee flexion
displacement through a drop landing task had a large effect size, and pathological participants
demonstrated an 8 degree decrease in total angular displacement compared with controls. This reflects that landing “stiff”, or with decreased knee flexion displacement, puts an individual `at
increased knee flexion through landing compared to healthy controls. It was hypothesized that landing flexed places the tendon in a lengthened position, increasing tensile loads.
Landing Error Scoring System
Functional movement assessments are a vital clinical tool when determining who is at risk for injury due to movement patterns. There are a range of evaluation methods that clinicians can utilize in a sports medicine setting. The most common include a dynamic jump landing task,
dynamic postural control exercises, Functional Movement Screening (FMS), and an overhead squat task. Each tool has its own set criteria to assess where an athlete may be weak, making it
easy to provide feedback and identify problems in the musculoskeletal system. Movement quality is determined by a multitude of factors including poor neuromuscular control, balance deficiencies, and muscle imbalances54–56. The Landing Error Scoring System (LESS) assesses
jump-landing biomechanics of an individual as they jump forward off a box, and scores any improper movement patterns as an error56. The subject is allowed three trials, each of which is
assessed and scored for movement errors. The LESS has demonstrated good to excellent
interrater and intrarater reliability, making it useful to implement as a screening tool to identify improper landing mechanics.57,58 It has also been successful in evaluating changes in landing
technique after an injury prevention program59.
Understanding and utilizing movement quality screenings such as the LESS when treating PTA will allow clinicians to relate specific movement patterns to symptomatic tendons
and assess how change in functional movements can elicit change in pathology. The LESS is a useful clinical assessment tool for identifying high-risk movement patterns through the lower
extremity.60 Red flag errors include increased trunk-flexion, hip flexion displacement, initial
contact foot position, and knee flexion displacement. LESS screening demonstrates that
Poor movement quality through the lower extremity as a whole increases ones injury risk susceptibility. 52,59,60 While the LESS is unable to capture 3-dimensional biomechanical
movement patterns, it has still shown strong concurrent validity. Significant differences in movement quality between those with high or low LESS scores respectively demonstrate the tests ability to predict who is more at risk for lower extremity injury.52 Research shows that a
higher LESS score indicates poor movement quality and high risk of injury.61 With a high
predictive ability, this assessment test serves as a feasible tool for clinicians attempting to assess
biomechanical errors in their patients.
Diagnostic Imaging
Traditional Ultrasound
Ultrasound has been shown to be a reliable and valid tendon examination method.8 It has
shown success identifying tendon abnormalities between similar groups of subjects. They’ve
shown transmission techniques that have potential to provide non-invasive estimates of human tendon loading and response to load.17 Ultrasound is a sensitive indicator of tendon injury, and
can track the recovery of tendon properties that present to be abnormal.17 It is not able to present
the degree to which tendon structure has degenerated. It is able to show abnormality, but not severity.8,16,17
Ultrasound Tissue Characterization
Ultrasound Tissue Characterization (UTC) is an assessment tool used to quantify the structure of tendon based on the integrity of the echo pattern displayed through ultrasound
analysis. Tendon fibrillar alignment, tendon volume, and cross-sectional area are all considered in the algorithmic enhanced ultrasound analysis.31 The device uses an ultrasound beam allowing
for 3-D imaging, semi-quantification of structure, and calculation of tendon dimensions.20 UTC
progressing towards a pathological state. It is a diagnostic tool that is capable of objectively measuring tendon quality and determine if portions of tendon are on a spectrum between normal
and pathological. UTC is often used as a technique to track tendon integrity through different rehabilitation modalities, potentially making it a great tool to further future research regarding tendinopathy.19,20
UTC quantifies tissue structure using four different stages. The device uses an algorithm to correlate pixel images that reflect uniformity of the tendon and expresses it as a color in the
tendon. Green tendon represents healthy tissue, black represents pathological tissue, and blue/red identifies tissue that is at risk of becoming pathological32. Cook et al.32 demonstrated that this
approach is valid, reliable and capable of detecting tendon response to overload. Green, blue, red
and black tissue representation reflect echo type I, II, III and IV, respectively20. Echotypes I and
II correspond to high stability tendon with an aligned fibrillar structure. Types III and IV
represent a disorganized, non-parallel fiber arrangement. These are considered pathological tissue cells20. Research shows that quantification of the UTC echo-types should be performed by
the same investigator, and should remain blind to participant, clinical history and tendon
classification throughout the interpretation of tendon echo-type to reduce risk of bias20,46. Clinical Significance
A thorough evaluation is necessary when identifying a patient with patellar tendinopathy. Inconsistency of interaction between symptoms, function and structure makes diagnosis difficult
for clinicians.11,20,23 Tendinopathy is a load induced pathology that responds well to activity
modification. A mismanagement of load results in maladaptation of tendon structure, and
potential pathology.32
The literature concludes that a multitude of factors contribute to patellar tendon structural
maladaptation due to repetitive high velocity eccentric moments that are mimicked through sport.27,62 Volume and frequency, typically quantified by number of training sessions and hours
spent, has proven to be critical in the development of abnormal tendon tissue.13 Research has
shown that specific movement patterns such as decreased sagittal plane motion through landing and decreased knee extension torque may be lead to development of pathology.32,33 What’s not
clear in the literature is how lower extremity biomechanics translate to pre-existing tendon abnormalities. Assessing baseline lower extremity mechanics and comparing them to structural
Chapter III: Methods Study Design
A cross-sectional study design was used to assess the relationships between patellar tendon structure, movement quality and training load in male collegiate basketball and swimming athletes. All members of the University of North Carolina at Chapel Hill Junior Varsity Men’s Basketball Team and Varsity Men’s Swimming Team were invited to participate.
Data was collected approximately 1-2 weeks prior to the initiation of each team’s formal practice
and competition schedule. All data collection sessions were completed in the Sports Medicine Research Laboratory on the campus of the University of North Carolina at Chapel Hill. All
participants were required to read and sign an informed consent document approved by the University’s Institutional Review Board (IRB #16-1932) prior to data collection.
Participants
Twenty-six male Junior Varsity Men’s Basketball (n=13) and Varsity Men’s Swimming
athletes (n=13) from the University of North Carolina at Chapel Hill were recruited and screened to participate in the research study. Equal numbers of participants were enrolled from the Junior
Varsity (JV) Men’s Basketball team (n=15) and the and Varsity Men’s Swimming team (n=15). All eligible participants were between the ages of 18-28. Participants were excluded if they have a history of lower extremity surgery or have sustained a lower extremity injury in the last 6
months that prevents them from completing any of the assessments. Participants were asked to complete a series of questionnaires addressing exclusion criteria (Table 1). Anthropometric data
using a stadiometer (Detecto Model 758C, Cardinal Scale Manufacturing, Webb City, MO, USA),and weight measured in kilograms (kg) using a digital scale (Perspective Enterprises,
Portage, MI, USA).
Self-Reported Function & Training Load Questionnaires
All participants reported to the laboratory for a single data collection session. The purpose and methods of the study were reviewed; participants were aware that participation in
this study is strictly voluntary, and that participation in the study had no influence on their eligibility for participation in their sport. Upon voluntary agreement to enroll, participants were
asked to sign an informed consent form. Following consent, subjects were asked to complete a series of questionnaires. To determine training history, questions were specific to address
training characteristics, sports specific activity and musculoskeletal injury history within the past
calendar year. (Appendix 1). Subjects completed the Victorian Institute of Sport Assessment-Patella (VISA-P) overuse injury questionnaire. This is a validated measure for assessing anterior knee pain (Appendix 2).6,42,43 A single leg decline squat (SLDS) was performed after completion
of paper-based questionnaire responses. The single‐leg decline squat on a decline board of ⩾15°
results in a 40% higher knee extension moment, thus increasing patellar tendon force, compared
to the same exercise on a flat floor.11Subjects used a 25˚ decline board to perform a unilateral
SLDS to approximately 60˚ of knee flexion, or until the onset of symptoms, whichever occurs
first. Pain was quantified and recorded using a visual analogue scale (VAS) and a pain-mapping diagram that allows participants to locate the site(s) of any pain during the SLDS (Appendix 3). SLDS was performed on subject’s dominant and non-dominant limb. Responses were gathered
and divided into basketball athletes and swim athletes. Descriptive statistics were computed to assess differences in loading history, injury history, and loading volume between basketball and
patellar tendon structural integrity. All questionnaires were completed via hard-copy, using pen and paper provided by investigators.
Biomechanical Data Collection
Instrumentation
The electromagnetic motion capture system (MotionStar, Ascension Technology
Corporation, Burlington, VT) with corresponding Ascension Flock of Birds electromagnetic trackers, interfaced to a nonconductive force plate (Type 4060-08; Bertec Corporation,
Columbus, Ohio) was used to measure lower body kinematics and kinetics, respectively. Sampling frequency for kinematic data was set at 140 Hz, and set 1400 Hz for kinetic data. Biomechanical variables were quantified using the Motion Monitor for Research v8.0
(Innovative Sports Training, Chicago, Illinois) motion analysis software package.
The subjects were asked to stand on the testing platform in a neutral position, with each
foot in the center of the respective force plate. Electromagnetic sensors were positioned unilaterally on the subject’s dominant leg as follows:
• Anterior shaft of the third Metatarsal
• Midshaft of the Medial Tibia
• Lateral aspect of the of the Femur
• Midline of the Sacrum
Sensors were secured with double-sided tape, pre-wrap, and white athletic tape. Sensor leads were then gathered in a Velco-Belt wrapped around the subject’s waistline and gathered to the lateral side of the subject to ensure they do not impede natural movement during the testing
procedures.
A right-hand coordinate system was used to establish world and segment axis system in
is superior. Lower extremity joints (ankle, knee, hip) were defined based on digitization of bony landmarks to calculate the midpoint of each joint. The landmarks utilized were as followed:
• Right and Left ASIS
• Bilateral Medial and Lateral Epicondyles
• Bilateral Medial and Lateral Malleoli
• Bilateral Proximal Phalanx of the Anterior Aspect of the Second Metatarsal
The ankle joint center was defined as the midpoint between the medial and lateral malleoli, knee
joint center as the midpoint between the medial and lateral femoral epicondyles, with the hip joint center estimated from the right and left anterior superior iliac spines using the Bell method.64
Jump-Landing Task
All subjects performed 5 trials of a standardized jump-landing task. The task required the individual to jump forward off a 30-cm-high box, set at a distance of 50% of their height away
from the front edge of the force plates. Participants were instructed to land with one foot in the center of each respective force plates, and immediately jump straight up for maximal vertical
height. The investigator ensured that subjects started the jump in a neutral position (i.e., feet shoulder-width apart and toes pointing forward at the edge of the box) and jumping as high as they could after their initial landing from the box. No other verbal instructions were provided so as not to bias the participants’ natural movement pattern. A successful jump was characterized
by both feet simultaneously leaving the box, jumping forward off the box, reaching the target
landing area below, and completing the task in a fluid motion (no pause in movement of body’s center of mass after making contact with the ground until takeoff for subsequent jump). If a jump
Phase Identification
Biomechanical variables for the subject’s dominant limb were evaluated across the entire stance phase. The stance phase was defined as the time from initial ground contact (IC), or the
time point when the vertical ground reaction force (vGRF) exceeds 10N, until toe-off (vGRF <10 N).65 The stance phase can be further divided into the loading phase (IC through peak knee
flexion position = the first 50% of the stance phase) and the propulsive phase (peak knee flexion
position to toe-off = the second 50% of the stance phase). Peak knee flexion position was defined as the time point when the knee reached its maximum flexion angle during the stance phase.
Data Processing
We estimated the 3-dimensional coordinates of the lower extremity bony landmarks
using the Motion Monitor for Research v8.0 (Innovative Sports Training, Chicago, Illinois) motion analysis software package. All kinematic data was smoothed using a 14 Hz fourth-order
low-pass Butterworth filter. All kinetic data was interpolated and synchronized with the raw 1400 Hz ground reaction force data. Knee joint motion was defined as the motion of the shank
segment relative to the thigh segment using a Cardan angle rotation sequence of Y ((+)
flexion/(−) extension), X′ ((+) varus (or tibial adduction)/(−) valgus (or tibial abduction)), Z″ ((+)
internal rotation/(−) external rotation). Hip joint motion was defined as motion of the thigh segment relative to the pelvis segment using a Cardan angle sequence of Y ((+) extension/(−)
flexion), X′ ((+) adduction/(−)), Z″ ((+) internal rotation/(−) external. The following kinematic
variables during the loading phase of the jump landing task were assessed: knee flexion angle at initial ground contact (IGC), maximum knee flexion angle during loading phase, knee flexion
Dependent Variable Calculation
The middle three trials from the five jump-landing trials were averaged and utilized for analysis. Four biomechanical variables were assessed using the Flock of Birds Motion Capture
System. Knee flexion displacement was calculated as the difference between the knee joint angle
() at initial ground contact and maximum knee joint angle during the loading phase (enter
formula here). The peak internal knee extension moment was defined as the peak internal knee extension moment during the loading phase. This was represented as a (+) extension // (-) flexion
moment around the knee. It is dependent not only upon the size of the perpendicular force exerted by the quadriceps but also upon its distance from the knee joint center. Peak vertical
ground reaction force (Peak VGRF) was calculated as largest value of VGRF during the stance phase (time from initial contact until toe-off). The loading rate of the vertical ground reaction
force (LR VGRF) as defined as the peak VGRF value divided by time from initial ground contact to peak value (N/s2). Joint moments were normalized to the product of body mass (kg)
and height (cm). VGRF data was normalized to body mass (kg). All moments were reported as a
positive value. Means, standard deviations, 95% confidence intervals, and ranges for each dependent variable were calculated and reported.
Ultrasound Tissue Characterization
Ultrasound Tissue Characterization (UTC) is a valid and reliable clinical tool that
quantifies the structural integrity of tendon tissue.15,20,21,66 A UTC ultrasound scan of the patellar
tendon was taken prior to each participant’s biomechanical assessment. UTC scans were
performed by a single researcher with previous training using the device. Subjects lied supine on
a treatment plinth with their knee bent to approximately 90 of passive flexion to place adequate
tension through the patellar tendon for image quality.19–21A 10 MHz (focus: 1.3 cm, depth: 3
mounted in the tracking device with a motor-drive and built-in acoustic stand-off pad (UTC Tracker, UTC Imagine, Stein, The Netherlands). The tracking device ensures a consistent
position of the transducer through the scan, as the transducer is not able to tilt or rotate once secured. The investigator marked the inferior pole of the patella as the origin of the scan and the tibial tuberosity as the end. Ultrasound coupling gel was applied to the transducer and the participant’s anterior knee.
To take the scan, the investigator placed transducer perpendicular to the long axis of the
patellar tendon (Appendix 4). Once the inferior patellar pole was visualized on the laptop screen and the transducer centered in both the sagittal and transverse views, the scan was initiated by the investigator pushing “start”. The tracking device automatically movedthe transducer along
the long axis of the tendon, from the inferior patellar pole to the tibial tuberosity, capturing contiguous transverse grey-scale images at intervals of 0.2mm. One UTC scan was collected
bilaterally for each participant. All scans were saved to a secure laptop computer using the participant’s de-identified study identification number.
Each scan was acquisitioned to generate a 3-dimensional data block using UTC software
(UTC 2011, UTC Imaging).66 UTC algorithms automatically quantify the stability of pixel
brightness over transverse images of the tendon into four echo-types (I-IV): (I) intact and aligned
tendon structure, (II) less waving tendon structure, (III) mainly fibrillar tissue, and (IV) mainly amorphous matric with loose fibrils and fluid.66 The patellar tendon image was analyzed from
the inferior pole of the patella to 20 mm distally with percentages of aforementioned echo types
in this region of interest (ROI) being calculated. Van Ark et al.31 found that this ROI consistently
All scans were de-identified at the time of acquisition to ensure the image processing can be completed with the investigator blinded to participant and day of the scan. The patellar tendon
image was manually contoured by a trained investigator. Tendon borders were contoured manually at every 20 frames across the ROI. Once completed, contours were automatically interpolated between the ROIs by the UTC software, generating average percentages of each
echo-type for the total ROI and at each contour. Based on their stability/degree of tendon structure, four echo types will be discriminated.20,66 Percentages of type I, II, III, and IV were
classified for each scan. For this study, six values were used to assess patellar tendon structural integrity:
• % Type I
• % Type II
• % Type III
• % Type IV
• Aligned Fibrillar Structure (AFS, echo types I and II)
• Disorganized Tissue Structure (DIS, echo types III and IV)
The cross-sectional areas (CSA) of AFS and DIS were calculated for each transverse scan by manually multiplying the total CSA by the proportion of echo type I + II or echo type III + IV to determine total tendon volume. All percentages represented dependent variables representing
tendon structural integrity utilized during statistical analysis. Our study focused on tendon volume percentages of echo types I and II ; short-term structural changes in these echo types have been shown in previous studies examining acute structural change in response to load.19,31
Statistical Analysis
confidence intervals) were calculated for all participant demographic information and
questionnaire data, kinematic and kinetic dependent variables, and UTC variables. Statistical
significance for all tests were set at an a priori alpha level of α = 0.05.
The following statistical analyses were completed for each study aim:
• Aim 1: We used an independent samples t-test to assess for differences in patellar tendon
structural integrity between male collegiate basketball players and male collegiate swimmers. Mean % each specific echo type (Type I- Type IV), mean % of AFS and
mean % DIS for each cohort were assessed for a statistically significant difference. • Aim 2: We used a Pearson r correlation to measure the relationship between patellar
tendon structure and landing kinematic and kinetic variables. Values of % AFS for all subjects were associated with values for each of the following biomechanical dependent
variables:
o Peak VGRF
o Loading Rate VGRF
o Initial Internal KEM
o Peak Internal KEM
o Initial Knee Flexion Angle
o Total Knee Flexion Displacement
If association existed between patellar tendon structure and any of the dependent variables, we used partial correlations to control specifically for group to assess where an
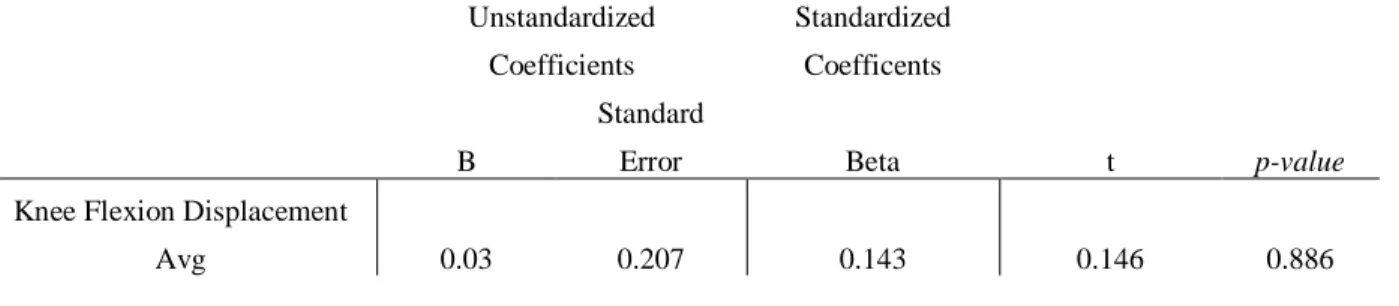
• Aim 3: We used a multiple linear regression model to evaluate the influence of sport,
loading history, and biomechanics on tendon structure. Tendon structure was our
continuous variable. Independent variables consisted of:
o Peak VGRF
o Loading Rate VGRF
o Initial Internal KEM
o Peak Internal KEM
o Initial Knee Flexion Angle
o Total Knee Flexion Displacement
o Training Volume per week
o Time Spent Training on Dry Land
o RPE during training/ competition
We assessed to see which, if any, of our independent variables can predict patellar tendon structural integrity. Partial correlations were used to control for group (basketball vs. aquatic) if
any positive predictive value is found between groups for those variables. A partial correlation determined if the positive predictive value exists specifically in the basketball cohort or the swim
Chapter IV: Results
Twenty-six participants were included in the final analysis. Two participants, one from
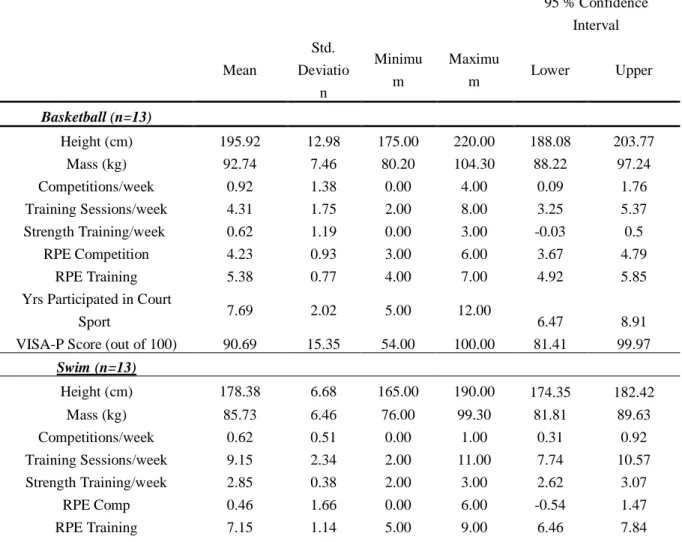
each cohort, were excluded from analysis due to lower extremity injury that occurring within six weeks prior to data collection. Participant demographics and training histories are outlined in
Table I. Height, weight, and descriptive statistics are represented for basketball and swim cohorts.
Table I: Descriptive Statistics of Study Participants
95 % Confidence Interval Mean Std. Deviatio n Minimu m Maximu
m Lower Upper
Basketball (n=13)
Height (cm) 195.92 12.98 175.00 220.00 188.08 203.77
Mass (kg) 92.74 7.46 80.20 104.30 88.22 97.24
Competitions/week 0.92 1.38 0.00 4.00 0.09 1.76
Training Sessions/week 4.31 1.75 2.00 8.00 3.25 5.37
Strength Training/week 0.62 1.19 0.00 3.00 -0.03 0.5
RPE Competition 4.23 0.93 3.00 6.00 3.67 4.79
RPE Training 5.38 0.77 4.00 7.00 4.92 5.85
Yrs Participated in Court
Sport 7.69 2.02 5.00 12.00 6.47 8.91
VISA-P Score (out of 100) 90.69 15.35 54.00 100.00 81.41 99.97
Swim (n=13)
Height (cm) 178.38 6.68 165.00 190.00 174.35 182.42
Mass (kg) 85.73 6.46 76.00 99.30 81.81 89.63
Competitions/week 0.62 0.51 0.00 1.00 0.31 0.92
Training Sessions/week 9.15 2.34 2.00 11.00 7.74 10.57
Strength Training/week 2.85 0.38 2.00 3.00 2.62 3.07
RPE Comp 0.46 1.66 0.00 6.00 -0.54 1.47
Yrs Participated in Court
Sport 2.54 2.40 0.00 7.00 1.09 3.99
VISA-P Score (out of 100) 98.54 2.99 90.00 100.00 96.73 100.34
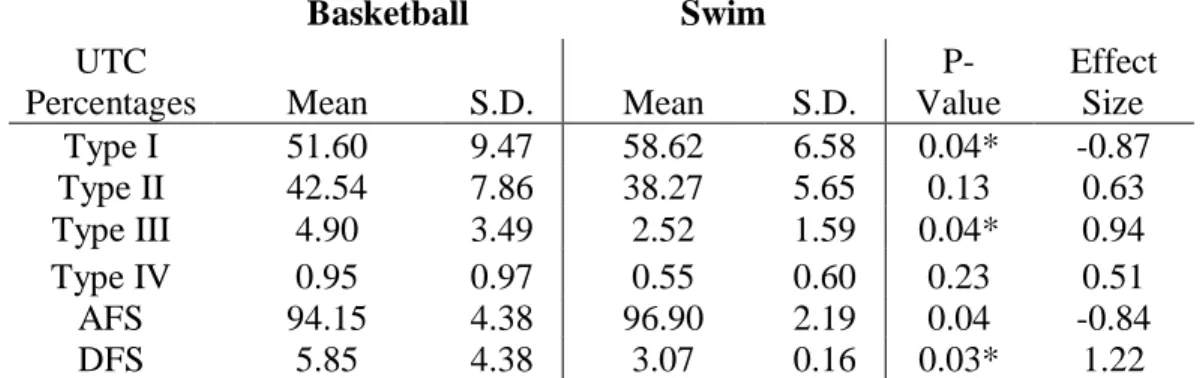
UTC Characterization
The primary objective for Aim 1 was to explore differences in patellar tendon structure, quantified by Ultrasound Tissue Characterization (UTC) between basketball and swimming
athletes. The variables of interest were as follows: % Echo Type I-IV, % AFS (or the
combination of percentage of Type I & II), % DFS (or the combination of the percentage of Type
III & IV). A significant difference was found between athlete groups in % of Type I fibrillar
structure (basketball: 51.6 % 9.47%; swim:58.62% 6.58%, p= 0.04), as well as % of Type
III fibrillar structure (basketball: 4.9 3.49%, swim: 2.52 1.59%, p = 0.04). A significant
difference was also found between percentage of AFS (basketball: 94.15 4.38%, swimming:
96.9 2.19%, p = 0.04) and percentage of DFS (basketball: 5.85 4.39%, swimming: 3.07
.16%, p=0.03), with basketball athletes presenting with a lower percentage of aligned fibrillar
structure and a higher percentage of degenerative fibrillar structure compared to swimmers. No significance was found between groups for the percentage of Type II (p=0.13) and Type IV
(p=0.23) alone. Results for Aim 1 analysis support our hypothesis that the basketball cohort would exhibit a significantly lower percentage of aligned fibrillar structure in their dominant leg compared to the swim cohort. Results from the comparison of UTC echo-types between sport
Table II: Descriptive Statistics comparing UTC Echo Types (%)
Basketball Swim
UTC
Percentages Mean S.D. Mean S.D.
P-Value
Effect Size
Type I 51.60 9.47 58.62 6.58 0.04* -0.87
Type II 42.54 7.86 38.27 5.65 0.13 0.63
Type III 4.90 3.49 2.52 1.59 0.04* 0.94
Type IV 0.95 0.97 0.55 0.60 0.23 0.51
AFS 94.15 4.38 96.90 2.19 0.04 -0.84
DFS 5.85 4.38 3.07 0.16 0.03* 1.22
*Indicates statistical significant at p < 0.05.
AFS = aligned fibrillar structure, DFS = disorganized fibrillar structure
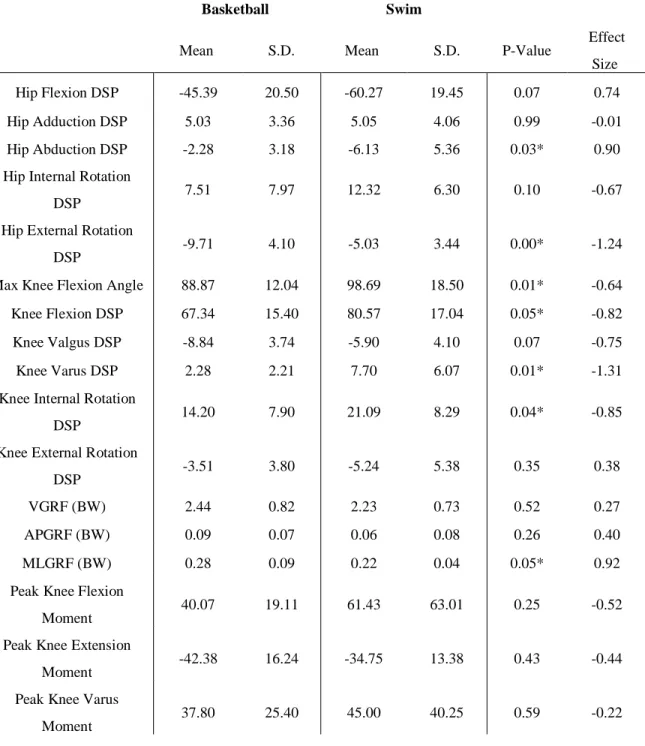
Biomechanics
Kinematic and kinetic variables are outlined in Table III. The primary kinematic
variables of interest were peak knee flexion angle and knee flexion displacement across the stance phase. The mean knee flexion displacement for the basketball cohort was less than that of
the swimming cohort (67.34 15.4 vs. 80.57 17.04, respectively; p=0.049). Additionally, there
was a statistically significant difference in peak knee flexion angle between cohorts (basketball:
88.87 12.04 degrees, swimming: 98.69 18.5 degrees; p=0.01), indicating that swim athletes
reached a greater maximum knee flexion angle during the stance phase of the jump landing task than basketball athletes. Further analysis found statistically significant difference in hip
abduction displacement (basketball: -2.28 3.18, swimming: -6.13 5.36, p = 0.033) and hip
external rotation displacement (basketball: -9.71 4.10, swimming: -5.03 3.44, p=0.004)
during jump landing task, with the basketball cohort demonstrating lesser hip abduction
basketball cohort presented with lesser knee varum displacement (basketball: 2.28 2.21,
swimming: 7.70 6.07, p=0.005), and lesser knee internal rotation (basketball: 14.2 7.9,
swimming: 21.09 8.29, p=0.04) during the jump landing task than the swimming cohort.
Table III: Descriptive Statistics comparing Biomechanical Variables
Basketball Swim
Mean S.D. Mean S.D. P-Value Effect
Size
Hip Flexion DSP -45.39 20.50 -60.27 19.45 0.07 0.74
Hip Adduction DSP 5.03 3.36 5.05 4.06 0.99 -0.01
Hip Abduction DSP -2.28 3.18 -6.13 5.36 0.03* 0.90
Hip Internal Rotation
DSP 7.51 7.97 12.32 6.30 0.10 -0.67
Hip External Rotation
DSP -9.71 4.10 -5.03 3.44 0.00* -1.24
Max Knee Flexion Angle 88.87 12.04 98.69 18.50 0.01* -0.64
Knee Flexion DSP 67.34 15.40 80.57 17.04 0.05* -0.82
Knee Valgus DSP -8.84 3.74 -5.90 4.10 0.07 -0.75
Knee Varus DSP 2.28 2.21 7.70 6.07 0.01* -1.31
Knee Internal Rotation
DSP 14.20 7.90 21.09 8.29 0.04* -0.85
Knee External Rotation
DSP -3.51 3.80 -5.24 5.38 0.35 0.38
VGRF (BW) 2.44 0.82 2.23 0.73 0.52 0.27
APGRF (BW) 0.09 0.07 0.06 0.08 0.26 0.40
MLGRF (BW) 0.28 0.09 0.22 0.04 0.05* 0.92
Peak Knee Flexion
Moment 40.07 19.11 61.43 63.01 0.25 -0.52
Peak Knee Extension
Moment -42.38 16.24 -34.75 13.38 0.43 -0.44
Peak Knee Varus
*Indicates statistical significance at p < 0.05
The primary kinetic variables of interest were as follows: VGRF, APGRF, MLGRF, and 3-dimensional knee angular moments. The mean VGRF for the basketball cohort was nearly
equal to that of the swimming cohort (2.44 BW 0.82 BW vs. 2.23 BW 0.73 BW, p=.052.)
No significant difference was found between groups. However, a significant difference was
found in the medial-lateral ground reaction force with the basketball cohort displaying greater
MLGRF compared to the swimming cohort (0.28 BW 0.09 BW vs. 0.22 BW 0.04 BW,
p=0.04). Peak knee extension moment (pKEM) was the primary internal knee moment of interest, and no significance difference was found in pKEM between basketball cohort and
swimming cohort (-42.38 BW 16.24 BW vs. -34.75 BW 13.38 BW, p=0.43). All kinetic
variables assessed are outlined in Table III.
The aforementioned biomechanical analysis provides insight into movement
characteristics for each cohort prior to analyzing tendon structure between groups (Aim 1) and assessing for correlation between structure and function (Aim 2). Our results indicate that during
a double-limb landing task, swim athletes undergo greater sagittal plane excursion. Prior research has demonstrated this result to have varying effect on patellar tendon structure. Rosen et al.23
showed less knee flexion displacement increases the strain on the patellar tendon. Mann et al.44
conversely presented greater sagittal plane motion increases the shear and compressive force Peak Knee Valgus
Moment -52.36 19.89 -87.96 80.53 0.14 0.71
Peak Knee Int Rot
Moment 27.72 14.02 32.58 37.41 0.67 -0.19
Peak Knee Ext Rot
acting upon the tendon, leading to patellar tendon structural abnormality. No prior research has addressed the impact of hip and knee rotation on patellar tendon structure. Our basketball cohort
presented with greater hip external rotation and lesser knee internal rotation, utilizing a lateral and posterior chain dominant landing strategy that could impact force through the tendon.
Correlational Analysis
The primary objective of Aim 2 explored the correlation between jump-landing
biomechanics and associated patellar tendon structural integrity. The variables assessed for correlation were % of each UTC echo-type, % AFS, % DFS and the following biomechanical
variables: Peak VGRF, Loading Rate VGRF, Initial Internal KEM, Peak Internal KEM, Initial Knee Flexion Angle, and Total Knee Flexion Displacement. No statistically significant
correlations existed between any of the biomechanical variables and any of the UTC echo-types,
%AFS or %DFS. Knee valgus displacement demonstrated statistically significant correlation within groups with the percentage of Type I and Type II tendon structure, indicating that as knee valgus displacement increases, tendon structural integrity decreases (Type 1 r=0.402 p=0.042:
Type II r= -.439, p= 0.025). Further analysis showed no other significant correlation between patellar tendon structure and biomechanical variables in this cohort. Results from the correlation