EVALUATION OF SIX CHROMOGENIC DIAGNOSTIC CULTURE MEDIA FOR A ONE HEALTH ESBL E. coli
INDICATOR SYSTEM FOR GLOBAL AMR SURVEILLANCE
Andy Koltun
A thesis submitted to the faculty at the University of North Carolina at Chapel Hill in partial fulfillment of the requirements for the degree of Master of Science in the Department of Environmental Sciences and
Engineering in the Gillings School of Global Public Health.
Chapel Hill 2018
Approved by:
Mark D. Sobsey
Megan Jacob
ABSTRACT
Andy Koltun: Evaluation of Six Chromogenic Diagnostic Culture Media for a One Health ESBL E. coli
Indicator System for Global AMR Surveillance (Under the direction of Mark Sobsey)
To facilitate multisectoral antimicrobial resistance (AMR) surveillance, the World Health
Organization (WHO) has proposed an integrated culture-based surveillance methodology for direct
quantification of extended-spectrum-β-lactam resistant (ESBL) Escherichia coli (E-Ec) in environmental
hotspots and for detection in other ‘One Health’ hotspots. We evaluated six candidate ESBL-selective agar media for E-Ec detection and quantification, quantification of E-Ec as a proportion of total E. coli,
and presumptive identification and characterization of E-Ec in raw sewage, poultry waste, and urban
surface water analyses. E-Ec quantification used standard membrane filtration (surface water) and
spread plating (other samples) methods. MALDI-TOF and VITEK analyses verified isolates’ identity and
AMR profiles. Results showed Tryptone Bile Glucoronic (TBX) medium was most sensitive for E-Ec
quantification overall (though not significantly so) and significantly more accurate in presumptively
identifying and characterizing isolates. These findings support adoption of this AMR indicator system
TABLE OF CONTENTS
LIST OF TABLES………viii
LIST OF FIGURES………...xiii
LIST OF ABBREVIATIONS………xv
CHAPTER 1: INTRODUCTION ... 1
CHAPTER 2: LITERATURE REVIEW……….4
Introduction ... 4
Practice and Policies of AMR Detection/Diagnostics and AST ... 4
AMR Hotspots and Cross-Sector Fate and Transport ... 6
Moving toward a Simple, Standardized One Health AMR Surveillance System ... 10
CHAPTER 3: OBJECTIVES AND EXPERIMENTAL DESIGN………..16
Objectives………16
Experimental Design……….17
CHAPTER 4: METHODS AND MATERIALS………..19
Introduction ... 19
Sampling Sites ... 21
Municipal Sewage ... 21
Smallholder Free Range Chicken Farm ... 22
Conventional Industrial Demonstration Chicken Farm ... 22
Project Timeline ... 23
Protocol and Analysis Schedule ... 23
Media Preparation ... 24
Sample Collection, Transport, and Storage ... 25
Direct, One-Step Membrane Filter Method... 26
Direct Spread Plating Method ... 26
Serial dilutions ... 27
Counting and Analysis of Bacterial Colonies ... 28
Colony Visualization and Enumeration ... 28
Bacteria Concentration (CFU/100 mL for water/wastewater samples, CFU/g for poultry wastes) ... 29
Calculations for Proportions of Presumptive Antimicrobial Resistant Bacteria ... 30
Average, Standard Error, and Confidence Interval Calculations ... 30
Normality Determination ... 31
ANOVA Analyses ... 31
Unpaired t-Test ... 32
Fisher’s Exact Test ... 32
Selection, Purification, and Isolation of Colonies ... 32
Identity Confirmation via MALDI-TOF MS ... 33
Antimicrobial Susceptibility Testing by VITEK 2 Analysis ... 34
CHAPTER 5: RESULTS ... 36
Raw sewage ... 36
Upstream surface water (Morgan Creek Upstream) ... 44
Downstream surface water (Morgan Creek Downstream) ... 54
Comparing Morgan Creek Upstream vs Downstream surface water ... 59
Community (smallholder) farm poultry manure ... 62
Conventional farm broiler pen litter ... 67
Comparing community farm poultry manure vs conventional farm broiler chicken pen litter ... 71
Summary of ESBL E. coli Concentrations and Presumptive ESBL Resistance Proportions by Candidate Medium and Sample Type ... 75
Confirmatory analyses by candidate medium ... 76
CHAPTER 6: DISCUSSION ... 86
Overview ... 86
By Objective ... 89
Additional Methods Considerations ... 97
Limitations ... 98
Future Work ... 101
APPENDIX 1: WEEKLY SAMPLING CONCENTRATIONS AND PROPORTIONS OF
PRESUMPTIVE ESBL RESISTANCE BY SAMPLE TYPE AND MEDIUM/MEDIA PAIR………..106 APPENDIX 2: SPECIATION AND ANTIMICROBIAL RESISTANCE PROFILE DATA FOR
ISOLATED TARGET AND NON-TARGET ORGANISMS ACROSS ALL SAMPLE TYPES……….110
LIST OF TABLES
Table 1. Summary of Project Elements: Culture Media, Target Organisms,
Environmental Samples and Analytical Methods ... 20
Table 2. Method Protocol Summary by Day ... 24
Table 3. Typical Sample Dilutions Used for Spread Plate and Membrane
Filtration Analysis by Sample Site and Candidate or Baseline Culture Medium ... 28
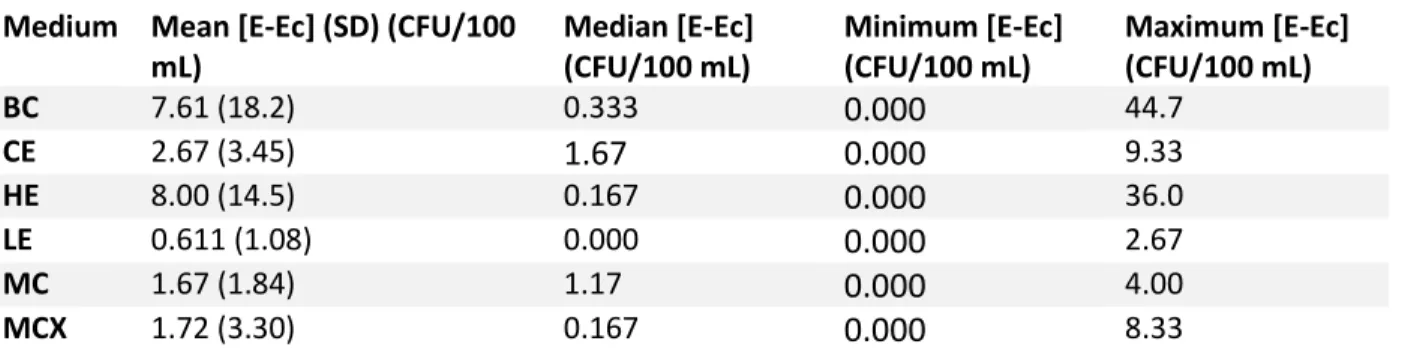
Table 4. Arithmetic mean (with standard deviation), median, minimum, and maximum ESBL E. coli concentrations in raw sewage for all candidate
media over the course of 10 sampling events. ... 37
Table 5. Results of ANOVA test comparing the matched week-over-week
mean concentrations of ESBL E. coli in raw sewage as detected by all candidate media ... 39
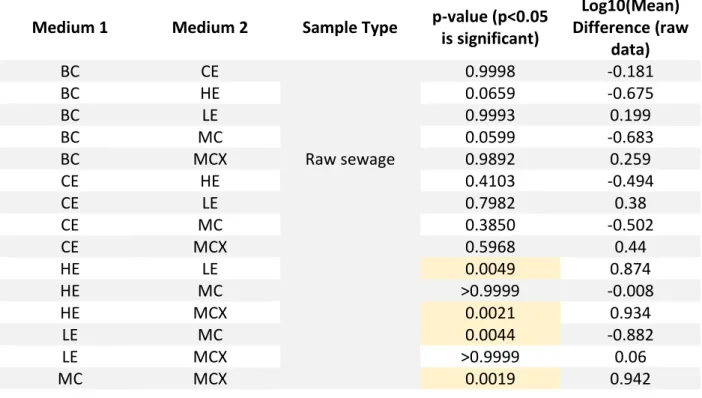
Table 6. Results of Sidak’s multiple comparisons post-tests comparing the matched concentrations of ESBL E. coli in raw sewage as detected by all
candidate media pairs. A gold-shaded cell indicates the result is statistically significant at p<0.05. ... 39
Table 7. Results of ANOVA comparing the mean log-transformed proportions
of ESBL resistance among E. coli in raw sewage, as determined by candidate/baseline media pairs ... 40
Table 8. Sidak’s multiple comparisons post-tests results for candidate/baseline media pairs' differences in quantifying the proportions of presumptive ESBL
resistance in raw sewage E. coli ... 40
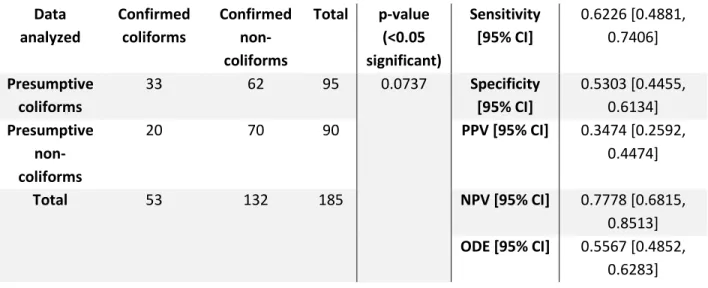
Table 9. Contingency Table of E. coli speciation in raw sewage by all candidate media, plus Fisher's exact test significance and select diagnostic performance
statistics for correct identification of bacterial isolates ... 41
Table 10. Results of Fisher's exact test for independence of presumptive and confirmed raw sewage E. coli isolate identity, plus diagnostic performance
statistics, for each candidate medium.. ... 42
Table 11. Contingency Table of non-E. coli coliform speciation in raw sewage by all candidate media, plus Fisher's exact test significance and select diagnostic
performance statistics for correct identification of bacterial isolates ... 43
Table 12. Results of Fisher's exact test for independence of presumptive and confirmed raw sewage non-E. coli coliform isolate identity, plus diagnostic
Table 13. Number of samples with detected ESBL E. coli (>0 CFU/100 mL) in upstream surface water for all candidate media, plus the results of a
Fisher's exact test for differences between candidate media. ... 46
Table 14. Arithmetic mean (with standard deviation), median, minimum, and maximum ESBL E. coli concentrations in upstream surface water for
all candidate media over the course of 6 sampling events. ... 47
Table 15. Results of ANOVA comparing the mean log 10-transformed proportions of ESBL resistance among E. coli in upstream surface water,
as determined by candidate/baseline media pairs. ... 49
Table 16. Sidak’s multiple comparisons post-tests results for candidate/baseline media pairs' differences in quantifying the proportions of presumptive ESBL
resistance in upstream surface water E. coli. ... 49
Table 17. Contingency Table of E. coli speciation in upstream surface water by all candidate media, plus Fisher's exact test significance and select
diagnostic performance statistics for correct identification of bacterial isolates ... 51
Table 18. Results of Fisher's exact test for independence of presumptive and confirmed upstream surface water E. coli identity, plus diagnostic
performance statistics, for each candidate medium.. ... 51
Table 19. Contingency Table of non-E. coli coliform speciation in upstream surface water by all candidate media, plus Fisher's exact test significance
and select diagnostic performance statistics for correct identification of bacterial isolates ... 53
Table 20. Results of Fisher's exact test for independence of presumptive and confirmed upstream surface water non-E. coli coliform identity,
plus diagnostic performance statistics, for each candidate medium.. ... 54
Table 21. Number of samples with detected ESBL E. coli (>0 CFU/100 mL) in downstream surface water for all candidate media, plus the results of a
Fisher's exact test for differences between candidate media. ... 56
Table 22. Arithmetic mean (with standard deviation), median, minimum, and maximum ESBL E. coli concentrations in downstream surface water for
all candidate media over the course of 6 sampling events. ... 56
Table 23. Results of an ANOVA comparing the mean log-transformed proportions of ESBL resistance among E. coli in downstream surface water,
Table 24. Sidak’s multiple comparisons post-tests results for candidate/baseline media pairs' differences in quantifying the proportions of log-transformed
presumptive ESBL resistance in downstream surface water E. coli. ... 59
Table 25. Results of Fisher’s exact tests, for each candidate medium and for
all media collectively, comparing frequency of ESBL E. coli detection in
upstream vs downstream surface water ... 60
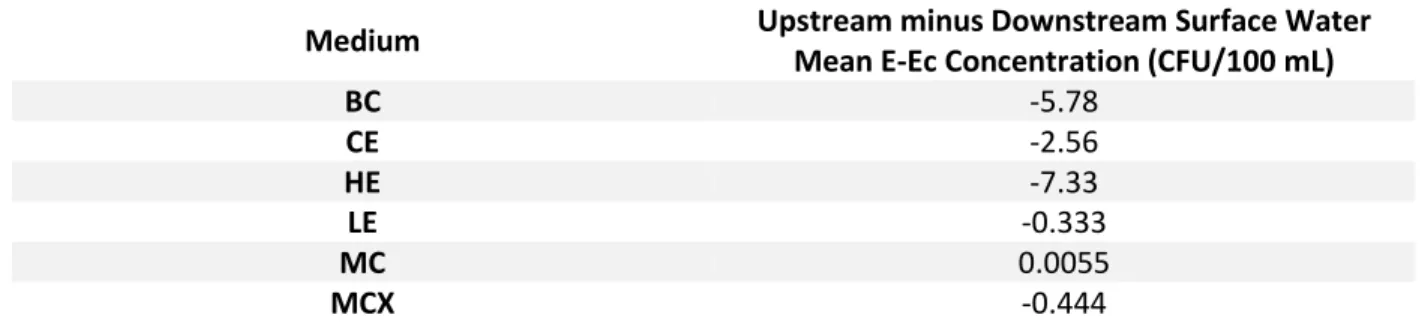
Table 26. Upstream surface water mean E-Ec concentrations minus
downstream surface water mean E-Ec concentrations for each candidate medium. ... 61
Table 27. Results of ANOVA and multiple comparison post-tests for
evaluating differences in log-transformed E. coli ESBL resistance prevalence
between upstream and downstream surface water. ... 61
Table 28. Number of samples with detected ESBL E. coli (>0 CFU/g fresh manure) in community farm poultry manure for all candidate media,
plus the results of a Fisher's exact test for differences between candidate media. ... 63
Table 29. Arithmetic mean (with standard deviation), median, minimum, and maximum ESBL E. coli concentrations in community farm poultry
manure for all candidate media over the course of 3 sampling events. ... 64
Table 30. Results of ANOVA comparing the mean log 10-transformed proportions of ESBL resistance among E. coli in community farm poultry
manure, as determined by candidate/baseline media pairs. ... 66
Table 31. Sidak’s multiple comparisons post-tests results for candidate/baseline media pairs' differences in quantifying the log 10-transformed proportions of presumptive ESBL resistance in
community farm poultry manure E. coli. ... 66
Table 32. Number of samples with detected ESBL E. coli (>0 CFU/g fresh manure) in conventional farm broiler litter for all candidate media, plus
the results of a Fisher's exact test for differences between candidate media. ... 68
Table 33. Arithmetic mean (with standard deviation), median, minimum, and maximum ESBL E. coli concentrations in community farm poultry
manure for all candidate media over the course of 3 sampling events. ... 69
Table 34. Results of ANOVA comparing the log 10-transformed mean proportions of ESBL resistance among E. coli in conventional broiler chicken
Table 35. Sidak’s multiple comparisons post-tests results for candidate/baseline media pairs' differences in quantifying the log-transformed proportions of
presumptive ESBL resistance in conventional broiler chicken pen litter E. coli. ... 71
Table 36. Results of Fisher’s exact tests, for each candidate medium and
for all media collectively, comparing frequency of ESBL E. coli detection
in community farm poultry manure vs. conventional farm broiler litter. ... 73
Table 37. Broiler litter mean E-Ec concentrations minus poultry manure mean
E-Ec concentrations, in CFU/g, for each candidate medium. ... 73
Table 38. Unpaired t-test of collective mean ESBL E. coli concentrations
in community farm poultry manure vs. conventional farm broiler litter. ... 74
Table 39. Results of ANOVA and multiple comparison post-tests for evaluating differences in E. coli ESBL resistance prevalence between
community farm poultry manure and conventional broiler chicken pen litter ... 74
Table 40. Rank order of mean ESBL E. coli concentrations given by candidate
media for a given sample type and overall. ... 76
Table 41. Fisher's exact test significance plus presumptive E. coli identification
diagnostic statistics for each candidate medium on isolates from all sample types. ... 79
Table 42. P-values of differences in candidate media's E. coli identification
diagnostic statistics from analyses on all sample types. ... 80
Table 43. Fisher's exact test significance plus presumptive non-E. coli coliform
identification diagnostic statistics for each candidate medium on isolates from all sample types. ... 81
Table 44. P-values of differences in candidate media's non-E. coli coliform
identification diagnostic statistics from analyses on all sample types. ... 82
Table 45. Presumptive ESBL characterization diagnostic statistics, with
95% confidence interval limits, for each candidate medium on isolates from all sample types. ... 84
Table 46. P-values of differences in candidate media’s ESBL resistance
characterization diagnostic statistics from analyses on all sample types. ... 85
Table 47. ESBL E. coli concentrations, in CFU/100 mL, in raw sewage for
all candidate and baseline media by sampling week. ... 106
Table 49. ESBL E. coli concentrations, in CFU/100 mL, in upstream surface
water for all candidate and baseline media by sampling week. ... 107
Table 50. Proportions of presumptive ESBL resistance among E. coli in upstream
surface water, as determined by candidate/baseline media pairs, for all sampling weeks. ... 107
Table 51. ESBL E. coli concentrations, in CFU/100 mL, in downstream surface
water for all candidate and baseline media by sampling week. ... 107
Table 52. Proportions of presumptive ESBL resistance among E. coli in downstream
surface water, as determined by candidate/baseline media pairs, for all sampling weeks. ... 107
Table 53. ESBL E. coli concentrations, in CFU/g, in community farm poultry
manure for all candidate and baseline media by sampling week. ... 108
Table 54. Proportions of presumptive ESBL resistance among E. coli in community
farm poultry manure, as determined by candidate/baseline media pairs, for all sampling weeks. ... 108
Table 55. ESBL E. coli concentrations, in CFU/g, in conventional farm broiler pen
litter for all candidate and baseline media by sampling week.. ... 108
Table 56. Proportions of presumptive ESBL resistance among E. coli in conventional
farm broiler pen litter, as determined by candidate/baseline media pairs, for all sampling weeks. ... 108
Table 57.Results of MALDI-TOF MS speciation and VITEK 2 antimicrobial resistance
LIST OF FIGURES
Figure 1.Box-and-whisker plot of the distribution of concentrations, in CFU/100 mL,
of ESBL E. coli in raw sewage, as determined by all candidate media. ... 37
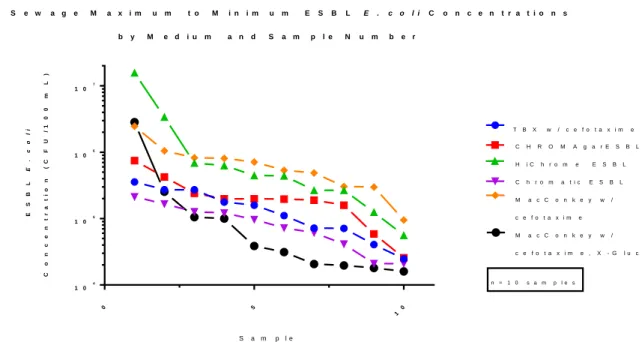
Figure 2. Individual sampling week concentrations, in CFU/100 mL, of ESBL E. coli
in raw sewage as determined by all candidate media.. ... 38
Figure 3. Presumptively ESBL resistant proportions of total E. coli in raw sewage
as quantified by candidate and baseline media. ... 40
Figure 4. Week-over-week arithmetic mean ESBL E. coli concentrations
(in CFU/100 mL) in Morgan Creek upstream surface water, as determined by all candidate media.. ... 46
Figure 5. Individual sampling week concentrations, in CFU/100 mL, of ESBL E. coli
in upstream surface water as determined by all candidate media. ... 47
Figure 6. Arithmetic mean concentrations of total E. coli in upstream surface
water as determined by quantification with non-antibiotic 'baseline' media over 6 sampling events. .... 48
Figure 7. Proportions of upstream surface water E. coli which are presumptively
resistant, as quantified by candidate/baseline media pairs.. ... 49
Figure 8. Week-over-week arithmetic mean ESBL E. coli concentrations, in CFU/100 mL,
in downstream surface water, as determined by all candidate media.. ... 56
Figure 9. Individual sampling week concentrations, in CFU/100 mL, of ESBL E. coli
in downstream surface water as determined by all candidate media.. ... 57
Figure 10. Arithmetic mean concentrations of total E. coli in downstream surface
water as determined by quantification with non-antibiotic baseline media over 6 sampling events. ... 57
Figure 11. Presumptively ESBL resistant proportions of total E. coli in downstream
surface water as quantified by candidate and baseline media.. ... 58
Figure 12. ESBL E. coli week-over-week mean concentrations from upstream and
downstream surface water for all candidate media. Error bars represent standard error of the mean.. . 60
Figure 13. Week-over-week mean ESBL E. coli concentrations, in CFU/g, in
community farm poultry manure as detected by all candidate media. ... 64
Figure 15. Arithmetic mean concentrations of total E. coli in community farm poultry manure as determined by quantification with non-antibiotic baseline
media over 3 sampling events. ... 65
Figure 16. Proportions of detected E. coli in community farm poultry manure
that were presumptively ESBL resistant. ... 66
Figure 17 Week-over-week mean ESBL E. coli concentrations, in CFU/g, in
conventional broiler chicken pen litter as detected by all candidate media. ... 68
Figure 18. Individual sampling week mean concentrations, in CFU/g, of ESBL E. coli
in conventional broiler chicken pen litter as determined by all candidate media. ... 69
Figure 19. Arithmetic mean total E. coli concentrations in conventional farm broiler
litter as determined by baseline media over 3 sampling events. ... 70
Figure 20. Presumptively ESBL resistant proportions of total E. coli in conventional
broiler pen chicken litter as quantified by candidate and baseline media. ... 71
Figure 21. ESBL E. coli week-over-week mean concentrations from community
farm poultry manure and conventional farm broiler litter for all candidate media.. ... 73
Figure 22. Week-over-week mean ESBL E. coli concentrations (in CFU/100 mL
for water samples and CFU/g for poultry waste samples) for each medium and sample type.. ... 76
Figure 23. Diagnostic accuracy of presumptive E. coli identification for each candidate medium. ... 78
Figure 24. Diagnostic accuracy of presumptive non-E. coli coliform identification
for each candidate medium. ... 81
Figure 25. Positive predictive values of presumptive ESBL resistance characterization, as defined by confirmed cefpodoxime 𝛽-lactam resistance and confirmed
LIST OF ABBREVIATIONS
AGISAR Advisory Group on the Integrated Surveillance of Antimicrobial
Resistance
AMR Antimicrobial Resistance
ARB Antibiotic-resistant Bacteria
ARG Antimicrobial Resistance Genes
AST Antibiotic Susceptibility Testing
B Tryptone Bile Glucuronic Agar Medium
BC Tryptone Bile Glucuronic Agar Medium with Cefotaxime
CE CHROMagar™ ESBL Agar Medium
CLSI Clinical and Laboratory Standards Institute
ECOFF Epidemiological Cut-Off Value
E-Ec Extended-Spectrum-𝛽-lactamase Escherichia coli
ESBL Extended-spectrum- 𝛽-lactam(ases)
EUCAST European Union Committee on Antimicrobial Susceptibility Testing
GAP Global Action Plan on Antimicrobial Resistance
GLASS Global Antimicrobial Resistance Surveillance System
ISO International Standards Organization
KESC Klebisella, Enterobacter, Serratia, Citrobacter non-E. coli coliforms
LE Liofilchem™ Chromatic ESBL Agar Medium
LMIC Lower-and-middle-income Countries
M Becton-Dickinson™ MacConkey Agar Medium
MALDI-TOF MS Matrix-assisted Laser Desorption/Ionization-Time of Flight Mass
Spectrometryss Spectrometry
MC Becton-Dickinson™ MacConkey Agar Medium with Cefotaxime
MCX Becton-Dickinson™ MacConkey Agar Medium with Cefotaxime, X-Gluc
MX Becton-Dickinson™ MacConkey Agar Medium with X-Gluc
MIC Minimum Inhibitory Concentration
NDM New Delhi Metallo- 𝛽-lactamase
OH One Health
OM One Method
WHO World Health Organization
CHAPTER 1: INTRODUCTION
The global misuse and abuse of antimicrobials in clinical, veterinary and agricultural settings has
encouraged the rise of antimicrobial resistance (AMR). As preventative and curative treatments lose
potency, AMR has threatened to erase the health and economic advances made by antimicrobial
chemotherapies over the last century. While the estimates of the negative health impacts of AMR are
limited, AMR is currently estimated conservatively to be responsible for 700,000 deaths per year
globally, a number that could skyrocket to 10 million deaths per year by 2050. Moreover, economic
projections suggest that, across all sectors globally, AMR will cause GDP losses of between 2-3.5%
between now and 2050 (compared to a timeline between the present day and 2050 without
AMR-attributable economic losses)1,2.
Recognizing the AMR threat to human health and prosperity, the international scientific and
policy communities have agreed to make combating AMR a top priority. While involving many
non-governmental organizations, national governments, and supranational organizations, this response has
been prominently coordinated under the aegis of the World Health Organization (WHO) and ratified by
the World Health Assembly in 2014 under the Global Action Plan on Antimicrobial Resistance (GAP). The
GAP acknowledged several critical knowledge deficits about the state of AMR globally, including
information on the magnitude and spatial variation of AMR pathogens, plus data on the development
and spread of resistance through humans, animals, and the environment. Addressing these knowledge
gaps through robust surveillance is imperative for the development and deployment of policies, tools,
action toward a global set of integrated, harmonized methods for the monitoring and surveillance of
AMR1.
Following that call, in 2015 WHO published the Global Antimicrobial Surveillance System
(GLASS), a manual for implementing a suite of recommended AMR surveillance approaches – from specimen collection to reporting structures and data management at the national level3. In related and
parallel initiatives, the WHO Advisory Group on the Integrated Surveillance of Antimicrobial Resistance
(AGISAR), has worked since 2009 to advance and integrate needed AMR surveillance approaches across
multiple sectors, initially focusing on foodborne and zoonotic AMR in the nexus between human health,
animal health, and livestock production4.
While both GLASS and the initial AGISAR framework represent significant advances in AMR
surveillance policy, they rely on complex methodologies for monitoring the resistance traits of many
pathogens to multiple classes of antibiotics. These requirements make these schemes unfeasible and/or
unsustainable in the lower- and middle-income countries (LMICs) where AMR issues are more severe
and less manageable. Moreover, these surveillance schemes have historically under-appreciated the
role of the environment in promoting AMR evolution, proliferation and spread 5. At its sixth meeting in
2015, AGISAR acknowledged these shortcomings and recommended the development of a simpler
surveillance program with robust, LMICs-accessible methods that could be integrated and harmonized
across human, animal, and environmental health (the so-called “One Health” (OH)) sectors. At its 7th
meeting in November 2016, AGISAR came to agree on an integrated microbiological-epidemiological OH
surveillance protocol centered around the detection of extended-spectrum-𝛽-lactamase-producing
or agriculturally relevant 𝛽-lactam antibiotics4–7. This surveillance protocol and its development became
colloquially known as the Tricycle Project.
A main objective for the Tricycle Project was to develop materials and methods for a protocol
that could simply and accurately detect E-Ec in AMR-relevant settings across all OH sample types8. A key
question unresolved at this project’s inception became which culture-based media selective for ESBL E. coli and ESBL non-E. coli coliforms would prove most effective and advantageous. To that end, this project examined a set of six candidate, mostly clinical chromogenic agar media– three ‘generic’ media
formulated in-laboratory as well as three proprietary media – by evaluating their relative performances in the direct detection, quantification, purification, and isolation of ESBL E. coli and other ESBL non-E. coli coliforms from representative Tricycle Project environmental sample matrices in Chapel Hill, NC, USA. Specifically, evaluations relied on comparisons of the detection and enumeration of ESBL-E. coli/non-E. coli coliforms and the relative proportion of these ESBL/𝛽-lactam resistant target bacteria relative to all E. coli and non-E. coli coliforms in a series of repeated analysis of samples of surface water, wastewater, and poultry waste using these candidate ESBL media and their corresponding non-ESBL
‘baseline’ antibiotic-free media over a period of one year. The extent of detection and occurrence of these target ESBL E. coli and non-E. coli coliforms by the candidate media and their accuracy and reliability in presumptively identifying target bacterial isolates and then further confirming and
characterizing their identities and ESBL antimicrobial resistance properties was determined using both
CHAPTER 2: LITERATURE REVIEW
Introduction
This section reviews the current scientific literature to describe the historical and current state of
AMR detection methods, and then discusses the need for and development of a standardized, One
Health, culture-based global surveillance system - centered around the detection of ESBL Escherichia coli
- for the detection of AMR in diverse and interrelated settings. As such, this section intentionally omits
any extensive discussion of: a comparative discussion of different AMR surveillance schemes; the
molecular biology underpinnings of AMR; molecular and other “next-generation” AMR detection
methods which may not be globally accessible; and discussion of resistant pathogens which are highly
concerning but either limited in prevalence or in their relevance to a One Health surveillance framework
(e.g., multidrug-resistant Mycobacterium tuberculosis, fluconazole-resistant Candida albicans).
Practice and Policies of AMR Detection/Diagnostics and AST
An antibiotic is any chemical substance produced by microbes predominantly to destroy, or
inhibit the growth of, competing microbes. This act of ‘antibiosis’ has been present since time
immemorial among environmental microbes, promoting the evolution of antibiotic resistance, i.e., the
reduced susceptibility of an organism to antibiotics9. Unsurprisingly, then, antibiotics and their
concomitant resistance in environmental bacteria far predate the modern age of antimicrobial therapy.
This has been demonstrated by the discovery of bacteria resistant to multiple classes of clinically
important antibiotics in areas isolated from any anthropogenic activity10–12.
While the natural history of AMR extends back eons, human efforts to detect this resistance are
1800s and early-to-mid 1940s13. Soon, the advent of minimum inhibitory concentrations (MICs), the
lowest possible inhibitory concentration of an antibiotic, represented a further milestone in the
development of confirmatory antimicrobial susceptibility testing (AST) and the surveillance of
antimicrobial resistance more broadly14,15. The development of MICs led to the advancement of
“breakpoint” techniques for classifying bacterial resistance phenotypes by their growth compared to
established reference MIC values16–18, a practice that is still in effect today. Breakpoints have
encouraged the standardization and harmonization of these reference values under supervisory
organizations, namely CLSI and EUCAST13.
These organizations have been forced to revise breakpoint concentrations for antimicrobials as
exponential increases in antimicrobial consumption for clinical and other uses has created sufficient
selective pressure for resistance19,20. In and beyond this “moving target” of evolving resistance and the
need for revising breakpoint values, several other challenges exist with these standardized MIC AST
methods. For example, certain semi-quantitative AST methods (such as agar disk diffusion) may not be
amenable to reinterpretation should breakpoints change15. Moreover, small test populations may skew
MIC values21. Institutionally, discordance in diagnosis and treatment can occur when transitioning from
CLSI vs EUCAST standards or vice versa, even within the same health system22,23.
Despite their adoption beyond the clinical sphere, clinically defined breakpoint AST methods are
inherently limited in their application. Clinical methods measure resistance gene expression under
tightly controlled growth conditions but are often inappropriate outside of the clinical sphere24. In
contrast, there is a lack of standardized methodology for the surveillance of AMR in non-clinical
“hotspots,” those settings with a high prevalence and exchange of resistance traits furthering their rapid
global transmission to other settings25. Such hotspots may include hospitals, wastewater treatment
enable monitoring of how bacteria develop reduced susceptibility to a specific drug. In this scheme,
resistance is classified according to “epidemiological cutoff values
” (ECOFFs) which are derived from the
normal distribution of MICs in a given bacterial species 24,28. While still subject to skew, an
epidemiological resistance definition’s derivation from the overall bacterial population’s MIC
distribution helps to address resistance more accurately across different settings.
Methodologies for the surveillance of AMR have also recently advanced. Driven by a need for
quick detection of resistant pathogens in clinical and other settings, rapid AMR detection methods have
developed to detect ARB to complement AST testing29. Molecular methods especially have transformed
AMR detection and surveillance, informing and enriching the scientific understanding of a resistome, that collection of genetic elements having evolved and transferred between microbes that enable
resistance. At the same time, the imperfect and often uncertain correlation between molecular
detection of ARGs and phenotypically detected resistance underscores the continued need for
phenotypic culture-based testing for AMR, including AST methods. These phenomena are still being
explained by continued resistome study30,31.
Culture-based methods have several other advantages for AMR detection. Culture-based
methods easily enable the characterization of multidrug resistance in a way that highly targeted
molecular methods may not. Additionally, culture-based methods allow researchers or diagnosticians to
study bacterial responses to specific antibiotic concentrations, a useful feature when detecting
intermediate resistance traits32–34.
AMR Hotspots and Cross-Sector Fate and Transport
The lack of a consistent methodology for AMR surveillance across clinical and non-clinical
settings is more than a merely academic matter. By improperly handling our water, wastes, and
foodstuffs, modern human activity can encourage AMR hotspots, further promoting the spread of
activity is discharged with treatment into surface waters36. This scarcity of adequate sanitation globally
suggests the massive loading of ARGs and ARBs into surface waters, not to mention a massive burden of
diarrheal disease37,38.
In addition to inadequate sanitation for AMR environmental sources, the well-documented and
staggering overuse and misuse of antimicrobials across clinical, agricultural, and community settings
globally – and the selective pressure that this overuse and misuse provides, especially in discharged wastes – also contributes to the increasing threat of hotspot-driven AMR transmission37,39–41. This
antimicrobial abuse and excess has effects ranging far beyond the facilities in which it occurs. In fact, the
density of antimicrobial consumption and pollution of untreated wastes containing antimicrobials and
ARGs represents an ecological issue. Widespread antimicrobial use has been shown to be a prominent
determinant for the evolution of AMR even outside settings where antimicrobials have been used42,43.
Put another way, antimicrobials are “societal drugs” by virtue of their unique impact on the ecology of
resistance. For example, researchers found that rates of ARB carriage in individuals correlated more
strongly with community antimicrobial consumption and population density than with personal
antimicrobial consumption43–45.
Within communities, the clinical domain remains a prominent driver of AMR. Modern
medicine’s emphasis on highly centralized and aggressive treatment within hospital settings engenders both a reliance on therapeutic and prophylactic antimicrobial prescription, on one hand, and the spread
of resistant infectious diseases on the other. Even in outpatient settings, a reliance on empirical
diagnosis and the prescription of broad-spectrum antibiotics have facilitated AMR disease. As a result,
clinically isolated ARBs have increased in prevalence over time, although better epidemiological
surveillance and improved clinical antimicrobial stewardship has recently somewhat slowed or even
Agriculture may constitute an even larger driver of AMR than clinical operations. Agricultural
settings, most especially livestock operations, consume a large minority or even a majority of total
antimicrobial consumption in many countries globally, for therapeutic, prophylactic, and
growth-promoting purposes. There is mounting evidence that widespread non-therapeutic antimicrobial usage
in livestock operations has been a main contributor to the global rise in antimicrobial resistance37,47.
Aquaculture facilities present another agricultural hotspot and source for introduction of ARBs and ARGs
to humans and the environment37. To wit, the carriage rate of Enterobacteriaceae and other bacteria
resistant to extended-spectrum beta lactams (ESBLs) - a vitally important class of antimicrobials both
clinically and agriculturally - is increasing in farm animals, especially poultry48. It is important to note
that ESBLs are typically not used for livestock growth promotion purposes but may nonetheless find
prophylactic, metaphylactic, or therapeutic usage on farms49–51, all of which may contribute to this
increasing carriage rate of ESBLs. Concurrently, while antimicrobial growth promoters are typically not
used therapeutically for humans or animals, the use of similar drugs may promote cross-resistance to
clinically important antibiotics. For example, the use of avoparcin, a glycopeptide antibiotic as a poultry
growth-promoter may encourage cross resistance to vancomycin, another glycopeptide antibiotic that is
vitally important clinically50. Moreover, other common antibiotics used to treat human disease, such as
tetracyclines and sulfonamides, are also used at various points in animals’ life cycles51. Thus, both
directly and by promotion of cross-resistance, antimicrobial consumption in animals may create
selective pressure for resistance to clinically relevant antibiotics.
Environmental media represent further potential AMR hotspots and play a key role in mediating
resistance. The discharge of human or animal wastes into the environment a) allows the conveyance of
extant ARBs and ARGs, and b)allows the convergence of commensal/pathogenic enteric bacteria and
environmental bacteria, which may harbor ARGs and “pass” them along to gut flora, promoting further
pathogenic Enterobacteriaceae may have emerged from waterborne species in the natural environment
53.
Thus, water especially represents a potent vehicle for the dissemination and amplification of
resistance via selective pressure and horizontal gene transfer of ARGs26,43. These dynamics are especially
pertinent within urban water systems54. For example, in insufficiently managed municipal water systems
carrying New Delhi metallo-𝛽-lactamase 1 (NDM-1) genes, researchers found that resistance to multiple classes of antibiotics, including second-line carbapenem 𝛽-lactam antimicrobials, can be rapidly
transmitted at once25,55.
Wastewater effluents comprise another considerable environmental AMR hotspot56.
Wastewater effluents contain antimicrobial concentrations ranging from nanograms per liter up to
milligrams per liter (i.e., considerably higher than MIC values), depending on the facility discharging
these wastes35. These wastes get discharged downstream into surface waters and near or even into
fields with animal manures57. Even at low antimicrobial concentrations, these wastewater effluents can
provide pressure for the natural selection of resistance both in situ and in receiving waters and nearby areas56. However, certain intensive facilities – namely hospitals and drug manufacturers – have much
higher antimicrobial concentrations58, thus creating even greater selective pressure for the development
of AMR. Beyond selecting for AMR, wastewater effluents – especially from municipal and hospital facilities – also convey high quantities of resistant gut flora into the environment. To reiterate, this transport increases the risks for human and animal colonization or infection with ARBs and enables the
exchange of resistance between gut flora and environmental bacteria59–61. More recently, evidence has
suggested that wastewater treatment plants themselves may promote the evolution or dissemination of
AMR, although evidence is still mixed and the exact mechanisms for the selection of resistance in
Beyond individual domains, AMR hotspots have the potential to transmit and amplify resistance
both within and across settings. Improper waste management practices encourage the spread of AMR
between agricultural, clinical, and environmental settings. For example, runoff from the land application
of manure on farms into surface waters represents a significant introduction of ARGs into the
environment64. Elsewhere, prophylactic antibiotic provision in livestock and residual resistant bacteria
from farms left on foodstuffs both represent significant determinants of clinically relevant resistant
infection in humans65–67. Similarly, enteric organisms harboring determinants for resistance in clinically
relevant disease may be passed on from livestock to humans via food handlers68. And, as established
above, clinical wastes can support environmental reservoirs of AMR that have the potential for further
spread and potential human or other animal exposures.
Moving toward a Simple, Standardized One Health AMR Surveillance System
Because AMR hotspots create and contribute to an interconnected One Health system
promoting the rapid and far-reaching spread of AMR, managing these hotspots should be a top policy
concern25,43,69. However, there is a paucity of international standards or guidelines to regulate the
management, treatment, and disposal of wastes. Where management practices have been
recommended, they are often not implemented or practiced. Exacerbating matters, the lack of global
and standardized surveillance data constrains the international community’s ability to address these
issues. As such, building surveillance and laboratory capacity through the creation and adoption of
standard, reliable, and rapid tests is vital. WHO acknowledges that any such surveillance system must be
supported beyond just the human health sectors70.
Addressing this need, WHO has established an Advisory Group on the Integrated Surveillance of
Antimicrobial Resistance (AGISAR), to counsel member states in designing integrated AMR surveillance
efforts that incorporated monitoring of clinical, zoonotic, and foodborne AMR. Additionally, WHO has
global AMR surveillance. As of 2017, 31 countries had fully enrolled in GLASS, focusing on surveillance of
a set of ‘priority pathogens’ deemed most hazardous to human health. As of yet, however,
environmental surveillance efforts have not advanced much beyond a preliminary, modest set of
sophisticated metagenomics efforts. Currently, no standardized functional environmental AMR
surveillance system has been established. As a result, these programs remain incomprehensive5,38,71–73.
Furthermore, while these programs and commitments are crucial in in implementing integrated AMR
surveillance globally, they largely rely on complex methods and surveillance of specific pathogens and
classes of AMR. AMR is indeed a complex issue spanning many infectious diseases and modes of
resistance; however, similarly complex monitoring would be onerous, difficult to coordinate and
implement, and unfeasible for low- and middle-income countries5.
These surveillance and methodological gaps and challenges, combined with the ecological
dynamics of AMR across different settings, necessitate a truly trans-sectoral and unifying surveillance
framework and method. Here, a One Health (OH) framework has proven particularly useful for
combining human, animal, and environmental health into a more comprehensive and laterally
integrated concept of AMR issues and how to address them74. The OH inclusion of environmental
surveillance is a particularly notable improvement upon previous WHO surveillance programs, as the
complexity of the environmental resistome and the human and animal health impacts of environmental
exposure to ARBs are both critical knowledge gaps, though environmental pollution is understood to be
a key influence on the sources, occurrence, and spread of AMR71,75,76.
Standardizing and operationalizing a so-called “One Method” (OM) culture-based approach is also critical for coordinating surveillance efforts globally. An OM approach enables the compatibility of
MIC data and other resistance classification information across laboratory type, time, and country. An
data collection on pathogens and zoonotic and commensal ARBs. Ultimately, this quality control ensures
that health professionals across all domains are receiving valid susceptibility data with which to make
antimicrobial prescription decisions and maintain good antimicrobial stewardship77.
With this in mind, at the 6th AGISAR meeting in 2015, members proposed a broader One Health
framework - incorporating clinical, agricultural, and environmental domains - with a simpler, standard
surveillance program which could reduce surveillance, ideally, to a reproducible and simple
culture-based method for monitoring a single organism and type of resistance across settings. The advancement
of this program with the specification of a target AMR bacterium and a proposed set of culture-based
monitoring methods developed in a workshop held at the 7th AGISAR meeting in 2016 came to be known
as the Tricycle AMR Surveillance Project. The project is so named for its concern for the inter-related
dissemination of resistance between its three identified domains (human/clinical, animal/agricultural,
and environmental) as a One Health issue. At the center of the Tricycle Project is AGISAR’s
recommendation of ESBL-resistant Escherichia coli (E-Ec) as the ARB indicator bacterium of choice5. E.
coli makes a convenient indicator bacterium because of its association with fecal pollution and its established use as a fecal indicator of microbial contamination more generally78. Additionally, the choice
of resistance type reflects the importance of ESBL antimicrobials to both human and animal health and
their presence across a variety of settings internationally, as well as the considerable contribution of
E-Ec infections to the global burden of AMR enteric and systemic infectious disease79,80. Finally, E-Ec
prevalence rates have been shown to decrease following increased antimicrobial stewardship efforts,
suggesting that prevalence of this indicator will be important for monitoring antimicrobial stewardship
implementation efforts5.
Focus on a single AMR indicator eases the implementation of a harmonized, trans-sector
surveillance scheme, but it is important to acknowledge that this choice restricts the complexity,
resistance data should be reported by country and year, only allowing limited granularity in monitoring
AMR both temporally and spatially. This same lack of granularity also hinders the quantitative and causal
inference of the effects of AMR in one domain on the prevalence of AMR in another domain5.
Furthermore, even after the initial AGISAR recommendations, the question of the specific media
used for a standardized, harmonized, culture-based rapid detection method was left open, pending
further investigation of alternative culture methods and media7.
This question of standardized methods within the Tricycle Project reflects the incomplete
standardization of culture-based ESBL Enterobacteriaceae detection methods within the public health
field as a whole. Currently, the greatest level of standardization for culture-based ESBL
Enterobacteriaceae detection is in the clinical/infection prevention and control spheres. These standards
largely describe methods to detect for ESBL resistance among Enterobacteriaceae that have already
been isolated by other means, rather than describing direct detection methods. These standards may
also require different protocols for phenotypic confirmation testing of ESBL production depending on
the isolate’s identity. As a result, these methods can be cumbersome and time-intensive, especially for resource-constrained laboratories.
Once bacteria of interest have been initially detected and isolated in specimens of interest by
other means, the EUCAST Detection of Resistance Mechanisms guidelines recommend initial broth/agar
microdilution or disk diffusion AST to assess isolate ESBL resistance to either cefpodoxime or cefotaxime
and ceftazidime. Resistant isolates are then speciated and subjected to phenotypic confirmatory testing
for ESBL production by culturing isolates with a reference ESBL antibiotic in the presence and absence of
clavulanic acid, an ESBL inhibitor. Specific methods for this phenotypic ESBL production confirmatory
testing depend on the species of the isolate examined81. Similarly, CLSI guidelines recommend the use of
method as in EUCAST, by culture with cefotaxime and ceftazidime in the presence and absence of
clavulanic acid. Unlike in EUCAST, CLSI ESBL production confirmatory testing does not require
speciation18,82. As with EUCAST and CLSI, ISO recommends specimen isolation before testing for
antimicrobial susceptibility using microdilution methods83. With that said, the last decade’s advent of
‘rapid’ culture-based ESBL Enterobacteriaceae detection agar media that can provide presumptive organism identification and presumptive ESBL resistance characterization within 24 hours has provided
an attractive one-step alternative to standardized ESBL detection methods29,84. These rapid detection
methods have made their way into common use within clinical research and surveillance85,86.
The agricultural, food safety, and environmental sectors’ reported culture-based ESBL
Enterobacteriaceae detection methods largely follow these same EUCAST-, ISO-, or CLSI-standardized
methods48,87,88. However, the use of the aforementioned selective chromogenic culture media is
increasingly seen in agricultural and environmental ESBL Enterobacteriaceae research as well89–91. These
research applications still require isolates’ resistance profiles to be verified by standardized AST
methods as described above. However, the capability to presumptively screen directly for ESBL
Enterobacteriaceae in diverse sample types is an advantage in ease and throughput that should be
recognized with standardized methodology.
It is regrettable, then, that a lack of standardization exists for these rapid culture-based ESBL
Enterobacteriaceae detection methods across the One Health milieu. This project seeks to address that
gap by evaluating the performance of multiple ‘candidate’ rapid selective ESBL Enterobacteriaceae
media for use with standardized methods for ESBL E. coli detection within environmental and
agricultural OH sample types for the purposes of the Tricycle Project AMR surveillance system. Notably,
distinct from for other OH AMR surveillance uses, the Tricycle Project requires that culture-based ESBL
as estimate the proportion of E. coli that are ESBL by means of simultaneous quantification on ESBL and non-ESBL analog media.
This project evaluates these candidate media for these performance requirements. More
specifically, the ideal ESBL Enterobacteriaceae surveillance medium would have high initial sensitivity in
detecting and quantifying target ESBL indicator organisms so as to provide a conservative estimate of
the magnitude and prevalence of the ESBL hazard in the sample type analyzed. This ideal medium would
also perform accurately and in a user-friendly manner by virtue of its high specificity, inhibiting
non-target organisms and clearly differentiating primary (ESBL E. coli) from secondary (non-E. coli coliforms) target organisms. This specificity would both allow for rapid and easy detection of indicator organisms of
interest (but no non-target organisms), as required for environmental AMR surveillance, as well as
highly accurate purification and isolation of bacterial isolates of interest for further analysis, as is needed
in all One Health sectors but especially for human and animal health diagnostic needs. Additionally, the
ideal medium would be robust, withstanding different settings, skill levels, and sample types to produce
consistent results. Lastly, this ideal medium would be accessible in a wide range of laboratories and
CHAPTER 3: OBJECTIVES AND EXPERIMENTAL DESIGN Objectives
1. Descriptively and analytically compare the performance in quantification of six candidate ESBL
antimicrobial-containing bacteriological culture agar media by subjecting these media to
repeated analysis of various One Health-relevant environmental sample types: raw sewage
influent at a municipal wastewater treatment plant; surface waters up- and downstream of a
municipality and hydrologically connected to the above municipal wastewater treatment plant’s
final treated effluent; uncontained poultry manure from a free-range community poultry farm;
and poultry litter from an industry-standard broiler chicken farm.
2. Descriptively and analytically compare the aforementioned candidate media’s diagnostic
performance in presumptively identifying target organisms (primarily ESBL E. coli) and in presumptively characterizing target organisms as ESBL-resistant when used for analyses on the
aforementioned sample types.
3. Quantify and further analyze the concentrations and proportions of ESBL fecal indicator bacteria
in the aforementioned sample types, and compare these findings between sample types –
namely, between upstream vs. downstream surface water and between community-held farm
Experimental Design
To properly evaluate candidate culture-based media’s performance in an ESBL E. coli-based, One Health-oriented monitoring system, use of these media for analyzing One Health-relevant
environmental sample types was deemed necessary. As such, the experimental design for this project
relies on parallel analyses of sample types based on those proposed in the WHO-AGISAR E-Ec Tricycle
AMR Surveillance Project’s monitoring and surveillance plan5. Briefly, the Tricycle Project’s ‘Surveillance
in the environment’ work plan recommends targeting four sample types which harbor, potentially amplify, and potentially convey resistance to other One Health sectors: municipal wastewater, live
animal (especially poultry) market wastewater, and surface waters upstream and downstream of
municipal waste discharge points. Municipal and live market wastewaters were selected for their
important role as contributors of human and animal waste into the environment. Surface water samples
were selected for their relevance in environmental transmission/potential amplification of AMR and
their utility in assessing the impact of a municipality’s contributions to environmental AMR reservoirs.
For this project, municipal wastewater and surface water samples were easily obtainable and
were collected for analysis. Live market waste was not accessible due to a lack of registered and/or
cooperating live markets in North Carolina and the surrounding states. Abattoir wastewater – as a plausible proxy to live market wastewater – was considered, but again no cooperating facilities could be located in the area. Poultry cecal samples, another alternative, proved difficult to obtain within the
project timeline. Ultimately, poultry manure from a free-range community-held farm and broiler pen
litter from an industry-standard farm were selected as alternative sample types of poultry agriculture
fecal wastes that are One Health-relevant and linked hydrologically, through biological vectors, or
With sample types identified, the research project was designed for all candidate media to be
used in parallel for the comparison of their initial quantification of E-Ec and other target organisms.
Several non-antibiotic-containing analogues of certain candidate media (‘baseline media’) were also to
be used in these parallel analyses so that comparisons could be made of the ability of different media to
quantify presumptive ESBL resistance proportions relative to total E. coli. After initial quantification, ESBL target organisms would be selected, purified, and isolated from each candidate medium and then
subjected to confirmatory biochemical or phenotypic analyses so that candidate media’s performance in
CHAPTER 4: METHODS AND MATERIALS
Introduction
This methodological study focused on the adaptation and comparison of several candidate
clinical and environmental culture-based media for use in a simple antimicrobial resistant bacteria (ARB)
monitoring method across a variety of setting and sample types. These media were assessed for their
performance in the detection and enumeration of target gram-negative fecal indicator bacteria
belonging to the Enterobacteriaceae family displaying extended-spectrum-𝛽-lactam resistance (ESBL) in hotspot environmental samples of wastewater, wastewater-impacted surface waters, and poultry
farming wastes. Table 1 gives an overview of the project elements and bacteriological culture media examined in this study, target organisms, sampling sites, and analysis strategies for quantifying and
Table 1. Summary of Project Elements: Culture Media, Target Organisms, Environmental Samples and Analytical Methods
Bacteriologic Culture Media
CHROMagar™ ESBL Commercial chromogenic medium for the clinical detection of
Gram-negative bacteria producing ESBL in stools and urine. Evaluated for environmental use
HiMedia™ HiChrome ESBL Commercial chromogenic environmental and food safety medium
for selective detection, differentiation, enumeration of ESBL-producing Enterobacteriaceae
Liofilchem™ Chromatic ESBL Commercial chromogenic medium for the detection of
Gram-negative ESBL-producing bacteria
Tryptone
Bile Glucoronic Agar (TBX) +/- Cefotaxime
Chromogenic medium for the selective detection and enumeration of Gram-negative fecal indicator bacteria in the Enterobacteriaceae family in environmental waters and foodstuffs. Modified by addition of cefotaxime, a generic 3rd-generation cephalosporin and broad-spectrum β-lactam, for the detection of ESBL-producing Gram-negative coliform bacteria (including E. coli). Both Tryptone Bile Glucoronic Agar with cefotaxime (candidate ESBL medium) and Tryptone Bile Glucoronic Agar without Cefotaxime (baseline E. coli/coliform medium) were used simultaneously.
MacConkey +/- Cefotaxime, +/- X-Gluc Clinical diagnostic culture medium used for selective isolation and
differentiation of lactose-fermenting and lactose non-fermenting Gram-negative enteric bacilli. Modified by addition of cefotaxime for detection of ESBL-producing Gram-negative enteric bacilli, and by addition of X-Gluc for direct chromogenic detection of E. coli. MacConkey (baseline E. coli/coliform medium); MacConkey with Cefotaxime (candidate ESBL E. coli/coliform medium); MacConkey with X-Gluc (baseline E. coli/coliform medium); and MacConkey with Cefotaxime and X-Gluc (candidate ESBL E. coli/coliform medium) were used simultaneously.
Target Organisms
Primary: ESBL-resistant E. coli Secondary: ESBL-resistant non-E. coli coliforms; total E. coli; total non-E. coli coliforms
Environmental Sampling Sites
Municipal Raw Sewage Surface Water Impacted by Sewage Effluent Up- and Down-Stream of Municipal Area
Free-range poultry manure
Conventional Broiler Chicken Pen Litter
Analysis
Quantitative Analysis
Sampling Sites
Studies focused on the following environmentally-relevant samples from two nearby urban
areas, specifically the Chapel Hill-Carrboro metropolitan area in Orange County, NC and the Raleigh
metropolitan area of Wake County, NC
1. agricultural samples, namely poultry farm wastes of both fresh chicken manure from a free-range
antibiotic-free farm (located in Carrboro, Orange County, NC) and broiler pen litter from an
industry-standard demonstration farm near North Carolina State University in Raleigh, Wake County, NC.
2. Municipal sewage influent samples were collected at the Orange Water and Sewer Authority
(OWASA) municipal wastewater treatment plant (WWTP) in Chapel Hill-Carrboro, NC.
3. Surface water samples were collected up- and down-stream of the Chapel Hill-Carrboro
municipalities and its wastewater treatment plant. The water and wastewater sampling sites are
located in Chapel Hill, NC, and are hydrologically connected. Surface water samples were drawn
from Morgan Creek, the receiving water into which the treated final effluent of the WWTP
discharges.
Municipal Sewage
Samples of municipal raw sewage were collected periodically from the Orange Water and Sewer
Authority (OWASA) at Mason Farm Wastewater Treatment Plant in Chapel Hill, NC. OWASA has a
sewerage network serving some 100,000 people in Orange County along 324 miles of gravity-flow proportions of presumptive ESBL E. coli of the total E. coli in the environmental samples were calculated from colony counts scored on their respective media.
Confirmation of Antimicrobial Resistance Profile and Isolate Identity
piping. The plant averages 8 million gallons of wastewater per day with a peak capacity of 14.5 million
gallons per day.
Influent wastewater flows into the Mason Farm WWTP, where large grit and debris are removed
with a bar screen before further treatment by physical, biological and chemical treatment processes.
Raw sewage samples are collected just past the point of the bar screen and before the treatment
processes.
Morgan Creek
Morgan Creek is 17 miles long, originating in headwaters located in a rural area outside of
the developed town of Chapel Hill and then traversing the town, including passing by the Mason Farm
WWTP. The Morgan Creek downstream surface water sampling site was located several hundred meters
downstream of the treated final effluent discharge point of the WWTP. The upstream surface water
sampling site was located on an isolated bend of the creek north-west of Chapel Hill and Carrboro city
limits, in a rural area near Jo Mac Rd.
Smallholder Free Range Chicken Farm
The farm used for poultry manure sampling is a community farm in Carrboro, NC, using
traditional farming techniques. This free-range antibiotic-free farm is within the same watershed system
as the municipal wastewater service area and the surface water samples from Morgan Creek. Manure
was collected in open-air pens onsite. Broiler chickens are kept in loosely fenced in areas, 10-20
chickens/area, and rotated around. Broiler chickens were predominantly a Rhode Island Red breed and
roughly 6 mo. old at time of collection.
Conventional Industrial Demonstration Chicken Farm
The industrial type farm used for poultry waste sampling is the academic experimental and
Carolina. Broiler chickens are kept in approximately 100’ x 20’ pens filled with standard litter, which was
poultry waste sample collected. Chickens are fed an industry-standard diet. Broiler litter was contained
and managed on-site.
Project Timeline
Sample collection occurred between January 2017 and March 2018. In all sampling events,
samples were collected and processed to determine presence and concentrations and then obtain
representative bacterial isolates of presumptive ESBL-E. coli and other ESBL coliforms as well as non-ESBL E. coli and coliforms. Initial sampling focused on raw sewage and downstream surface water sampling and quantitative analysis plus confirmatory testing, through spring 2017. From summer
through fall 2017, samples of raw sewage, upstream and downstream surface waters, and free-range
chicken waste samples were collected and processed to determine target bacteria presence and
concentrations and to obtain representative ESBL isolates for confirmatory analyses. In winter-early
spring 2018, access was obtained to sample broiler litter for quantitative analysis of target bacteria and
obtaining bacteria isolates for further characterization. Finally, in spring 2018, a last round of
confirmatory analysis of presumptive ESBL isolates was conducted on isolates obtained from
experiments involving all sample types.
Protocol and Analysis Schedule
The protocol, analysis schedule and an overview of methods used to evaluate
Table 2. Method Protocol Summary by Day
Day Objective
Day 1 Overview of Media (and Sources), Diluent and Cryopreservatives and Use Methods: CHROMagar ESBL™ (CHROMagar), HiCrome ESBL™ (HiMedia), Chromatic ESBL™
(Liofilchem), MacConkey agar medium (Remel), Tryptone Bile Glucuronic (TBX) agar medium (HiMedia), Tryptic Soy Agar (Difco), Phosphate-buffered Saline, 1X Trypticase Soy
Broth (Difco), and 60% Glycerol aqueous solution (Fisher Scientific)
Day 2 Sample Collection, Transport, and Storage (raw sewage samples stored 24h before analysis)
Direct, One-Step Membrane Filter Method for analysis of surface water samples on all agar media
Direct Spread Plating Method for analysis of raw sewage samples on all agar media)
Day 3 Bacteria Colony Identification and Enumeration on all membrane filter/spread plate media
Presumptive Positive Bacteria Colony Selection and Initial Streak Plate Isolation and purification on candidate ESBL Agar Media: candidate media
(CHROMagar™ ESBL, HiMedia™ HiCrome ESBL, Liofilchem™ Chromatic ESBL, MacConkey with cefotaxime, MacConkey with cefotaxime and X-Gluc, Tryptone Bile Glucoronic with
cefotaxime)
Day 4 Second Step Colony Streak Plate Purification of presumptive positive bacteria Isolates on candidate ESBL Agar Media
Day 5 Third Step Colony Streak Plate Purification of presumptive positive bacteria on tryptic soy agar (TSA)
Day 6 TSB Culture Isolate Supplementation with glycerol for frozen storage Confirmatory species identification and antimicrobial resistance analysis
Media Preparation
All culture media and stock solutions were sterilized and prepared following manufacturer
instructions and procedures defined in Standard Methods for the Examination of Water and
Wastewater92. Sterile, molten agar media were tempered to 55oC in a water bath prior to plate pouring.
an electricity powered mechanical pipette gun and a sterile, polystyrene pipette. Molten agar was
dispensed into plates at 25 mL per 100x15mm plate and 5 mL per 60x15mm plate, before letting the
agar solidify and dry. After 10-30 minutes solidifying and drying, agar plates were inverted and stored at
4oC for 18 hours – for a minimum of 18 hours and a maximum of 3 weeks before use.
Sample Collection, Transport, and Storage
In general, post-collection, samples were stored at 4oC and analyzed within 48 hours.
All sampling was done using disposable or reusable equipment, including gloves, bottles, and coolers
that were sterilized post-transport for their disposal or future reuse.
All surface water and wastewater samples were collected as grab samples in sterilized
polypropylene bottles and transported in a chilled insulated cooler to the laboratory. Raw sewage grab
samples were collected by OWASA staff. Surface water samples were collected in the field by UNC
project staff. No composite samples of sewage or water were collected over the course of the project to
date.
For poultry manure samples, a composite of 5-7 droppings was collected by project staff at the
farm and transported via cold chain to the laboratory. Post-collection, 5 g fecal matter was combined
with 50 mL sterile phosphate-buffered saline (PBS), vortexed, and diluted serially 10-fold for analysis.
For broiler litter samples, farm staff collected ~1 L litter in recently inhabited areas. Samples
were then transported to the laboratory within the hour; a cold chain could not be used because of the
size of the sample. After measuring out 5 g litter into 250 mL PBS, sample preparation followed
according to Lu et al. Briefly, processing consisted of low-speed centrifugation, collection of the
supernatant, followed by high-speed centrifugation and dissolution of the pellet in 3 mL PBS for use in