1
Climate variability and educational attainment: Evidence from rural Ethiopia
Heather Randell*
National Socio-Environmental Synthesis Center (SESYNC) 1 Park Place, Suite 300, Annapolis, MD 21401, USA
Cell: +001 845-216-8736 Fax: +001 410-216-9026
Clark Gray
Department of Geography
308 Carolina Hall
University of North Carolina at Chapel Hill Campus Box 3220
Chapel Hill, NC 27599 [email protected]
*Corresponding Author
Abstract
This paper examines the effects of climate variability on schooling outcomes in rural Ethiopia. Investments in education serve as an important pathway out of poverty, yet reduced agricultural productivity due to droughts or temperature anomalies may affect educational attainment if children receive poorer nutrition during early childhood, are required to participate in household income generation during schooling ages, or if households can no longer pay for school-related expenses. We link longitudinal socioeconomic, demographic, and schooling data from the Ethiopian Rural Household Survey to high-resolution gridded climate data to measure exposure to temperature and precipitation relative to historical norms. We then estimate a set of
multivariate regression models to understand how climate variability impacts grade attainment and school enrollment. Results indicate that early life climatic conditions – namely milder temperatures during all seasons and greater rainfall during the summer agricultural season – are associated with an increased likelihood of a child having completed any education. In addition, greater summer rainfall during both early life and school ages is associated with having
2
1. Introduction
Climate change can act as a barrier to development among rural populations in low- and
middle-income countries. Environmental change impacts agricultural productivity, which in turn
affects the ability for households to invest in human capital and improve living standards.
Populations in sub-Saharan Africa are particularly vulnerable to climate variability, as over 60%
of the workforce is employed in agriculture and 96% of cropland is rain-fed (FAO 2012; World
Bank 2015b). Indeed, variations in rainfall and temperature have impacted agricultural output
more so there than in other regions of the developing world (Barrios et al. 2008). Warming
temperatures over the past several decades have been found to lead to large reductions in the
yields of maize, wheat, sorghum, and barley (Lobell & Field 2007), and extreme heat waves are
becoming more common in Africa (Russo et al. 2016). Future temperature increases and
precipitation changes are predicted to reduce crop productivity, particularly in semi-arid regions
(Niang et al. 2014; Schlenker and Lobell 2010). This is especially relevant among the extreme
poor, who tend to live on smaller or more marginal plots of land. These households may be
caught in what Barrett (2008) terms a “resource degradation poverty trap” – persisting at low
levels of human development and unable to invest in additional income producing activities (e.g.
irrigation technologies, machinery, or small businesses) or in human capital (e.g. paying school
fees, accessing healthcare, or purchasing nutritional foods).
Investments in human capital – particularly education – serve as an important pathway
out of poverty by expanding skills and labor market opportunities. Lack of access to schooling
has impeded development in many low-income nations. In response, the United Nations aimed
one of its eight Millennium Development Goals (MDGs) at achieving universal primary school
3 2000, 20% of primary school-aged children in sub-Saharan Africa remained out of school as of
2015 (United Nations 2015). These children may have never begun their schooling or may have
dropped out before completing primary school. In addition, among those in school, many
children are not in the appropriate grade for their age due to late entry as well as interruptions in
school attendance (Lewin 2009). One important factor keeping rural children out of school is the
demand for child labor, including assisting adult household members with agricultural activities,
helping with other income generating activities, and performing domestic tasks (Abebe 2007;
Admassie 2003; Cockburn & Dostie 2007; Haile & Haile 2012; Psacharopoulos 1997).
Additional factors that affect school attendance in rural sub-Saharan Africa include poverty,
gender norms, and food insecurity (Belachew et al. 2011; Hunt 2008; Lewin 2009; Mani et al.
2013). Despite falling short their MDG schooling goals, the United Nations recently released a
set of more ambitious Sustainable Development Goals (SDGs), one of which aims to achieve
universal primary and secondary attainment by 2030 (United Nations 2016).
Both environmental change and the lack of access to schooling are linked to the ability
for agricultural households to improve living standards, and lowered educational attainment
could represent an important and unexplored pathway by which future climate change
undermines gains in human development. However, research on the relationship between
environmental conditions and schooling remains limited. The goal of this paper is to examine the
intersection between environmental change and education by studying how temperature and
precipitation variability impact schooling outcomes in rural Ethiopia. Ethiopia is particularly
vulnerable to the effects of changes in temperature and precipitation, as 84% of the population
lives in rural areas, 42% of the country’s GDP is derived from agriculture, and only 3% of
4 to examine the relationship between climate and schooling in Ethiopia, we ask whether climate
variability impacts schooling outcomes among children from rural agricultural households. Our
paper offers new insights into the social impacts of global environmental change in sub-Saharan
Africa, which can inform policies that address education, socioeconomic development, and
poverty reduction in the face of increasing environmental variability.
2. The Ethiopian Context
Ethiopia is a low-income country in which 61% of rural primary school-aged children
attend school (World Bank 2015a). Primary school runs for eight years from ages seven to 14,
though many children do not begin their schooling on time. Secondary school consists of two
two-year cycles, from ages 15 to 16 and 17 to 18 (Ministry of Education 2011). The Ethiopia
Rural Socioeconomic Survey, a nationally-representative study of rural areas and small towns,
found that among rural children aged seven to 18, primary school enrollment was 57% for boys
and 59% for girls, and secondary school enrollment was approximately 2.5% for both boys and
girls (CSA & The World Bank 2013). Among enrolled students, 55% of those who missed
classes for more than a week reported work as a reason (CSA & The World Bank 2013). Other
barriers to attending school in Ethiopia include insufficient money to pay for the school-related
expenses, low parental educational attainment, and poor health of the child (Rose & Al‐Samarrai
2001).
In rural Ethiopia, children begin participating in work activities as early as four years old
(Haile & Haile 2012). According to Ethiopia’s National Labour Force Survey, 71% of rural
children aged 10-14 are employed, and the mean number of hours worked per week is 28 (32 for
boys and 23 for girls) (CSA 2014). Studies have found gendered patterns of child labor in the
5 and firewood, and caring for siblings, while boys are more likely to engage in income-generating
activities such as working on the farm (Abebe 2007; Haile & Haile 2012; Rose & Al‐Samarrai
2001). In addition, Orkin (2012) found that in rural parts of the country, work and school often
compete for children’s time. For example, the schooling schedule frequently overlapped with the
times that children participate in work, household chores and studying occurred during the same
time periods, and certain types of work could not be divided into small chunks of time in order
for the child to also attend school.
Agriculture in Ethiopia is dominated by smallholder farmers, as approximately 12 million
smallholder households produce 95% of the country’s agricultural products and account for 85%
of the country’s employment (FAO 2011). Ninety-three percent of rural households practice
agriculture, and the average land area owned is 1.37 hectares (CSA & The World Bank 2013).
Ethiopia’s main crops are cereals including teff, maize, sorghum, barley, and wheat (Evangelista
et al. 2013), though perennials such as coffee, chat, and enset are important in wetter regions of
the country. Ninety-two percent of rural households own livestock, and livestock production
accounts for 32% of the country’s agricultural GDP (FAO 2011; CSA & The World Bank 2013).
In addition to agriculture, approximately 20% of rural households own small businesses
including shops, sell processed agricultural products (e.g. flour or local beer), trade products in
the market, or sell firewood (CSA & The World Bank 2013).
Ethiopia’s climate varies from tropical rainy to desert, with mean annual rainfall ranging
from 300 mm in lowland arid regions to 2,000 mm in the highlands (Viste et al. 2013). There are
two rainy seasons in the country – the primary summer Kiremt season, which typically lasts from
June to September, and the secondary spring Belg season, which typically runs from
6 to December/January. Crops grown during the summer season are harvested between September
and December and account for 90-95% of total annual production, while crops grown during the
spring season account for 5-10% of production (Bezabih & Di Falco 2012). The timing and
amount of rainfall during the Kiremt growing season are therefore critical for crop production
(Araya & Stroosnijder 2011). Climatic conditions during the Bega dry season can also affect
production, as excessive rain may lead to crop diseases such as powdery mildew (Evangelista et
al. 2013), and frost due to cold weather may damage crops in high altitude areas (Bevan &
Pankhurst 1996).
The country suffers from periodic droughts and dry spells, with extreme geographical
variation in the timing and severity of droughts. Widespread droughts occurred in most regions
of the country in 1984, 1991, 2002, and 2009, and years in which some areas of the country
experienced drought conditions include 1972-75, 1980-82, 1987, 1990, 1992, 1999-2000, 2003,
2008, and 2010 (Viste et al. 2013). Droughts such as these have important impacts on the health
and well-being of affected communities. For example, the most severe negative rainfall shocks
led to a reduction in household consumption by 7% to 25% (Porter 2012), and households who
experienced lower levels of rainfall and higher rainfall variability were more likely to experience
persistent food insecurity (Demeke et al. 2011). Southern Ethiopia has undergone a drying trend
over the past 40 years, though no clear trend has emerged for central or northern Ethiopia (Viste
et al. 2013). In addition, cool nighttime temperatures in highland Ethiopia are crucial for staple
crop production, as they slow evaporation and enable a longer time period for crop development.
Surface air temperature has been increasing by approximately 0.03˚C per year since 1948 in
7 Climate projections for Ethiopia predict warming temperatures in all four seasons with an
annual warming of 2.2˚C by the 2050s (Conway & Schipper 2011). This will lead to a greater
frequency of heat waves and to higher levels of evaporation. Climate model predictions for
rainfall are less consistent, with some predicting drier conditions and others wetter conditions
(Conway & Schipper 2011). Regarding the impacts of climate change on agriculture, even
conservative emissions scenarios predict significant reductions in agricultural production
(Evangelista et al. 2013). By 2050 the suitable land area for teff is expected to decrease by
between 6% and 18% and the range for barley is expected to decrease by 21% to 49%. In
addition, Seo, Mendelsohn, and Dinar (2009) find negative effects of increasing temperature and
mixed effects of precipitation change on agricultural revenues in all of Ethiopia’s agro-ecological
zones.
3. Climate Shocks and Educational Outcomes in Developing Countries
Research on the links between climatic conditions and educational outcomes is limited,
and the findings are mixed. One set of studies examines how shocks experienced during school
ages impact education. Björkman-Nyqvist (2013) found that in Uganda, negative rainfall shocks
in the year of the survey led to lower primary school enrollment among older girls. She finds no
evidence that boys’ or younger girls’ enrollment is affected by rainfall shocks. She attributes this
to the fact that older females play a more important role in household labor during periods of
stress than other children. In contrast, Mani et al. (2013) discovered that in rural Ethiopia, higher
rainfall during the year of the survey was negatively correlated with enrollment and grade
attainment for males relative to females, as male children are often pulled out of school to assist
with farm labor. Similarly, (Shah & Steinberg 2013) found that in India, children who
8 of school than those who experienced drought. The authors argued that positive shocks led to
higher agricultural productivity, and therefore during these periods the returns to labor among
children were higher than the returns to schooling.
Further, a study in Tanzania found that children from households who experienced severe
crop loss increased their labor by 30% and were twenty percentage points less likely to be
enrolled in school, but that wealthier households were buffered from these effects (Beegle et al.
2006). Lastly, a study in Honduras examined the impacts of Hurricane Mitch on secondary
school attainment and found that children from credit-constrained households impacted by the
hurricane experienced lower attainment (Gitter & Barham 2007). These studies indicate that the
demand for child labor among agricultural households is an important determinant of educational
outcomes, but that the effect of rainfall shocks may vary based on individual- and
household-level characteristics as well as the cultural, environmental, and economic context in which the
household operates.
Other studies have examined the relationship between shocks experienced in
utero/infancy and educational outcomes in later childhood and adulthood. A study in Burkina
Faso found that negative rainfall shocks in utero and before age two were negatively correlated
with cognitive ability and school enrollment, and were positively correlated with child labor
(Akresh et al. 2012). Likewise, in Indonesia, rainfall shocks during the year of birth were found
to impact women’s educational attainment in adulthood (Maccini & Yang 2009). In addition,
children exposed to El Niño floods in Ecuador in utero, particularly during the first trimester,
scored lower on cognitive tests five to seven years later (Rosales-Rueda 2014). Lastly, (Shah &
Steinberg 2013) found that in India, exposure to drought in utero and during the first few years of
9 suggest that lower agricultural output during periods of rainfall shocks is associated with
decreased health and nutrition among pregnant mothers and infants, and therefore with lower
levels of biological human capital among exposed children. This supports the argument by
Alderman (2011) that the physical, cognitive, and socio-emotional effects of shocks in early
childhood act as key determinants of future life outcomes.
We build on this emerging literature in three primary ways. First, while most prior studies
focus solely on rainfall, we examine both rainfall and temperature. Because fluctuations in both
temperature and precipitation due to climate change are expected to affect agricultural
productivity in sub-Saharan Africa (Niang et al. 2014; Schlenker and Lobell 2010), examining
the effects of precipitation alone does not provide a comprehensive picture of the impacts of
climate change. Second, we look at climate over the first seven years of a child’s life instead of
studying only discrete shocks or climatic conditions experienced during the year of or year prior
to the survey. Early childhood is a critical period for physical and cognitive development and is
the time of life before formal schooling begins in Ethiopia. In addition, because climate change
is a decadal process, we measure climate as deviations from long-term historical conditions,
which may serve as a better proxy for understanding how climate change may impact
educational outcomes in the future. Lastly, given the gendered nature of child labor in Ethiopia
(Abebe 2007; Haile & Haile 2012; Rose & Al‐Samarrai 2001) and the results of prior studies on
the differential effects of climate on girls’ and boys’ schooling outcomes (Björkman-Nyqvist
2013; Mani et al. 2013), we examine the interactions between climatic conditions and the child’s
10
4. Conceptual Model
Figure 1 presents a conceptual model of the relationship between environmental change,
agricultural production, and educational attainment for children living in farming households.
Changing environmental conditions (e.g. fluctuations in temperature and precipitation or soil
degradation) affect agricultural households by impacting agricultural productivity, which in turn
impacts household income. In response to negative income shocks, households may undertake a
number of adaptation measures that influence schooling outcomes. On the one hand, households
may reduce expenditures by changing food consumption habits, delaying health-seeking
behaviors, or pulling children out of school due to the inability to pay for school fees and
materials. On the other hand, households may generate additional income through involving
children in agricultural labor or in non-farm livelihood diversification strategies (e.g. selling
charcoal or panning for gold). An alternative outcome is that in times of reduced agricultural
productivity, the returns to child labor are lower than the returns to schooling, and therefore
children may be more likely to remain in school.
[Figure 1 about here]
The impact of environmental change on agricultural income is also mediated by
micro-level characteristics (e.g., wealth, use of drought-resistant crops, and social networks) as well as
macro-level factors (e.g., producer food prices, government safety net programs, and crop
insurance programs). Further, decisions on expenditures and income generation strategies are
affected by non-climatic factors such as the sex of the child, current levels of income
diversification, and local and distant labor market opportunities. Lastly, educational outcomes
are also affected by non-climatic factors such as distance to schools, schooling costs, and the
11
5. Data Collection and Study Area
This paper uses household survey data from the Ethiopian Rural Household Survey
(ERHS), a large panel dataset collected from rural villages in Ethiopia. The ERHS was
conducted with approximately 1,500 households in 15 Ethiopian villages in 1994, 1995, 1997,
1999, 2004, and 2009 (Dercon & Hoddinott 2009). Data were collected by Addis Ababa
University, the International Food Policy Research Institute (IFPRI), and the University of
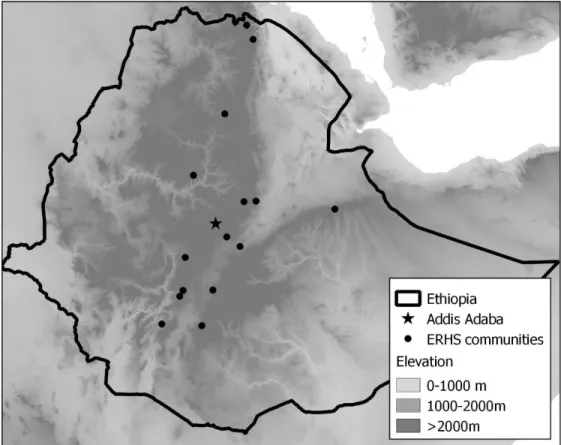
Oxford and are publicly available. Figure 2 displays the locations of the 15 villages, which were
selected in order to represent Ethiopia’s varied agro-ecological zones. The sample includes the
country’s main farming systems as of 1994, but cannot be considered nationally representative as
it does not include pastoralists or urban residents (Dercon et al. 2005). Within each study village
households were selected using a stratified random sampling method and linked across rounds
based on the residence of the male household head or the residence of the majority of household
members if the male head was absent (Dercon & Hoddinott 2009). The survey collected
household-level data on demographic and socioeconomic characteristics, agriculture and
livestock, health, and women and children’s activities, as well as community-level data in 1997,
2004, and 2009 on topics including electricity and water, road quality, education, and health
services (Dercon & Hoddinott 2009). The attrition rate at the household level is low, with 1.3%
of households per year lost between 1994 and 2004 (Dercon & Hoddinott 2009).
[Figure 2 about here]
The study villages range in elevation from 1200 to 2900 m, mean annual rainfall ranges
from 470 to 1300 mm, and rainfall is highly seasonal (Gray & Mueller 2012). The majority of
study households rely on smallholder agriculture as their primary source of income. Households
12 wetter climates rely primarily on perennials including coffee, chat, and enset (false banana)
(Dercon & Hoddinott 2009). The study villages are characterized by high levels of poverty,
though there have been major improvements in access to services in recent years. In 1997,
among the fifteen study villages, one had access to electricity, two had access to piped water, and
five contained no primary school. By 2009, ten of the communities had access to electricity, five
had access to piped water, and only one community did not contain a primary school.
Educational attainment has improved dramatically in the communities. In 1994, 62% of children
aged 12 to 16 had no formal schooling, while by 2009 only 12% had never attended school.
Despite these improvements, levels of poverty and food insecurity remain high. For example, in
2009, 52% of the households reported not being able to satisfy their food needs for at least three
months during the year prior to the survey.
6. Analysis 6.1 Climate data
Data on temperature and precipitation were derived from the Climate Research Unit
(CRU) Time Series (Harris et al. 2014). CRU provides monthly gridded mean temperature and
precipitation data with a resolution of 0.5˚ latitude by 0.5˚ longitude. The CRU dataset was
created by interpolating weather station data from over 4,000 stations throughout the world, and
these data are considered reliable sources of climate information for sub-Saharan Africa (Zhang
et al. 2013). We linked precipitation and temperature data to the survey data at the village level
using Global Positioning System points collected in the field, and then used these data to
generate measures of temperature and precipitation variability at the village-year scale. Figure 3
presents climate data for the study villages from 1970 to 2009. The top two panels display
13 villages, with many villages experiencing one primary rainy season between June and September
and others experiencing a short spring rainy season and a longer summer rainy season.
Temperatures in the study villages are generally highest during the summer months and lowest
during the winter months. The bottom two panels of Figure 3 present total annual rainfall and
mean annual temperatures over the 40-year timespan. Rainfall is highly variable, with observable
drought years occurring in 1984 and 2002, for example. Average annual temperatures exhibit a
clear warming trend over the time period.
[Figure 3 about here]
Our main measures of climate variability are temperature (˚C) and rainfall (mm/month)
relative to a 1970-2009 reference period for the three main seasons: spring rainy season (Belg)
from February to May, summer rainy season (Kiremt) from June to September, and winter dry
season (Bega) from October to January. To generate these measures, we took the mean climate
values for each season across years zero to six of life, where the year of birth was considered to
be year zero. These mean values were then transformed into z-scores relative to all other
consecutive periods from the same season of the same duration from 1970-2009. The early
childhood z-score is therefore an indication of how different the seasonal climate was during the
first seven years of a child’s life versus the historical seasonal climate in the child’s village. In
addition, for supplementary specifications we created two additional variability measures: mean
seasonal z-scores during school ages (age seven to current age) and z-scores in utero (the year
before birth). Alternate climate measures include shock variables that counted the number of
extreme springs, summers, and winters the child experienced during early childhood (hot, cold,
14 negative one (cold and dry)1.
6.2 Household survey data
We use data from the 1994, 1999, 2004, and 2009 rounds of the ERHS for the analysis.
The analytical sample includes children aged 12 to 16 at the time of the survey who were either
children or grandchildren of the household head. This captures children during late primary
school ages (12 to 14) and early secondary school ages (15 to 16). Prior research in the study
villages has found that the majority of out-migration occurs among individuals aged 15 to 39
(Gray & Mueller 2012), so examining children aged 12 to 16 captures an age range prior to when
most children begin leaving the household. Each child should appear in the dataset only once, as
they should only be within the sample ages during one of the four survey rounds. In order to
account for duplicate appearances due to the misreporting of ages for children who were
surveyed in multiple rounds, we performed an age-correction procedure2.
The primary outcome variables are whether the child completed at least one grade of
schooling (35% of children had zero grades of completed schooling) and whether the child
attended school during the year of the survey (57% were attending). In addition, we created a
categorical variable for schooling outcomes: no schooling completed, one to four grades
completed, and five to 12 grades completed. To account for other factors that may influence
educational outcomes, we included a number of control variables at the individual and household
1Studies of drought define moderate droughts as a z-score between -1.00 and -1.49, severe droughts as a z-score
between -1.50 and -1.99, and extreme droughts as a z-score less than -2.00 (Gebrehiwot et al. 2011; Dogan et al. 2012; Jain et al. 2015). We therefore use -1 and +1 as our cutoffs for extreme temperature and precipitation.
2We created a dataset to include individuals aged 0 to 31 in order to capture multiple appearances of the same
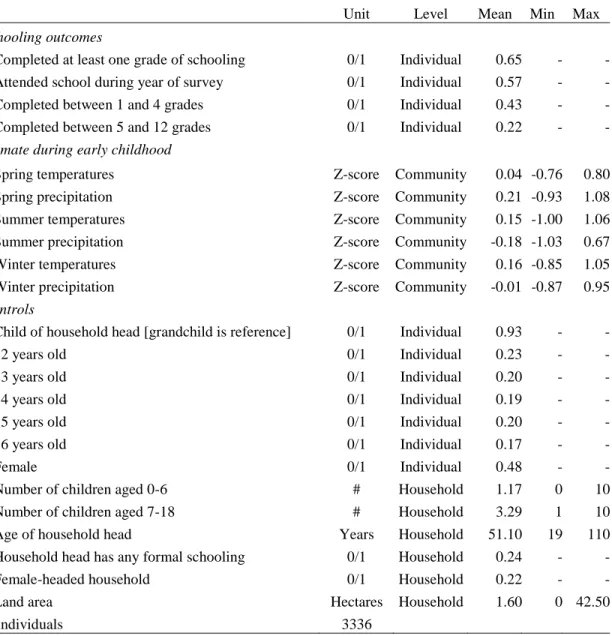
15 levels measured at the time of survey, shown in Table 1. These variables include relationship to
the household head (child or grandchild), dummy variables for the child’s year of age, the
number of children aged zero to six in the household, the number of children aged seven to 18 in
the household, age of the household head, whether the household head had any formal schooling,
and land area owned by the household in hectares. Because land ownership was highly skewed,
we transformed this variable in our models by taking the natural log of (land area + 1).
[Table 1 about here]
For the 1999, 2004, and 2009 survey rounds, children who entered the household since
the prior round were considered new household members. Because they entered the household
within five years of the survey, these children may have only been exposed to local climatic
conditions for a short period of time. We therefore exclude the new members from our analysis.
Excluding these individuals as well as those with missing data on outcome or control variables
leaves us with an analytic sample of 3,336 individuals (1,720 boys and 1,616 girls) from 1,227
households3.
6.3 Regression models
In order to understand the effects of precipitation and temperature variability on
educational attainment, we estimated a set of binary logistic regression models predicting the
likelihood of having completed at least one grade of schooling and separately the likelihood of
attending school during the year of the survey. The primary predictors were seasonal climatic
conditions during early childhood. In order to account for underlying differences in educational
3 Among the final sample, 41 households had missing values for land area. For these households, we averaged their
16 outcomes between communities and across time, we include both community and survey year
fixed-effects in the models, which account for all time-invariant factors at the community level
and all time-varying factors at the national level as long as these effects are linear. In addition,
we include corrections for clustering at the community level to account for non-independence
among households in the same community. Because we include community and survey year
fixed-effects in the models, the results can be interpreted as comparing the effect of the
predictors on two individuals living in the same community at the same time4. In addition, we
estimated a multinomial logistic regression model with three outcomes: no schooling completed,
between one and four grades completed, and between five and 12 grades completed.
In order to shed light on mechanisms underlying the relationship between climate
variability and educational outcomes, we estimated a supplementary set of models predicting per
capita food consumption, food insecurity during the rainy season, crop yields, and child labor, as
a function of climate from the year prior plus controls (see Appendix Table 1 for descriptive
statistics of all supplementary predictor and outcome variables)5. The crop data refer primarily to
crops grown during the summer rainy season and harvested in October and November of the year
prior to the survey. We use ordinary least squares (OLS) regression to estimate yields
(kg/hectare) of teff, barley, maize, and wheat based on temperature and precipitation during these
two seasons6. The majority of household surveys were conducted between March and
September, and therefore in the food consumption and child labor models we use climate data
4 We subjected the results of our primary models to two robustness checks. The first excluded all children with a
birth year error greater than ±1 year (see footnote 1 for a desription of the age correction procedure) and results were consistent. The second excluded children who may have migrated to the study villages after birth. We excluded all children for which the original household head in the 1994 survey arrived in the study village after 1977 (the year before which the oldest children in the sample were born) and results were also consistent.
5The sample for these analyses includes one observation per household-survey round for all households with
children in the sample. Households may appear more than once if children appear in multiple survey rounds.
17 from the current spring as well as the prior winter and summer. For these analyses, climate
variables were defined as z-scores for climate during these specific seasons (from the survey year
and year prior as indicated) relative to all other periods from the same season from 1970-2009.
Per capita food consumption consists of all food consumed in the week prior to the survey,
scaled to a month and then divided by the number of household members. Data on child labor
include whether or not the child typically participated in farm and domestic labor, as well as the
hours per week spent on those activities. Child labor data were only collected in the 2004 and
2009 surveys7. Fifty-seven percent of children participated in farm labor averaging 22 hours per
week, and 81% of children participated in domestic labor averaging 20 hours per week.
7. Results
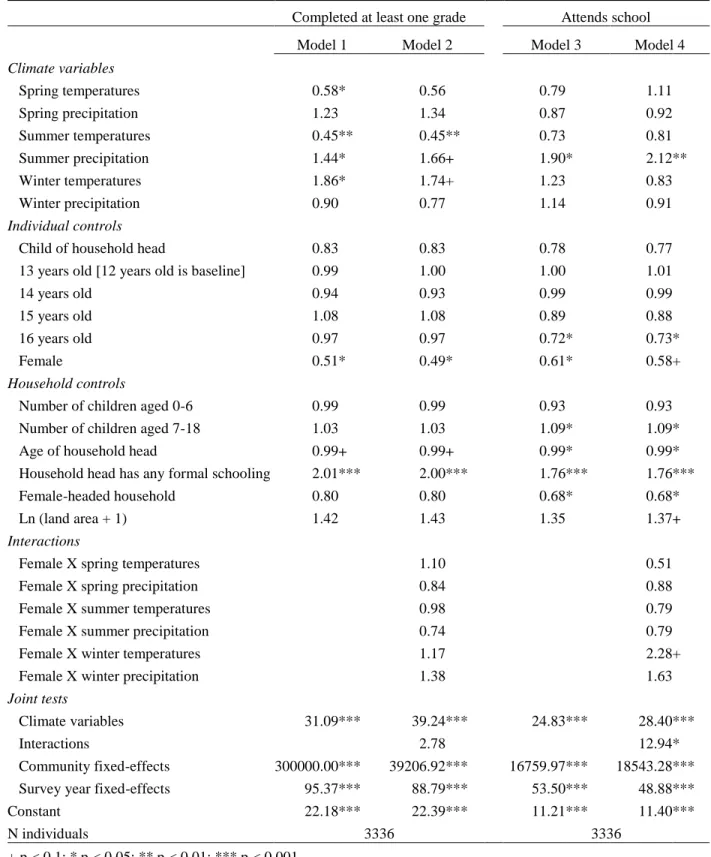
Model 1 in Table 2 presents results from a logistic regression of the likelihood of
completing at least one grade of school. We find that early life climatic conditions are important
determinants of schooling. A child who experienced average spring temperatures 0.5 standard
deviations (SD) above the village's long-term mean has a 21% lower odds of completing at least
one grade of school (p=0.049)8. Similarly, experiencing summer temperatures 0.5 SD above the
village long-term average is associated with a 28% lower odds of completing any schooling
(p=0.001), and experiencing summer precipitation 0.5 SD above the mean is associated with a
22% higher odds (p=0.050). Lastly, experiencing average early childhood winter temperatures
0.5 SD above the village long-term mean is associated with an 43% higher odds of any schooling
(p=0.016). These results suggest that mild temperatures (warmer winters and cooler springs and
summers) as well as greater precipitation during the summer agricultural season play a key role
7In 2004, the majority of households were surveyed in April and May, and in 2009 the majority were surveyed in
May and June.
8The mean seasonal early life z-scores for the climate variables range from -1.03 to 1.08. A SD of 0.5 is within the
18 in predicting future school attendance. Model 2 adds interactions between sex and climatic
conditions, and we find that the effects of climate on completing any schooling does not differ by
sex.
[Table 2 about here]
Model 3 presents results from a logit model of the likelihood of attending school during
the year of the survey. Children who experienced average early life summer rainfall 0.5 SD
above the village long-term average have a 45% higher odds of attending school (p=0.011). This
is consistent with Model 1, providing further evidence that precipitation during the Kiremt
growing season is an important predictor of future schooling outcomes. When sex interactions
are added in Model 4, we find that females are marginally significantly more likely to be
enrolled in school if they experienced warmer winters during early childhood, but there is no
relationship between winter temperatures and school attendance for males. Regarding the control
variables, the results are consistent with expectations. Females, individuals with older household
heads, and individuals for whom the household head has no formal schooling are less likely to
have completed any schooling. In addition, females, 16 year olds, individuals from households
with older heads, and those from female-headed households are less likely to attend school.
Lastly, having more children aged 7-18 in the household and having a household head who has
completed any formal schooling are positively associated with school attendance.
Table 3 presents the results from models using alternative specifications. Model 5
presents estimates from a multinomial logit model predicting the likelihood of having completed
either between one and four grades of schooling or between five and 12 grades versus no
schooling. Similar to the results of Model 1, the likelihood of having completed between one and
19 negatively associated with spring and summer temperatures during early childhood. Completion
of between five and 12 grades is positively associated with spring precipitation and winter
temperatures and is negatively associated with summer temperatures. These results suggest that
summer climate during the main growing season is particularly important for completion of early
primary schooling.
[Table 3 about here]
Models 6 and 7 examine climate variation during three life periods: school ages, early
childhood, and the year before birth. Consistent with Models 1 and 2, we find that climate during
early childhood is the most important period for predicting whether the child has completed any
schooling. In addition, greater summer precipitation during school ages is positively correlated
with completing at least one grade. We do not find a significant relationship between prenatal
climatic conditions and any schooling. With regard to school attendance, greater summer
precipitation during both school ages and early childhood, and less winter precipitation during
the prenatal period, are positively associated with school attendance during the year of the
survey. These findings suggest that climatic effects on child health and development during early
childhood play the strongest role in determining schooling outcomes, and that summer rainfall
during school ages is also important.
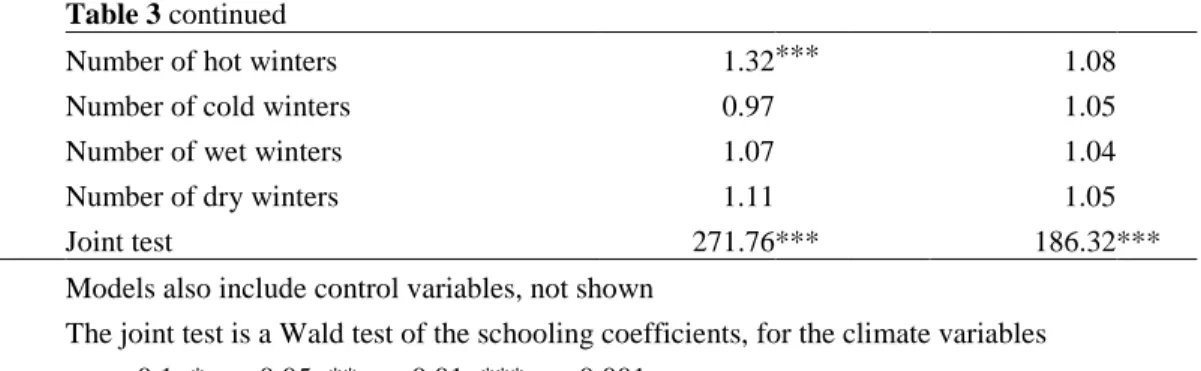
Models 8 and 9 examine the relationship between the number of climatic shocks
experienced in early childhood and schooling outcomes. Consistent with Model 1, we find that
with each additional summer drought experienced by a child in early childhood, he or she has a
16% lower odds of having completed any schooling. In addition, with each hot winter
experienced, the odds of completion increase by 32%. This indicates that droughts during the
20 damage due to frost and mildew) play a key role in future schooling outcomes. In addition, the
number of cold springs experienced in early childhood has a marginally positive effect on having
any schooling. Regarding the likelihood of school attendance during the year of the survey, the
number of cold springs and spring droughts experienced during early childhood both
significantly increase attendance.
In order to begin to uncover the mechanisms underlying the relationships between
climatic conditions and education, we present a number of supplementary models in Tables 4
and 5. The first model in Table 4 presents the results of an OLS regression on the relationship
between recent climatic conditions and per capita food consumption. We find that experiencing a
hotter spring in the year of the survey is associated with lower food consumption. While the
other climate variables are not significant, they are all in the expected directions, and taken
together these results suggest that warmer and drier springs and summers may lead to lower
household food availability. The second model presents results from a logit model predicting the
likelihood of experiencing food shortages during the prior rainy season, based on climatic
conditions during that season. We find that households that experienced Kiremt temperatures0.5
SD above the village long-term mean have a 25% greater odds of rainy season food insecurity
(p=0.008). Greater rainfall during the prior summer is negatively associated with food insecurity,
though the relationship is not statistically significant. These results indicate that both hot springs
and summers play a key role in reducing food availability among the study households.
[Table 4 about here]
The additional models in Table 4 examine the relationships between climate during the
prior growing season (summer) and harvesting season (winter) and crop yields for sample
21 households – hotter summers are associated with lower yields, and for wheat, greater winter
precipitation is associated with higher yields. Wetter summers are associated with higher yields
of all four cereal crops, though these relationships are not statistically significant. While data
limitations do not allow us to draw strong conclusions on the relationship between climate and
crop production among the study households, the results provide evidence that hot summers
reduce agricultural production for teff. In addition, results suggest that more rainfall during the
Kiremt growing season is beneficial for cereal crop yields.
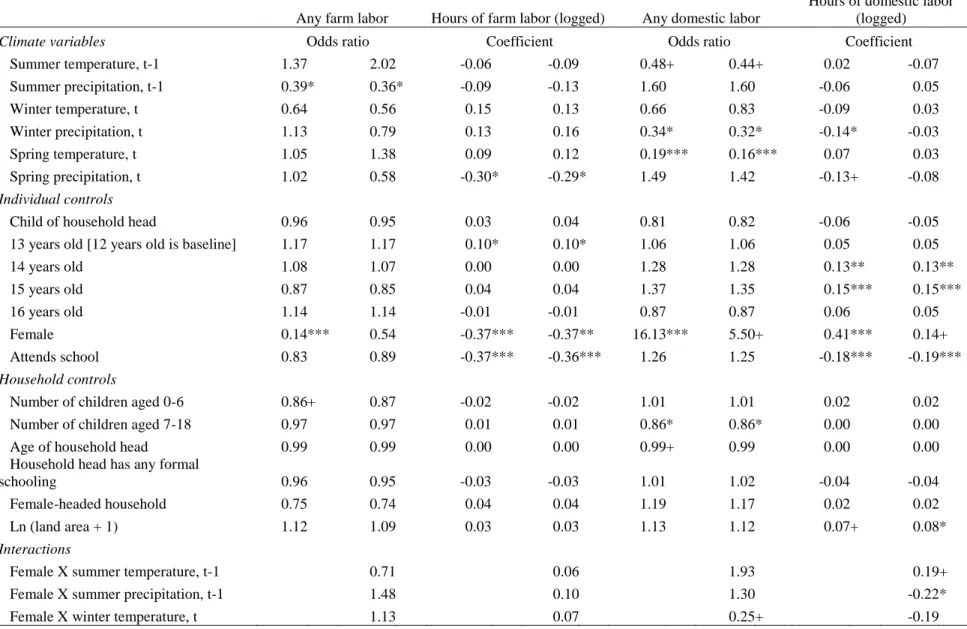
Table 5 presents results on the relationship between recent climatic conditions and child
labor. Consistent with the literature (Abebe 2007; Haile & Haile 2012; Rose & Al‐Samarrai
2001), we see that females are less likely to engage in farm labor and more likely to engage in
domestic labor than males. Further the number of hours spent on both farm and domestic labor is
negatively correlated with the likelihood of attending school. With regard to climate, we find that
experiencing higher precipitation during the prior summer is associated with a lower likelihood
of engaging in farm labor among boys. This result provides important insight into the
relationship between higher summer precipitation and a greater likelihood of having completed
any schooling as well as attendance during the year of the survey. More rainfall during the
summer growing season is likely associated with higher crop productivity, which reduces the
need for male children to participate in income generation activities and thereby enables them to
remain in school. When sex-climate interactions are added, we discover that females are less
likely to engage in farm labor if they experienced a warmer spring, and are marginally more
likely if they experienced a wetter spring. Cool, wet springs may encourage the planting of Belg
crops, necessitating help from girls in the household. Regarding hours typically spent per week
22 males and females. The net effect is a nonlinear effect of spring precipitation on farm labor by
girls, and a negative effect on boys.
[Table 5 about here]
For both males and females, hotter springs and drier winters are associated with a lower
likelihood of engaging in domestic labor. In addition, hotter summers and warmer winters are
marginally associated with a lower likelihood of domestic labor among both sexes and among
females, respectively. Further, experiencing greater winter and spring precipitation is associated
with performing fewer hours of domestic labor. When sex-climate interactions are added, we see
that there is no relationship between climate and hours of domestic labor among males. For
females, more summer precipitation is associated with fewer hours of domestic labor, and hotter
summers and springs are marginally associated with greater hours of domestic labor. This
finding suggests that during hotter, drier summers and springs, girls may be needed more for
domestic tasks as other family members spend more time on income generation activities due to
less ideal growing conditions. Warm, dry winters may increase domestic labor in agricultural
processing as this is the main harvest season.
8. Discussion and Conclusions
Taken together, these findings indicate that climate variability is an important
determinant of schooling outcomes among children from agricultural households in Ethiopia.
Early life climatic conditions – namely milder temperatures during all seasons and greater
rainfall during the summer Kiremt agricultural season – are associated with an increased
likelihood of a child having completed any education. In addition, greater summer rainfall during
both early life and school ages is associated with having completing any schooling as well as
23 drought a child experiences in early childhood, he or she has a 16% lower odds of having
completed any schooling.
Our findings suggest that multiple pathways may underlie the relationship between
climate and schooling. Adverse climatic conditions (hot springs and summers, dry summers, and
cold winters) may reduce agricultural productivity, which lowers household income as well as
food availability. Indeed, we find links between hot springs and/or summers and lower food
consumption, greater food insecurity, and lower teff yields among our study households. Early
childhood is a critical period for physical and cognitive development (Alderman 2011), and
therefore children experiencing poorer climatic conditions during this period of life may form
lower levels of biological human capital due to decreased nutrition and healthcare access.
Indeed, studies have discovered important links between climatic conditions and health at birth
and in early childhood (Grace et al. 2012; Grace et al. 2015). Further, research on rainfall and
education has found that children exposed to precipitation shocks in utero and early childhood
had lower educational attainment and cognitive abilities later in life (Akresh et al. 2012; Maccini
& Yang 2009; Rosales-Rueda 2014; Shah & Steinberg 2013). Our findings suggest that early
childhood adverse climatic conditions deplete individual and/or household capital, potentially
including biological human capital, and thereby undermine future educational outcomes.
In addition, we discover that greater summer precipitation during school ages is linked to
positive educational outcomes. Two pathways may underlie this relationship. The first is
between rainfall during the primary Kiremt growing season, agricultural production and income,
and the demand for child labor to assist with household income generation and domestic
activities. We find that higher precipitation during the summer prior to the survey is associated
24 domestic labor among girls. This pathway supports findings that school and labor compete for a
child’s time (Orkin 2012) and that a lack of rainfall may lead children to spend more time on
farm and domestic labor and less on schooling, as households face stresses on income generation
and food security. Another potential pathway underlying the relationship between summer
precipitation during school ages and educational outcomes is one between rainfall during the
primary Kiremt growing season, agricultural production and income, and the ability for
households to pay for school fees. Lower agricultural income as a result of summer droughts
may force households to pull children out of school in order to reduce expenditures.
These findings indicate that among the rural poor in sub-Saharan Africa, future climate
change may act as a key barrier to children’s school participation. Experiencing a greater
frequency of droughts and heat waves during the most important seasons for agricultural
production could slow progress toward human development goals and poverty alleviation in the
region. Yet we also find that warmer winters during early childhood are associated with positive
schooling outcomes in rural Ethiopia. In contrast to the dominant narrative that tends to view
warming temperatures as universally negative in this region of the world, our results suggest that
warming during winter – particularly in highland regions that are vulnerable to frost – may
actually benefit agricultural households. A nuanced understanding of how both temperature and
precipitation changes affect households in different agro-ecological zones is therefore a key step
towards holistically understanding the relationship between climatic change, agriculture, and
education. In addition, this study shows that an opportunity exists for future research to examine
socio-environmental outcomes of climate change outside of its effects on agriculture, migration,
and conflict, which have been the focus of much of the climate vulnerability literature. A greater
25 gender, food security, and livelihood diversification will greatly enhance our knowledge of the
feedbacks between climate, environment, and society.
Lastly, our findings suggest that policies to buffer against the economic and health
impacts of climate change will better enable households to keep their children in school, and will
protect them from the negative socioeconomic impacts of a changing climate. Examples of
programs and policies that could safeguard rural households against unfavorable climatic
conditions include crop insurance programs, the provision of drought and heat tolerant crop
varieties, and the reduction or elimination of school fees. Future research is needed to better
understand which pathways between climate variability and educational outcomes are most
important in different geographic, agro-ecological, and social contexts. This will help to inform
the development of effective policies to achieve the goal of universal primary and secondary
26
REFERENCES
Abebe, T., 2007. Changing livelihoods, changing childhoods: patterns of children’s work in rural
southern Ethiopia. Children’s Geographies, 5(1-2), pp.77–93.
Admassie, A., 2003. Child labour and schooling in the context of a subsistence rural economy:
can they be compatible? International Journal of Educational Development, 23(2), pp.167–
185.
Akresh, R. et al., 2012. Child Labor, Schooling, and Child Ability, Washington, DC: The World
Bank.
Alderman, H., 2011. No small matter: The Impact of Poverty, Shocks, and Human Capital
Investments in Early Childhood Development, Washington, DC: The World Bank.
Araya, A. & Stroosnijder, L., 2011. Assessing drought risk and irrigation need in northern
Ethiopia. Agricultural and Forest Meteorology, 151(4), pp.425–436.
Barrett, C.B., 2008. Poverty traps and resource dynamics in smallholder agrarian systems. In A.
Ruijs & R. Dellink, eds. Economics of Poverty, Environment and Natural Resource Use.
Springer, pp. 17–40.
Barrios, S., Ouattara, B. & Strobl, E., 2008. The impact of climatic change on agricultural
production: is it different for Africa? Food Policy, 33(4), pp.287–298.
Beegle, K., Dehejia, R. & Gatti, R., 2006. Child labor and agricultural shocks. Journal of
Development Economics, 81, pp.80–96.
Belachew, T. et al., 2011. Food insecurity, school absenteeism and educational attainment of
adolescents in Jimma Zone Southwest Ethiopia: a longitudinal study. Nutrition Journal, 10,
p.29.
27 at: http://www.csae.ox.ac.uk/evstudies/main.html [Accessed June 28, 2016].
Bezabih, M. & Di Falco, S., 2012. Rainfall variability and food crop portfolio choice: evidence
from Ethiopia. Food Security, 4(4), pp.557–567.
Björkman-Nyqvist, M., 2013. Income shocks and gender gaps in education: evidence from
Uganda. Journal of Development Economics, 105, pp.237–253.
Cockburn, J. & Dostie, B., 2007. Child work and schooling: the role of household asset profiles
and poverty in rural Ethiopia. Journal of African Economies, 16(4), pp.519–563.
Conway, D. & Schipper, E.L.F., 2011. Adaptation to climate change in Africa: challenges and
opportunities identified from Ethiopia. Global Environmental Change, 21(1), pp.227–237.
CSA, 2014. Statistical Report on the 2013 National Labour Force Survey, Addis Ababa.
Available at: http://www.csa.gov.et/images/general/news/nlfs_statstical_report_2013
[Accessed February 23, 2016].
CSA & ICF International, 2012. Ethiopia Demographic and Health Survey 2011, Addis Ababa
and Calverton, Maryland.
CSA & The World Bank, 2013. Ethiopia Rural Socioeconomic Survey (ERSS): Survey Report,
Addis Ababa.
Demeke, A.B., Keil, A. & Zeller, M., 2011. Using panel data to estimate the effect of rainfall
shocks on smallholders food security and vulnerability in rural Ethiopia. Climatic Change,
108(1-2), pp.185–206.
Dercon, S. & Hoddinott, J., 2009. The Ethiopian Rural Household Surveys 1989–2004:
Introduction. Available at:
http://www.ifpri.org/dataset/ethiopian-rural-household-surveys-erhs-1989-2004 [Accessed July 14, 2016].
28 Villages, 1999-2004. Journal of African Economics, 14(4), pp.559–585.
Dogan, S., Berktay, A. & Singh, V.P., 2012. Comparison of multi-monthly rainfall-based
drought severity indices, with application to semi-arid Konya closed basin, Turkey. Journal
of Hydrology, 470-471, pp.255–268.
Dorosh, P. & Schmidt, E., 2010. The rural-urban transformation in Ethiopia | IFPRI,
Washington, DC. Available at:
http://www.ifpri.org/publication/rural-urban-transformation-ethiopia [Accessed February 23, 2016].
Evangelista, P., Young, N. & Burnett, J., 2013. How will climate change spatially affect
agriculture production in Ethiopia? Case studies of important cereal crops. Climatic
Change. Available at: http://link.springer.com/article/10.1007/s10584-013-0776-6
[Accessed February 22, 2016].
FAO, 2011. Ethiopia Country Programming Framework, Addis Ababa.
FAO, 2012. FAO Statistical Yearbook 2012, Rome: Food and Agriculture Organization of the
United Nations. Available at: http://www.fao.org/docrep/015/i2490e/i2490e00.htm.
Gebrehiwot, T., van der Veen, A. & Maathuis, B., 2011. Spatial and temporal assessment of
drought in the Northern highlands of Ethiopia. International Journal of Applied Earth
Observation and Geoinformation, 13(3), pp.309–321.
Gitter, S.R. & Barham, B.L., 2007. Credit, natural disasters, coffee, and educational attainment
in rural Honduras. World Development, 35(3), pp.498–511.
Grace, K. et al., 2012. Child malnutrition and climate in Sub-Saharan Africa: An analysis of
recent trends in Kenya. Applied Geography, 35(1-2), pp.405–413.
Grace, K. et al., 2015. Linking climate change and health outcomes: Examining the relationship
29
Change, 35, pp.125–137.
Gray, C. & Mueller, V., 2012. Drought and Population Mobility in Rural Ethiopia. World
Development, 40(1), pp.134–145.
Haile, G. & Haile, B., 2012. Child labour and child schooling in rural Ethiopia: nature and
trade-off. Education Economics, 20(4), pp.365–385.
Harris, I. et al., 2014. Updated high-resolution grids of monthly climatic observations - the CRU
TS3.10 Dataset. International Journal of Climatology, 34(3), pp.623–642.
Hunt, F., 2008. Dropping Out from School: A Cross Country Review of the Literature, Sussex,
UK: ERIC.
Jain, V.K. et al., 2015. Comparison of drought indices for appraisal of drought characteristics in
the Ken River Basin. Weather and Climate Extremes, 8, pp.1–11.
Jury, M. & Funk, C., 2013. Climatic trends over Ethiopia: regional signals and drivers.
International Journal of Climatology, 33, pp.1924–1935.
Lewin, K.M., 2009. Access to education in Sub-Saharan Africa: patterns, problems and
possibilities. Comparative Education, 45(2), pp.37–41.
Lobell, D.B. & Field, C.B., 2007. Global scale climate–crop yield relationships and the impacts
of recent warming. Environmental Research Letters, 2(1), p.014002.
Maccini, S. & Yang, D., 2009. Under the weather: health, schooling, and economic
consequences of early-life rainfall. The American Economic Review, 99(3), pp.1006–1026.
Mani, S., Hoddinott, J. & Strauss, J., 2013. Determinants of schooling: empirical evidence from
rural Ethiopia. Journal of African Economies, 22(5), pp.693–731.
Ministry of Education, 2011. About the Ethiopian Education System. Available at:
30 Niang, I., O.C. Ruppel, M.A. Abdrabo, A. Essel, C. Lennard, J. Padgham, and P. Urquhart, 2014.
Climate Change 2014: Impacts, Adaptation, and Vulnerability. Part B: Regional Aspects.
Contribution of Working Group II to the Fifth Assessment Report of the Intergovernmental
Panel on Climate Change, Cambridge, United Kingdom and New York, NY, USA:
Cambridge University Press. Available at: https://www.ipcc.ch/report/ar5/wg2/.
Orkin, K., 2012. Are Work and Schooling Complementary or Competitive for Children in Rural
Ethiopia? A Mixed-Methods Study, Oxford, UK: Young Lives.
Porter, C., 2012. Shocks, consumption and income diversification in rural Ethiopia. Journal of
Development Studies, 48(9), pp.1209–1222.
Psacharopoulos, G., 1997. Child labor versus educational attainment: some evidence from Latin
America. Journal of Population Economics, 10(4), pp.377–86.
Rosales-Rueda, M.F., 2014. Impact of Early Life Shocks on Human Capital Formation :
Evidence El Nino Floods in Ecuador, University of California-Irvine.
Rose, P. & Al‐Samarrai, S., 2001. Household constraints on schooling by gender: empirical
evidence from Ethiopia. Comparative Education Review, 45(1), pp.36–63.
Russo, S. et al., 2016. When will unusual heat waves become normal in a warming Africa?
Environmental Research Letters, 11(5), p.054016.
Schlenker, W. & Lobell, D.B., 2010. Robust negative impacts of climate change on African
agriculture. Environmental Research Letters, 5(1), p.14010.
Seleshi, Y. & Zanke, U., 2004. Recent changes in rainfall and rainy days in Ethiopia.
International Journal of Climatology, 24(8), pp.973–983.
Seo, S., Mendelsohn, R. & Dinar, A., 2009. A Ricardian analysis of the distribution of climate
31
Resource Economics, 43(3), pp.313–332.
Shah, M. & Steinberg, B.M., 2013. Drought of opportunities: contemporaneous and long term
impacts of rainfall shocks on human capital, National Bureau of Economic Research.
United Nations, 2016. GOAL 4: Ensure inclusive and equitable quality education and promote
lifelong learning opportunities for all. Available at:
https://sustainabledevelopment.un.org/sdg4 [Accessed February 16, 2016].
United Nations, 2015. The Millennium Development Goals Report 2015, New York.
Viste, E., Korecha, D. & Sorteberg, A., 2013. Recent drought and precipitation tendencies in
Ethiopia. Theoretical and Applied Climatology.
World Bank, 2016. Agricultural irrigated land (% of total agricultural land) | Data | Table.
Available at: http://data.worldbank.org/indicator/AG.LND.IRIG.AG.ZS [Accessed
February 23, 2016].
World Bank, 2015a. Ethiopia - Overview. Available at:
http://www.worldbank.org/en/country/ethiopia/overview [Accessed January 26, 2016].
World Bank, 2015b. Rainfed Agriculture. Available at:
http://water.worldbank.org/topics/agricultural-water-management/rainfed-agriculture
[Accessed January 26, 2016].
Zhang, Q., Körnich, H. & Holmgren, K., 2013. How well do reanalyses represent the southern
32
33
34
35
Table 1. Descriptive statistics for variables used in main regression analyses
Unit Level Mean Min Max
Schooling outcomes
Completed at least one grade of schooling 0/1 Individual 0.65 - -
Attended school during year of survey 0/1 Individual 0.57 - -
Completed between 1 and 4 grades 0/1 Individual 0.43 - -
Completed between 5 and 12 grades 0/1 Individual 0.22 - -
Climate during early childhood
Spring temperatures Z-score Community 0.04 -0.76 0.80
Spring precipitation Z-score Community 0.21 -0.93 1.08
Summer temperatures Z-score Community 0.15 -1.00 1.06
Summer precipitation Z-score Community -0.18 -1.03 0.67
Winter temperatures Z-score Community 0.16 -0.85 1.05
Winter precipitation Z-score Community -0.01 -0.87 0.95
Controls
Child of household head [grandchild is reference] 0/1 Individual 0.93 - -
12 years old 0/1 Individual 0.23 - -
13 years old 0/1 Individual 0.20 - -
14 years old 0/1 Individual 0.19 - -
15 years old 0/1 Individual 0.20 - -
16 years old 0/1 Individual 0.17 - -
Female 0/1 Individual 0.48 - -
Number of children aged 0-6 # Household 1.17 0 10
Number of children aged 7-18 # Household 3.29 1 10
Age of household head Years Household 51.10 19 110
Household head has any formal schooling 0/1 Household 0.24 - -
Female-headed household 0/1 Household 0.22 - -
Land area Hectares Household 1.60 0 42.50
36
Table 2. Odds ratios from logistic regression models predicting the effects of early childhood climate on completion of at least one grade and on school attendance
Completed at least one grade Attends school
Model 1 Model 2 Model 3 Model 4
Climate variables
Spring temperatures 0.58 * 0.56 0.79 1.11
Spring precipitation 1.23 1.34 0.87 0.92
Summer temperatures 0.45 ** 0.45 ** 0.73 0.81
Summer precipitation 1.44 * 1.66 + 1.90 * 2.12 **
Winter temperatures 1.86 * 1.74 + 1.23 0.83
Winter precipitation 0.90 0.77 1.14 0.91
Individual controls
Child of household head 0.83 0.83 0.78 0.77
13 years old [12 years old is baseline] 0.99 1.00 1.00 1.01
14 years old 0.94 0.93 0.99 0.99
15 years old 1.08 1.08 0.89 0.88
16 years old 0.97 0.97 0.72 * 0.73 *
Female 0.51 * 0.49 * 0.61 * 0.58 +
Household controls
Number of children aged 0-6 0.99 0.99 0.93 0.93
Number of children aged 7-18 1.03 1.03 1.09 * 1.09 *
Age of household head 0.99 + 0.99 + 0.99 * 0.99 *
Household head has any formal schooling 2.01 *** 2.00 *** 1.76 *** 1.76 ***
Female-headed household 0.80 0.80 0.68 * 0.68 *
Ln (land area + 1) 1.42 1.43 1.35 1.37 +
Interactions
Female X spring temperatures 1.10 0.51
Female X spring precipitation 0.84 0.88
Female X summer temperatures 0.98 0.79
Female X summer precipitation 0.74 0.79
Female X winter temperatures 1.17 2.28 +
Female X winter precipitation 1.38 1.63
Joint tests
Climate variables 31.09 *** 39.24 *** 24.83 *** 28.40 ***
Interactions 2.78 12.94 *
Community fixed-effects 300000.00 *** 39206.92 *** 16759.97 *** 18543.28 ***
Survey year fixed-effects 95.37 *** 88.79 *** 53.50 *** 48.88 ***
Constant 22.18 *** 22.39 *** 11.21 *** 11.40 ***
N individuals 3336 3336
37
Table 3. Odds ratios from models predicting attainment and attendance during year of survey using alternative climate specifications or outcomes
1st-4th grade vs. no
schooling
5th-12th grade vs. no schooling
Model 5
Spring temperatures 0.54 * 0.97
Spring precipitation 1.00 1.73 *
Summer temperatures 0.43 *** 0.37 **
Summer precipitation 1.57 ** 1.24
Winter temperatures 1.58 + 2.31 *
Winter precipitation 0.96 0.75
Joint test 63.96***
Completed at least one
grade Attends school
Model 6 Model 7
Spring temperatures - school ages 1.11 0.66
Spring precipitation - school ages 1.11 1.16
Summer temperatures - school ages 0.93 1.36
Summer precipitation - school ages 1.92 *** 2.07 **
Winter temperatures - school ages 1.29 1.03
Winter precipitation - school ages 0.65 0.95
Spring temperatures - early childhood 0.59 0.66
Spring precipitation - early childhood 1.05 0.69
Summer temperatures - early childhood 0.36 ** 0.67
Summer precipitation - early childhood 1.90 *** 2.77 ***
Winter temperatures - early childhood 2.23 * 1.29
Winter precipitation - early childhood 0.82 1.13
Spring temperatures - prenatal 1.00 0.97
Spring precipitation - prenatal 1.01 0.97
Summer temperatures - prenatal 0.95 1.07
Summer precipitation - prenatal 1.12 1.11
Winter temperatures - prenatal 1.06 1.08
Winter precipitation - prenatal 0.93 0.85 *
Joint test 256.76 *** 433.48 ***
Model 8 Model 9
Number of hot springs 0.85 1.01
Number of cold springs 1.09 + 1.18 *
Number of wet springs 1.09 1.07
Number of dry springs 1.23 1.35 **
Number of hot summers 0.93 1.00
Number of cold summers 1.11 0.92
Number of wet summers 1.05 1.21
38
Table 3 continued
Number of hot winters 1.32 *** 1.08
Number of cold winters 0.97 1.05
Number of wet winters 1.07 1.04
Number of dry winters 1.11 1.05
Joint test 271.76 *** 186.32 ***
Models also include control variables, not shown
The joint test is a Wald test of the schooling coefficients, for the climate variables
39
Table 4. Results from models predicting per capita food consumption, rainy season food security, and crop yields based on recent climate
Per capita food consumption
(logged)
Household experienced food insecurity during
prior rainy season1
Crop yields (logged)
Teff Barley Maize Wheat
Coefficient Odds ratio Coefficient Coefficient Coefficient Coefficient Climate variables
Summer temperature, t-1 -0.18 1.50 ** -0.61 ** 0.09 -0.35 0.28
Summer precipitation, t-1 0.05 -0.64 0.05 0.12 0.23 0.20
Winter temperature, t 0.00 0.09 -0.01 -0.08 -0.13
Winter precipitation, t 0.03 -0.16 -0.31 0.01 0.35 *
Spring temperature, t -0.16 *
Spring precipitation, t 0.04
Household controls
Number of children aged 0-6 -0.11 *** 0.03 0.03 0.02 0.02 0.00
Number of children aged 7-18 -0.06 *** -0.07 0.00 0.03 0.02 0.02
Age of household head 0.00 0.00 0.01 * 0.00 0.00 0.00
Household head has any formal schooling 0.02 ** -0.08 * 0.01 0.01 0.02 0.01
Female-headed household -0.03 0.29 + -0.17 * -0.24 *** -0.11 -0.09 *
Ln (land area + 1) 0.19 ** -0.43 + -0.42 ** -0.50 * -0.03 -0.24 *
Joint tests
Climate variables 2.88 * 10.83 ** 8.57 ** 0.92 0.72 3.80 *
Community fixed-effects 35514.68 *** 21000.00 *** 6729.68 *** 641.20 *** 6520.23 *** 36473.63 ***
Survey year fixed-effects 12.11 *** 6.42 * 6.69 ** 2.95 + 10.52 ** 2.61
Constant 4.11 *** 0.19 * 5.15 *** 6.36 *** 5.96 *** 5.84 ***
N households 2394 1163 862 729 727 704
N villages 15 15 12 9 13 12
40
Table 5. Results from logit and OLS models on participation in and hours of child labor based on recent climate, 2004 and 2009
Any farm labor Hours of farm labor (logged) Any domestic labor
Hours of domestic labor (logged)
Climate variables Odds ratio Coefficient Odds ratio Coefficient
Summer temperature, t-1 1.37 2.02 -0.06 -0.09 0.48 + 0.44 + 0.02 -0.07
Summer precipitation, t-1 0.39 * 0.36 * -0.09 -0.13 1.60 1.60 -0.06 0.05
Winter temperature, t 0.64 0.56 0.15 0.13 0.66 0.83 -0.09 0.03
Winter precipitation, t 1.13 0.79 0.13 0.16 0.34 * 0.32 * -0.14 * -0.03
Spring temperature, t 1.05 1.38 0.09 0.12 0.19 *** 0.16 *** 0.07 0.03
Spring precipitation, t 1.02 0.58 -0.30 * -0.29 * 1.49 1.42 -0.13 + -0.08
Individual controls
Child of household head 0.96 0.95 0.03 0.04 0.81 0.82 -0.06 -0.05
13 years old [12 years old is baseline] 1.17 1.17 0.10 * 0.10 * 1.06 1.06 0.05 0.05
14 years old 1.08 1.07 0.00 0.00 1.28 1.28 0.13 ** 0.13 **
15 years old 0.87 0.85 0.04 0.04 1.37 1.35 0.15 *** 0.15 ***
16 years old 1.14 1.14 -0.01 -0.01 0.87 0.87 0.06 0.05
Female 0.14 *** 0.54 -0.37 *** -0.37 ** 16.13 *** 5.50 + 0.41 *** 0.14 +
Attends school 0.83 0.89 -0.37 *** -0.36 *** 1.26 1.25 -0.18 *** -0.19 ***
Household controls
Number of children aged 0-6 0.86 + 0.87 -0.02 -0.02 1.01 1.01 0.02 0.02
Number of children aged 7-18 0.97 0.97 0.01 0.01 0.86 * 0.86 * 0.00 0.00
Age of household head 0.99 0.99 0.00 0.00 0.99 + 0.99 0.00 0.00
Household head has any formal
schooling 0.96 0.95 -0.03 -0.03 1.01 1.02 -0.04 -0.04
Female-headed household 0.75 0.74 0.04 0.04 1.19 1.17 0.02 0.02
Ln (land area + 1) 1.12 1.09 0.03 0.03 1.13 1.12 0.07 + 0.08 *
Interactions
Female X summer temperature, t-1 0.71 0.06 1.93 0.19 +
Female X summer precipitation, t-1 1.48 0.10 1.30 -0.22 *
41
Table 5 continued
Female X winter precipitation, t 1.07 -0.06 0.81 -0.16
Female X spring temperature, t 0.50 *** -0.06 2.25 0.11 +
Female X spring precipitation, t 2.32 + -0.01 1.59 -0.10
Joint tests
Climate variables 17.81 ** 6.81 6.92 ** 3.55 * 150.48 *** 80.25 *** 7.73 *** 1.18
Interactions 44.81 *** 1.98 6.90 11.78 ***
Community fixed-effects 739.94 *** 3567.94 *** 16372.49 *** 2316.32 *** 4996.66 *** 3282.24 *** 2717.43 *** 1649.41 ***
Survey year fixed-effects 2.32 1.51 0.47 0.61 12.03 *** 10.29 ** 0.05 0.04
Constant 8.43 4.18 3.13 *** 3.10 *** 150.66 ** 225.03 ** 2.70 *** 2.79 ***
N individuals 1656 1109 1657 1338