Prevalence of Chlamydial and Gonococcal
Infections Among Young Adults
in the United States
William C. Miller, MD, PhD, MPH Carol A. Ford, MD
Martina Morris, PhD Mark S. Handcock, PhD John L. Schmitz, PhD Marcia M. Hobbs, PhD Myron S. Cohen, MD
Kathleen Mullan Harris, PhD J. Richard Udry, PhD
C
HLAMYDIA TRACHOMATIS ANDNeisseria gonorrhoeae infec-tions cause substantial mor-bidity in the United States.1 In women, chlamydial and gonococ-cal infections may cause pelvic inflam-matory disease, tubal infertility, chronic pelvic pain, and ectopic pregnancy.2,3 Chlamydial infection may also be linked
to cervical cancer.4 Chlamydial and
gonococcal infections may increase sus-ceptibility to and transmission of hu-man immunodeficiency virus in both men and women.5Because these infec-tions are easy to diagnose and curable with a single dose of oral antibiotics, early detection and treatment are an im-portant component of efforts to re-duce the disease burden.
Early detection of these infections is challenging because most women and men with chlamydial infection and many women with gonorrhea are asymptomatic.2,6However, infected per-sons who are asymptomatic can still transmit the infection to sexual part-ners and are at risk for
complica-Author Affiliations: Departments of Medicine (Drs Miller, Ford, Hobbs, and Cohen), Pediatrics (Dr Ford), Microbiology and Immunology (Drs Hobbs and Cohen), and Pathology and Laboratory Medi-cine (Dr Schmitz), School of MediMedi-cine; Departments of Epidemiology (Dr Miller) and Maternal and Child Health (Dr Udry), School of Public Health; Depart-ment of Sociology (Drs Harris and Udry); and the Carolina Population Center (Drs Harris and Udry),
University of North Carolina at Chapel Hill, Chapel Hill; and Departments of Sociology and Statistics (Drs Morris and Handcock), University of Washing-ton, Seattle.
Corresponding Author: William C. Miller, MD, PhD, MPH, Department of Epidemiology, University of North Carolina at Chapel Hill, CB#7435, 2105F McGavran-Greenberg, Chapel Hill, NC 27599-7435 ([email protected]).
Context Chlamydial and gonococcal infections are important causes of pelvic in-flammatory disease, ectopic pregnancy, and infertility. Although screening for Chla-mydia trachomatisis widely recommended among young adult women, little infor-mation is available regarding the prevalence of chlamydial and gonococcal infections in the general young adult population.
Objective To determine the prevalence of chlamydial and gonoccoccal infections in a nationally representative sample of young adults living in the United States.
Design, Setting, and Participants Cross-sectional analyses of a prospective co-hort study of a nationally representative sample of 14322 young adults aged 18 to 26 years. In-home interviews were conducted across the United States for Wave III of The National Longitudinal Study of Adolescent Health (Add Health) from April 2, 2001, to May 9, 2002. This study sample represented 66.3% of the original 18924 partici-pants in Wave I of Add Health. First-void urine specimens using ligase chain reaction assay were available for 12548 (87.6%) of the Wave III participants.
Main Outcome Measures Prevalences of chlamydial and gonococcal infections in the general young adult population, and by age, self-reported race/ethnicity, and geographic region of current residence.
Results Overall prevalence of chlamydial infection was 4.19% (95% confidence in-terval [CI], 3.48%-4.90%). Women (4.74%; 95% CI, 3.93%-5.71%) were more likely to be infected than men (3.67%; 95% CI, 2.93%-4.58%; prevalence ratio, 1.29; 95% CI, 1.03-1.63). The prevalence of chlamydial infection was highest among black women (13.95%; 95% CI, 11.25%-17.18%) and black men (11.12%; 95% CI, 8.51%-14.42%); lowest prevalences were among Asian men (1.14%; 95% CI, 0.40%-3.21%), white men (1.38%; 95% CI, 0.93%-2.03%), and white women (2.52%; 95% CI, 1.90%-3.34%). Prevalence of chlamydial infection was highest in the south (5.39%; 95% CI, 4.24%-6.83%) and lowest in the northeast (2.39%; 95% CI, 1.56%-3.65%). Overall prevalence of gonorrhea was 0.43% (95% CI, 0.29%-0.63%). Among black men and women, the prevalence was 2.13% (95% CI, 1.46%-3.10%) and among white young adults, 0.10% (95% CI, 0.03%-0.27%). Prevalence of coinfection with both chlamydial and gonococcal infections was 0.030% (95% CI, 0.18%-0.49%).
Conclusions The prevalence of chlamydial infection is high among young adults in the United States. Substantial racial/ethnic disparities are present in the prevalence of both chlamydial and gonococcal infections.
tions.2,6 Consequently, many major medical organizations recommend screening of adolescent and young adult women who are asymptomatic for chla-mydial infection.7-13 The identifica-tion of annual chlamydia screening among sexually experienced young women as a Health Plan Employer Data and Information Set measure14for qual-ity of care provided by managed care organizations highlights the recog-nized importance of screening. In con-trast, chlamydia screening for men has
been endorsed less consistently.9
Screening for gonorrhea is
recom-mended for high-risk women.8
Current screening recommenda-tions are based primarily on reported cases and clinic-based prevalence esti-mates. These estimates are suboptimal for informing policies because cases are underreported and clinic populations have limited generalizability. Population-based studies provide more accurate and representative prevalence estimates. However, to our knowledge, the only previous national prevalence estimate of chlamydial infection in the United States was limited to young men and had a rela-tively small sample size.15Other preva-lence estimates have been limited to single urban areas.16,17Wave III of The National Longitudinal Survey of Ado-lescent Health (Add Health) provides the first opportunity to determine the na-tional prevalence of chlamydial and gonococcal infection in young adult women and men in the United States. Using Wave III Add Health data, we as-sessed the general population esti-mates of the prevalence of chlamydial and gonococcal infection among young adults from different racial and ethnic groups. Additionally, we provided esti-mates of overlap of gonorrhea and chla-mydial infections.
METHODS
Study Design and Sample
Add Health is a prospective cohort study that has followed almost 20 000 adolescents into adulthood.18We de-scribe cross-sectional analyses based on Wave III of Add Health (April 2, 2001, to May 9, 2002), which targeted all
original Wave I participants currently living in the continental United States, Hawaii, and Alaska. The University of North Carolina institutional review board approved all study procedures.
The sampling design for Add Health has been described in detail else-where.18,19The primary sampling frame for the original Add Health sample in-cluded all high schools in the United States with an 11th grade and at least 30 enrollees in the school. From this sam-pling frame, a systematic random sample of 80 high schools and 52 middle schools in the United States was chosen with un-equal probability of selection. The sam-pling of schools was stratified to en-sure that the schools were representative of US schools with respect to region, ur-banicity, school type, percentage of white students, and school size. For each high school selected, the largest feeder school, usually a middle school, was also re-cruited.
The original study participants were identified from rosters of students in grades 7 through 12 enrolled in the se-lected schools, early in the 1994-1995 school year. The random sample of stu-dents was stratified by grade and sex. Black youth in families with relatively higher socioeconomic status and cer-tain Latino groups were oversampled to increase the precision of estimates for these ethnic groups. For Wave III, post-stratification sampling weights were cal-culated to account for persons who could not be located or refused to par-ticipate. With these sampling weights, accounting for the school as the pri-mary sampling unit and using region of the country as a stratification vari-able, the Add Health cohort provided a representative sample of young adults aged 18 to 26 years in the United States.
Interviews and Specimen Collection
All original Wave I Add Health respon-dents who could be contacted were asked to identify a time and place for the Wave III interview. An inter-viewer traveled to their home or an-other suitable location identified by the potential participant. After obtaining
written consent for the interviews, in-terviewers conducted the approxi-mately 90-minute sessions in as pri-vate an area as possible. Interviewers entered questionnaire responses di-rectly into a computer. Participants used computer-assisted self-interview to an-swer potentially sensitive questions (eg, questions about sexual behavior).
Consent for testing for chlamydial and gonoccocal infections was ob-tained after interview completion. Par-ticipants received $10 for providing a urine specimen. Participants who pro-vided a urine specimen received infor-mation regarding chlamydial, gonococ-cal, and other sexually transmitted infections and were encouraged to call a toll-free telephone number for test re-sults. Participants were also informed that they were not being tested for all sexually transmitted infections and should not view their participation in the Add Health study as a substitute for health care. Results of assays for chla-mydial and gonococcal infections were not reported to local public health de-partments, based on the terms of a Cer-tificate of Confidentiality obtained from the US Department of Health and Hu-man Services. A more detailed descrip-tion of Add Health sexually transmit-ted infection testing is available elsewhere.20
pro-cessed on the day of arrival by trained laboratory technologists.
C trachomatisandN gonorrhoeaewere identified in urine specimens by using ligase chain reaction (LCR) assays (Ab-bott Laboratories, Ab(Ab-bott Park, Ill). Li-gase chain reaction assays were per-formed according to the manufacturer’s instructions, except that specimens ex-ceeding the recommended volume of 20 mL were tested. The testing labora-tory performed sample processing in a dedicated preamplification area that was monitored routinely for contamina-tion by wipe testing. An open vial was maintained on the bench top and then carried through sample processing to monitor contamination. A laboratory-prepared positive control was also pro-cessed with each run as an external monitor of sample processing and de-tection. The postamplification area, in-cluding instrumentation, was moni-tored by wipe testing in a similar fashion to the preamplification area. Routine in-strumentation monitoring and preven-tive maintenance was performed per the manufacturer’s recommendations. The LCR results were reviewed for accept-ability by the responsible technologist as well as a second individual. Ligase chain reaction results were expressed as a signal to cutoff ratio determined by relating the sample rate for each speci-men to the cutoff value of assay cali-brator duplicates. The Abbott ana-lyzer automatically performed these calculations. All chlamydial and gono-coccal samples with a signal to cutoff ratio of at least 0.80 were retested to minimize the potential for false-positive test results.20Retested samples with a signal to cutoff ratio of at least 1.00 were considered positive. All test results were entered into a database by an individual technologist who used a bar code scanner to ensure accurate re-sult-sample identification. Two addi-tional reviewers verified the computer entry.
After completion of data collection, Abbott Laboratories issued a recall for certain lots ofN gonorrhoeaeLCR as-says. Results from these assays (n=859, 6.0%), whether positive or negative,
were excluded from the gonorrhea prevalence estimates.
Outcome Measures
In addition to measuring the preva-lence of chlamydial and gonococcal in-fections, our analyses included 3 demo-graphic variables: age based on reported birth date, race/ethnicity (self-reported as white, black, Native American, Asian American, or Latino), and geographic re-gion of current residence (northeast, south, midwest, or west). In some cases, participant self-identified more than 1 racial/ethnic group. In that circum-stance, we used a follow-up question identifying the group with which a par-ticipant primarily identified. We also in-cluded 3 measures assessing symp-toms of infection in the 24-hour period preceding the interview: painful urina-tion (dysuria), urethral discharge (men), and vaginal discharge (women).
Statistical Analyses
To ensure the national representation of our prevalence estimates for chla-mydial and gonococcal infections, we used Stata version 7.0 (Stata Corp, Col-lege Station, Tex) to account for the complex survey design of Add Health, incorporating the school as the pri-mary sampling unit, region as a strati-fication variable, and appropriate post-stratification weights. We calculated 95% confidence intervals (CIs) using a logit transformation. Prevalence ra-tios with 95% CIs were calculated us-ing Poisson regression for survey data.21
Assessment of Test Performance and Nonresponse Biases
Given the relatively high prevalence of chlamydial infection and the potential impact of our observations on chla-mydia screening policies, we con-ducted a sensitivity analysis to assess the effects of 2 potential sources of bias, test performance and nonresponse, on the prevalence estimates for chlamydial in-fection. We used plausible estimates of sensitivity (0.80, 0.90) and specificity (0.98, 0.99, 0.995) of the LCR assay to assess the potential impact of test im-perfection on the prevalence
esti-mates.20,22,23We present the data from a very low estimate (sensitivity = 0.80 and specificity=0.98) and a realistic es-timate (sensitivity = 0.90 and specific-ity = 0.995). These analyses were performed in conjunction with the as-sessment of the effects of nonresponse. In Wave III of Add Health, 6% of the original Wave I study population re-fused participation and an additional 19% could not be located or were un-able to participate for other reasons. Nine percent of the original study popula-tion did not have a urine specimen avail-able for chlamydial testing; 14% did not have a specimen or result for gonococ-cal testing. This nonresponse can po-tentially bias the prevalence estimates under 2 conditions: if the response rate varies by an observed attribute, such as race or sex, which is associated with prevalence; or if the nonrespondents have a different pattern of prevalence from respondents with similar ob-served attributes. In the latter case, an unobserved attribute may influence both survey participation and level of risk.
To address the first source of poten-tial nonresponse bias, we used post-stratification weights developed by the Add Health research team to ensure that the observed sample has the proper race and sex distribution.
We addressed the second potential source of nonresponse bias through sen-sitivity analysis using the method de-scribed by Brookmeyer and Gail.24Given the proportion of missing assaysmiss, the prevalence in the observed assays+
obs, and the prevalence ratio of infection for the missing assays compared with the ob-served assays, the population preva-lence+can be estimated under differ-ent assumptions about the prevalence ratio from {[miss⫻+obs⫻]+[(1−miss)
⫻+
and twice as likely to have chlamydial in-fection.
RESULTS
Study Population
Of the 18924 Add Health participants in the nationally representative weighted Wave I sample, 1109 (5.9%) refused par-ticipation, 3493 (18.5%) could not be lo-cated or were unable to participate, and 14322 (75.7%) were located and agreed to participate in Wave III. Of these, 1130 (7.9%) refused to provide a urine speci-men, 226 (1.6%) were unable to pro-vide a specimen at the time of the inter-view, and 418 specimens (2.9%) could not be processed due to shipping or labo-ratory problems. In all, specimens from 12548 Wave III participants (87.6%), representing 66.3% of the original 18924 participants, were available forC tracho-matistesting. ForN gonorrhoeae test-ing, 11689 of the Wave III participants (81.6%) were included in the preva-lence estimates.
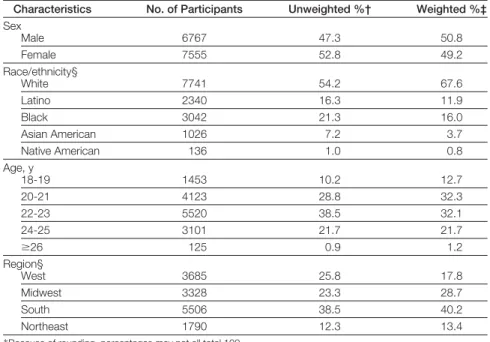
Including participants who did and did not provide urine specimens, 52.8% of the study sample were women
(TABLE1). The majority (54.2%) of par-ticipants were white, with substantial representation of black (21.3%), La-tino (16.3%), Asian American (7.2%), and Native American (1.0%) pants. The mean age of the partici-pants was 22.0 years (SD, 1.8 years).
Prevalence of Chlamydial Infection The overall prevalence of chlamydial in-fection in our sample of young adults was 4.19% (95% CI, 3.48%-4.90%). Preva-lence varied little by age (TABLE2), but was more common among women (4.74%) than men (3.67%; prevalence ra-tio, 1.29; 95% CI, 1.03-1.63). Preva-lence was more than 2 times higher in the south (5.39%) than in the northeast (2.39%) region (prevalence ratio, 2.26; 95% CI, 1.39-3.66).
The prevalence of chlamydial infec-tion varied significantly by race/ ethnicity (Table 2). Prevalence was low-est in white young adults (1.94%) and more than 6 times higher in black young adults (12.54%; prevalence ra-tio, 6.46; 95% CI, 4.68-8.91). The prevalence was also high in Native
American young adults (10.41%), al-though this estimate is imprecise. In-termediate prevalences were observed in Latino young adults (5.89%). The prevalence among Asian American young adults (2.10%) was compa-rable with that of white young adults. We observed similar patterns after stratifying by both race/ethnicity and sex (TABLE3). The highest prevalence in any group was among black women (13.95%), followed by black men (11.12%). The lowest prevalences were among Asian American men (1.14%), white men (1.38%), and white women (2.52%).
Nearly all participants (⬎95%) with chlamydial infection did not report symptoms in the 24 hours preceding specimen collection. Among men with chlamydial infection, the prevalences of urethral discharge and dysuria were only 3.33% and 1.88%, respectively. The prevalences of urethral discharge and dysuria among men without chla-mydial infection were 0.02% and 0.97%, respectively. Among women with chla-mydial infection, the prevalences of vaginal discharge and dysuria were 0.26% and 4.21%, respectively. The prevalences of vaginal discharge and dysuria among women without chla-mydial infection were similar at 1.4% and 3.28%, respectively.
Among young adults who reported symptoms, the prevalence of chla-mydial infection was much higher for men than women. Among the small number of young men reporting ure-thral discharge (n = 17), the preva-lence of chlamydial infection was high (38.46%), whereas the prevalence of chlamydial infection was only 6.01% among the women reporting dysuria (n = 232) and 0.93% among those re-porting vaginal discharge (n = 98).
Prevalence of Gonorrhea
The overall prevalence of gonorrhea among young US adults was low (0.43%; 95% CI, 0.29%-0.63%). The prevalence of gonorrhea varied little by sex and age but was lower in the west (Table 2). However, substantial differ-ences were observed by
race/ethnic-Table 1.Characteristics of the Wave III of The National Longitudinal Study of Adolescent Health Study Population (N = 14 322)*
Characteristics No. of Participants Unweighted %† Weighted %‡
Sex
Male 6767 47.3 50.8
Female 7555 52.8 49.2
Race/ethnicity§
White 7741 54.2 67.6
Latino 2340 16.3 11.9
Black 3042 21.3 16.0
Asian American 1026 7.2 3.7
Native American 136 1.0 0.8
Age, y
18-19 1453 10.2 12.7
20-21 4123 28.8 32.3
22-23 5520 38.5 32.1
24-25 3101 21.7 21.7
ⱖ26 125 0.9 1.2
Region§
West 3685 25.8 17.8
Midwest 3328 23.3 28.7
South 5506 38.5 40.2
Northeast 1790 12.3 13.4
*Because of rounding, percentages may not all total 100. †Reflects the percentage of the characteristic in the study sample. ‡Reflects the representative proportion in the target US population.
ity. The prevalence of gonorrhea was approximately 2% for both black men and women, which was 36 times greater and 14 times greater than white men and women, respectively (Table 3).
In this general population sample of young adults, most persons with gon-orrhea were asymptomatic. Among men with gonorrhea, 4.43% reported dys-uria and none reported a penile dis-charge in the previous 24 hours. Among women, 12.36% reported dysuria and 0.88% reported vaginal discharge.
Chlamydial and Gonococcal Coinfection
The overall prevalence of coinfection with both chlamydial and gonococcal infections was 0.30% (95% CI, 0.18%-0.49%). Among persons with gonor-rhea, the prevalence of chlamydial in-fection was extremely high (69.97%; 95% CI, 51.66%-83.56%). This preva-lence was similar among men (69.81%; 95% CI, 43.52%-87.40%) and women (70.15%; 95% CI, 43.69%-87.68%).
The prevalence of gonorrhea was also relatively high among those partici-pants with chlamydial infection (7.29%; 95% CI, 4.69%-11.16%). Among men with chlamydial infection, the preva-lence of gonorrhea was 8.65% (95% CI, 4.77%-15.19%) and among women, it was 6.24% (95% CI, 3.05%-12.36%).
Sensitivity Analyses
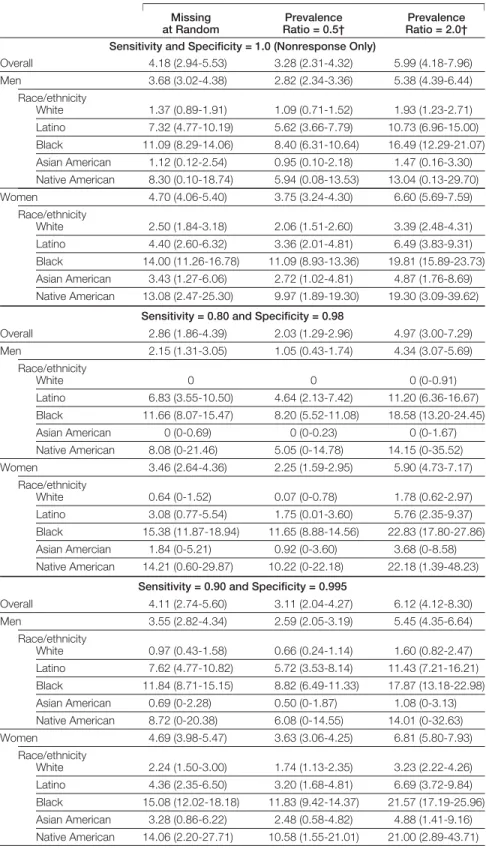
To ensure that the prevalence esti-mates for chlamydial infection were not too high, we conducted sensitivity analyses to assess the impact of nonre-sponse and diagnostic test perfor-mance on the prevalence estimates for chlamydial infection using several plau-sible estimates for nonresponse and test performance (TABLE4).
To provide a direct estimate of the po-tential effect of nonresponse bias, we es-timated the prevalence with different nonresponse conditions, without con-sidering test performance. If persons without urine specimens were missing at random, the prevalence estimate is minimally affected (4.18%; 95% CI, 2.94%-5.53%). If the prevalence of chla-mydial infection was twice as high among
persons without a urine specimen vs those with a urine specimen (=2.0), the overall estimate for chlamydial infec-tion would increase to 5.99% (95% CI, 4.18%-7.96%). If the prevalence of chla-mydial infection was half as high among nonresponders (= 0.5), the overall prevalence would decrease to 3.28% (95% CI, 2.31%-4.32%).
To provide an estimate of the maxi-mum potential bias, we then consid-ered the potential effects of poor test performance (sensitivity = 0.80 and specificity = 0.98) while simulta-neously accounting for the effects of nonresponse. Estimates were lower than unadjusted estimates for most groups if nonrespondents were considered
Table 2.Prevalence of Chlamydial and Gonococcal Infections by Sex, Age, Race/Ethnicity, and Region
Chlamydial Infection Gonorrhea
Prevalence (95% CI)
Prevalence Ratio (95% CI)
Prevalence (95% CI)
Prevalence Ratio (95% CI)
Sex
Male 3.67 (2.93-4.58)* 1.00 0.44 (0.26-0.77) 1.00 Female 4.74 (3.93-5.71) 1.29 (1.03-1.63) 0.42 (0.24-0.73) 0.95 (0.43-2.08) Race/ethnicity
White 1.94 (1.53-2.47) 1.00 0.10 (0.03-0.27) 1.00 Latino 5.89 (4.57-7.57) 3.03 (2.13-4.32) 0.20 (0.07-0.55) 2.06 (0.47-8.92) Black 12.54 (10.23-15.29) 6.46 (4.68-8.91) 2.13 (1.46-3.10) 21.76 (7.16-66.13) Asian American 2.10 (1.12-3.90) 1.08 (0.59-2.10) NA NA Native American 10.41 (6.37-16.56) 5.36 (3.12-9.19) NA NA Age, y
18-19 4.05 (2.83-5.77) 1.14 (0.73-1.78) 0.12 (0.03-0.44) 0.49 (0.08-2.90) 20-21 4.70 (3.55-6.19) 1.32 (0.89-1.95) 0.64 (0.36-1.14) 2.67 (0.70-10.27) 22-23 4.10 (3.16-5.32) 1.15 (0.84-1.58) 0.47 (0.22-0.98) 1.95 (0.47-8.01) 24-25 3.56 (2.73-4.64) 1.00 0.24 (0.07-0.78) 1.00
ⱖ26 5.67 (2.30-13.29) 1.59 (0.63-3.99) 0.34 (0.05-2.46) 1.42 (0.13-14.98) Region
West 3.17 (2.40-4.17) 1.33 (0.80-2.20) 0.04 (0.01-0.29) 0.10 (0.01-0.85) Midwest 3.95 (2.72-5.70) 1.65 (0.94-2.92) 0.43 (0.19-1.00) 0.99 (0.26-3.68) South 5.39 (4.24-6.83) 2.26 (1.39-3.66) 0.59 (0.37-0.94) 1.34 (0.44-4.10) Northeast 2.39 (1.56-3.65) 1.00 0.44 (0.16-1.21) 1.00
Abbreviations: CI, confidence interval; NA, not available.
*Weighted percentage reflects the representative proportion in the target US population.
Table 3.Prevalence of Chlamydial and Gonococcal Infections by Sex and Race/Ethnicity
Race/Ethnicity
Chlamydial Infection Gonorrhea
Prevalence (95% CI)
Prevalence Ratio (95% CI)
Prevalence (95% CI)
Prevalence Ratio (95% CI)
Men
White 1.38 (0.93-2.03)* 1.00 0.07 (0.01-0.48) 1.00 Latino 7.24 (4.92-10.54) 5.26 (3.02-9.17) 0.27 (0.08-0.87) 4.08 (0.40-41.55) Black 11.12 (8.51-14.42) 8.08 (5.09-12.83) 2.36 (1.40-3.95) 36.20 (4.63-282.57) Asian American 1.14 (0.40-3.21) 0.83 (0.29-2.38) NA NA Native American 7.99 (3.65-16.60) 5.80 (2.47-13.63) NA NA
Women
White 2.52 (1.90-3.34) 1.00 0.13 (0.04-0.43) 1.00 Latino 4.42 (3.06-6.36) 1.75 (1.10-2.79) 0.13 (0.02-0.90) 1.00 (0.10-9.67) Black 13.95 (11.25-17.18) 5.53 (3.84-7.96) 1.91 (1.00-3.61) 14.64 (3.79-56.56) Asian American 3.31 (1.63-6.63) 1.31 (0.61-2.81) NA NA Native American 13.34 (5.68-28.26) 5.29 (2.24-12.48) NA NA
Abbreviations: CI, confidence interval; NA, not available.
missing at random or one half as likely to be infected (= 0.5). Estimates re-mained slightly higher than unad-justed estimates if nonrespondents were considered twice as likely to be in-fected (= 2.0). Estimates remained high for black adults regardless of test performance. The prevalence esti-mates were 0 for the white and Asian American men, suggesting test perfor-mance was unlikely to be this poor.
We then examined estimates with conditions that approximated ex-pected test performance (sensitiv-ity=0.90 and specificity=0.995). In this circumstance, estimates were gener-ally comparable with those obtained with adjustment for nonresponse alone. Typically, estimates for low preva-lence populations were reduced slightly and those for high prevalence popula-tions were increased.
COMMENT
Add Health provides the most compre-hensive assessment to date of the preva-lence of chlamydial and gonococcal in-fections in young US adults. More than 4% of all young adults were infected with C trachomatis. The prevalence of chla-mydial infection was higher among young women than men but this differ-ence was not substantial. In this nation-ally representative sample, the preva-lence of chlamydial infection was more than 6 times greater in black vs white young adults, and also high in Native American and Latino young adults. Al-though the overall prevalence of orrhea was low, the prevalence of gon-orrhea was markedly higher among black young adults than other groups. The marked differences in these sexu-ally transmitted infections across racial and ethnic groups are disturbing. Al-though reporting bias and minority groups’ disproportionate use of pub-licly funded clinics may affect previous prevalence estimates derived from clin-ics, these sources of bias cannot explain the racial/ethnic disparities observed in our general population sample. The Add Health study design ensured that preva-lence estimates would be independent of reporting by clinicians and health care
Table 4.Sensitivity Analyses Demonstrating Estimated Prevalence of Chlamydial Infection Accounting for Nonresponse to the Survey and Diagnostic Test Performance
Prevalence (95% Confidence Interval)*
Missing at Random
Prevalence Ratio = 0.5†
Prevalence Ratio = 2.0†
Sensitivity and Specificity = 1.0 (Nonresponse Only)
Overall 4.18 (2.94-5.53) 3.28 (2.31-4.32) 5.99 (4.18-7.96) Men 3.68 (3.02-4.38) 2.82 (2.34-3.36) 5.38 (4.39-6.44)
Race/ethnicity
White 1.37 (0.89-1.91) 1.09 (0.71-1.52) 1.93 (1.23-2.71) Latino 7.32 (4.77-10.19) 5.62 (3.66-7.79) 10.73 (6.96-15.00)
Black 11.09 (8.29-14.06) 8.40 (6.31-10.64) 16.49 (12.29-21.07) Asian American 1.12 (0.12-2.54) 0.95 (0.10-2.18) 1.47 (0.16-3.30) Native American 8.30 (0.10-18.74) 5.94 (0.08-13.53) 13.04 (0.13-29.70)
Women 4.70 (4.06-5.40) 3.75 (3.24-4.30) 6.60 (5.69-7.59) Race/ethnicity
White 2.50 (1.84-3.18) 2.06 (1.51-2.60) 3.39 (2.48-4.31)
Latino 4.40 (2.60-6.32) 3.36 (2.01-4.81) 6.49 (3.83-9.31) Black 14.00 (11.26-16.78) 11.09 (8.93-13.36) 19.81 (15.89-23.73)
Asian American 3.43 (1.27-6.06) 2.72 (1.02-4.81) 4.87 (1.76-8.69) Native American 13.08 (2.47-25.30) 9.97 (1.89-19.30) 19.30 (3.09-39.62)
Sensitivity = 0.80 and Specificity = 0.98
Overall 2.86 (1.86-4.39) 2.03 (1.29-2.96) 4.97 (3.00-7.29)
Men 2.15 (1.31-3.05) 1.05 (0.43-1.74) 4.34 (3.07-5.69) Race/ethnicity
White 0 0 0 (0-0.91)
Latino 6.83 (3.55-10.50) 4.64 (2.13-7.42) 11.20 (6.36-16.67) Black 11.66 (8.07-15.47) 8.20 (5.52-11.08) 18.58 (13.20-24.45) Asian American 0 (0-0.69) 0 (0-0.23) 0 (0-1.67)
Native American 8.08 (0-21.46) 5.05 (0-14.78) 14.15 (0-35.52) Women 3.46 (2.64-4.36) 2.25 (1.59-2.95) 5.90 (4.73-7.17)
Race/ethnicity
White 0.64 (0-1.52) 0.07 (0-0.78) 1.78 (0.62-2.97) Latino 3.08 (0.77-5.54) 1.75 (0.01-3.60) 5.76 (2.35-9.37)
Black 15.38 (11.87-18.94) 11.65 (8.88-14.56) 22.83 (17.80-27.86) Asian Amercian 1.84 (0-5.21) 0.92 (0-3.60) 3.68 (0-8.58) Native American 14.21 (0.60-29.87) 10.22 (0-22.18) 22.18 (1.39-48.23)
Sensitivity = 0.90 and Specificity = 0.995
Overall 4.11 (2.74-5.60) 3.11 (2.04-4.27) 6.12 (4.12-8.30) Men 3.55 (2.82-4.34) 2.59 (2.05-3.19) 5.45 (4.35-6.64)
Race/ethnicity
White 0.97 (0.43-1.58) 0.66 (0.24-1.14) 1.60 (0.82-2.47) Latino 7.62 (4.77-10.82) 5.72 (3.53-8.14) 11.43 (7.21-16.21) Black 11.84 (8.71-15.15) 8.82 (6.49-11.33) 17.87 (13.18-22.98)
Asian American 0.69 (0-2.28) 0.50 (0-1.87) 1.08 (0-3.13) Native American 8.72 (0-20.38) 6.08 (0-14.55) 14.01 (0-32.63)
Women 4.69 (3.98-5.47) 3.63 (3.06-4.25) 6.81 (5.80-7.93) Race/ethnicity
White 2.24 (1.50-3.00) 1.74 (1.13-2.35) 3.23 (2.22-4.26)
Latino 4.36 (2.35-6.50) 3.20 (1.68-4.81) 6.69 (3.72-9.84) Black 15.08 (12.02-18.18) 11.83 (9.42-14.37) 21.57 (17.19-25.96) Asian American 3.28 (0.86-6.22) 2.48 (0.58-4.82) 4.88 (1.41-9.16)
Native American 14.06 (2.20-27.71) 10.58 (1.55-21.01) 21.00 (2.89-43.71)
*Confidence interval is derived from bootstrap analyses.
seeking behavior. Furthermore, be-cause black young adults with rela-tively higher socioeconomic status and certain Latino groups were over-sampled, the precision of the preva-lence estimates for black and Latino young adults was enhanced. Our re-sults provide compelling evidence that nationwide disparities in chlamydial and gonococcal infections across racial/ ethnic groups are real rather than the re-sult of biased estimates.
The observed disparities in chla-mydial and gonococcal infections by racial and ethnic groups may be respon-sible, in part, for considerable differ-ences in reproductive health. Black women have 33% excess incidence in ectopic pregnancy compared with white women.25A substantial proportion of the excess mortality related to childbirth among black women in New York City is attributable to ectopic pregnancy.26 Given the well-recognized association of chlamydial and gonococcal infections with tubal scarring, infertility, and ecto-pic pregnancy,2,3efforts to reduce chla-mydial infection and gonorrhea in these populations may have important effects on morbidity and possibly mortality.
The low prevalence of gonorrhea is not unexpected. Unlike chlamydial in-fection, gonorrhea is frequently symp-tomatic, especially in men, and
com-monly necessitates medical care.6
Furthermore, the duration of gonococ-cal infections is believed to be shorter,27 which will result in a relative reduc-tion in prevalence, compared with chla-mydial infection. However, the very low prevalence of gonorrhea in these na-tional estimates contrasts with a sub-stantially higher prevalence observed in a population-based study in Balti-more, Md, in which the estimated prevalence was 5.3% among adults aged 18 to 35 years.16Baltimore has consis-tently had high reported incidence of gonorrhea,28and undoubtedly, the ob-served differences in prevalence re-lates to the highly clustered, geographi-cally varied distribution of gonorrhea.1,28 Previous population-based studies of the prevalence of chlamydial infection have been limited in scope.15 Among
young men, the prevalence of chla-mydial infection was 3.1% among 18-to 19-year-olds and 4.5% among 20- 18-to 26-year-olds, but the sample size was considerably smaller than the Add Health study sample, prevalence was not reported by race/ethnicity, and 95% CIs were not reported.15Other popu-lation-based studies in Baltimore and San Francisco, Calif, were limited geo-graphically and by sample size.16,17
Consistent with these more limited population-based prevalence stud-ies,15-17our results confirm that preva-lence estimates obtained from clinic-based data sources do not accurately reflect the true prevalence of chla-mydial infection among young adults. For example, in 2001, the Centers for Disease Control and Prevention (CDC) used clinic-based test reports to esti-mate incidence rates for chlamydial in-fection of 604.9 per 100 000 person-years for men and 2447.0 per 100000 person-years for women aged 20 to 24 years.1Converting the incidence rates of the CDC to prevalence and assuming a mean duration of infection of 6 months to 1.5 years,27the expected general popu-lation prevalence of chlamydial infec-tion would be between 0.3% and 0.9% in men and 1.2% and 3.6% in women. We found that the prevalence of chla-mydial infection among young US men and women is much higher. The Add Health estimates also provide a realis-tic counterpoint to clinic-based studies that may overstate the prevalence of chlamydial infection, such as those con-ducted in clinics in which relatively high-risk persons present for sexually trans-mitted disease or family planning services.
The high national prevalence of chla-mydial infection suggests that current screening strategies have failed to con-trol this easily curable sexually transmit-ted infection in young adult men and women. One possible explanation is that current recommendations for screen-ing may be inadequate. For example, young adult men who are asymptom-atic account for a large reservoir of in-fection in the general population but screening recommendations have largely
excluded men.8Although screening for adolescent boys was included as a rec-ommendation in the 1998 CDC guide-lines,9this recommendation was omit-ted in the more recent 2002 guidelines.8 Even if sexually experienced adoles-cents and young adults are observed in clinic settings and meet criteria for screening based on current recommen-dations, they may not be screened. The recommendations by the CDC regard-ing screenregard-ing of adolescent girls are not
widely observed.29-32 Moreover,
al-though most publicly funded clinics pro-vide chlamydial screening for women, many cannot screen all women who meet CDC guidelines due to budgetary con-straints.33Screening in private practice settings is even less common.29,30Our findings clearly support the importance of widespread implementation of cur-rent guidelines, including screening or treating persons with gonorrhea for chla-mydial infection.
has suggested that this bias in Add Health is minimal.38Although 24% of the participants in Wave I could not be lo-cated for Wave III, this element of non-response has been accounted for in the poststratification adjustment of the sam-pling weights for Wave III. Finally, our sensitivity analyses suggested that our conclusions were robust to differences in characteristics of nonrespondents and test performance.
In conclusion, we found the preva-lence of untreated asymptomatic chla-mydial infection to be high in young adults in the United States. The high prevalence of chlamydial infection in both men and women suggests that cur-rent screening approaches that focus primarily on clinic-based testing of young women are inadequate. The re-duction of disparities in the preva-lence of both chlamydial and gonococ-cal infections across racial/ethnic groups must also be a priority.
Author Contributions:Dr Miller had full access to all of the data in the study and takes responsibility for the integrity of the data and the accuracy of the data analysis.
Study concept and design:Miller, Ford, Cohen, Udry. Acquisition of data:Miller, Schmitz, Hobbs, Cohen, Harris, Udry.
Analysis and interpretation of data:Miller, Ford, Morris, Handcock, Cohen, Udry.
Drafting of the manuscript:Miller, Ford, Cohen. Critical revision of the manuscript for important in-tellectual content:Miller, Ford, Morris, Handcock, Schmitz, Hobbs, Cohen, Harris, Udry.
Statistical expertise:Miller, Morris, Handcock, Cohen. Obtained funding:Miller, Cohen, Udry.
Administrative, technical, or material support:Schmitz, Hobbs, Cohen, Harris, Udry.
Study supervision:Cohen, Harris, Udry.
Funding/Support:This study was supported in part by grants from the University of North Carolina Sexu-ally Transmitted Diseases Cooperative Research Cen-ter (National Institute of Allergy and Infectious Dis-eases UO131496), the National Institutes of Health (HD38210), and The Robert Wood Johnson Founda-tion Generalist Physician Faculty Scholar Award Pro-gram. This study also used data from Add Health, a program project designed by J. Richard Udry, PhD, Pe-ter S. Bearman, PhD, and Kathleen Mullan Harris, PhD, and funded by grant P01-HD31921 from the Na-tional Institute of Child Health and Human Develop-ment, with cooperative funding from 17 other agen-cies.
Role of the Sponsors:National Institute of Allergy and Infectious Diseases, the National Institutes of Health, The Robert Wood Johnson Foundation, and the Na-tional Institute of Child Health and Human Develop-ment did not participate in the design and conduct of the study, in the collection, analysis, and interpreta-tion of the data, or in the preparainterpreta-tion, review, or ap-proval of the manuscript.
Additional Information:Persons interested in obtain-ing data files from Add Health should contact Add
Health, Carolina Population Center, 123 W Franklin St, Chapel Hill, NC 27516-2524.
Acknowledgment:Special acknowledgment is due to Ronald R. Rindfuss, PhD, and Barbara Entwisle, PhD, for their assistance in the original design of Add Health.
REFERENCES
1.Centers for Disease Control and Prevention. Sexu-ally Transmitted Disease Surveillance, 2001. At-lanta, Ga: US Dept of Health and Human Services, Cen-ters for Disease Control and Prevention; 2002. 2.Cates W Jr, Wasserheit JN. Genital chlamydial in-fections: epidemiology and reproductive sequelae.Am J Obstet Gynecol.1991;164:1771-1781. 3.Westrom L, Eschenbach D. Pelvic inflammatory dis-ease. In: Holmes KK, Mardh PA, Sparling PF, et al, eds. Sexually Transmitted Diseases. 3rd ed. New York, NY: McGraw-Hill; 1999:783-809.
4.Wallin KL, Wiklund F, Luostarinen T, et al. A popu-lation-based prospective study ofChlamydia tracho-matisinfection and cervical carcinoma.Int J Cancer. 2002;101:371-374.
5.Fleming DT, Wasserheit JN. From epidemiological synergy to public health policy and practice: the con-tribution of other sexually transmitted diseases to sexual transmission of HIV infection.Sex Transm Infect.1999; 75:3-17.
6.Hook EW III, Handsfield HH. Gonococcal infec-tions in the adult. In: Holmes KK, Mardh PA, Sparling PF, et al, eds.Sexually Transmitted Diseases. 3rd ed. New York, NY: McGraw-Hill; 1999:451-466. 7.Centers for Disease Control and Prevention. Rec-ommendations for prevention and management of Chlamydia trachomatisinfections—1993.MMWR Re-comm Rep.1993;42(RR-12):1-39.
8.Centers for Disease Control and Prevention. Sexu-ally Transmitted Diseases Treatment Guidelines 2002. MMWR Recomm Rep.2002;51(RR-6):1-78. 9.Centers for Disease Control and Prevention. 1998 Guidelines for treatment of sexually transmitted dis-ease.MMWR Recomm Rep.1998;47(RR-1):1-111. 10.Hollblad-Fadiman K, Goldman SM. American Col-lege of Preventive Medicine Practice Policy State-ment: screening forChlamydia trachomatis.Am J Prev Med.2003;24:287-292.
11. Nelson HD, Helfand M. Screening for chla-mydial infection.Am J Prev Med.2001;20:95-107. 12.Committee on Practice and Ambulatory Medi-cine. Recommendations for preventive pediatric health care.Pediatrics.2000;105:645-646.
13.American Academy of Family Physicians. Sum-mary of policy recommendations for periodic health examinations. Available at: http://www.aafp.org /PreBuilt/PHErev54.pdf. Accessed April 13, 2004. 14.National Committee for Quality Assurance. The State of Managed Care Quality, 2001. Chlamydia screening in women. Available at: http://www.ncqa .org/somc2001/chlamydia/somc_2001_chl.html. Ac-cessed April 13, 2004.
15.Ku L, Louis MS, Farshy C, et al. Risk behaviors, medical care, and chlamydia infection among young men in the United States.Am J Public Health.2002; 92:1140-1143.
16. Turner CF, Rogers SM, Miller HG, et al. Un-treated gonococcal and chlamydial infection in a prob-ability sample of adults.JAMA.2002;287:726-733. 17. Klausner JD, McFarland W, Bolan G, et al. Knock-knock: a population-based survey of risk behavior, health care access, andChlamydia trachomatis infec-tion among low-income women in the San Francisco Bay Area.J Infect Dis.2001;183:1087-1092. 18.Bearman PS, Jones J, Udry JR. The National Lon-gitudinal Study of Adolescent Health: study design. Available at: http://www.cpc.unc.edu/projects /addhealth/design.html. Accessed April 13, 2004. 19.Resnick MD, Bearman PS, Blum RW, et al. Pro-tecting adolescents from harm: findings from the
Na-tional Longitudinal Study of Adolescent Health.JAMA. 1997;278:823-832.
20.The Add Health Biomarker Team. Biomarkers in Wave III of the Add Health Study. Available at: http: //www.cpc.unc.edu/projects/addhealth/files/biomark .pdf. Accessed April 13, 2004.
21. McNutt LA, Wu C, Xue X, Hafner JP. Estimating the relative risk in cohort studies and clinical trials of com-mon outcomes.Am J Epidemiol.2003;157:940-943. 22.Watson EJ, Templeton A, Russell I, et al. The ac-curacy and efficacy of screening tests forChlamydia trachomatis: a systematic review.J Med Microbiol. 2002;51:1021-1031.
23.Johnson RE, Newhall WJ, Papp JR, et al. Screen-ing tests to detectChlamydia trachomatisand Neis-seria gonorrhoeaeinfections—2002.MMWR Re-comm Rep.2002;51:1-38.
24.Brookmeyer R, Gail MH.AIDS Epidemiology: A Quantitative Approach. New York, NY: Oxford Uni-versity Press; 1994.
25. Saraiya M, Berg CJ, Shulman H, Green CA, Atrash HK. Estimates of the annual number of clinically rec-ognized pregnancies in the United States, 1981-1991.Am J Epidemiol.1999;149:1025-1029. 26.Fang J, Madhavan S, Alderman MH. Maternal mortality in New York City: excess mortality of black women.J Urban Health.2000;77:735-744. 27.Brunham RC, Plummer FA. A general model of sexually transmitted disease epidemiology and its im-plications for control.Med Clin North Am.1990;74: 1339-1352.
28. Centers for Disease Control and Prevention. Sexu-ally Transmitted Disease Surveillance, 2000. At-lanta, Ga: US Dept of Health and Human Services, Cen-ters for Disease Control and Prevention; 2001. 29.St Lawrence JS, Montano DE, Kasprzyk D, et al. STD screening, testing, case reporting, and clinical and part-ner notification practices: a national survey of US phy-sicians.Am J Public Health.2002;92:1784-1788. 30. Mangione-Smith R, McGlynn EA, Hiatt L. Screen-ing for chlamydia in adolescents and young women. Arch Pediatr Adolesc Med.2000;154:1108-1113. 31.Cook RL, Wiesenfeld HC, Ashton MR, et al. Bar-riers to screening sexually active adolescent women for chlamydia: a survey of primary care physicians. J Adolesc Health.2001;28:204-210.
32.Torkko KC, Gershman K, Crane LA, Hamman R, Baron A. Testing for chlamydia and sexual history tak-ing in adolescent females: results from a statewide sur-vey of Colorado primary care providers.Pediatrics. 2000;106:E32.
33.Miller WC, Hoffman IF, Owen-O’Dowd J, et al. Selective screening for chlamydial infection: which cri-teria to use?Am J Prev Med.2000;18:115-122. 34.Quinn K, Schoen C, Buatti L. On their own, young adults living without health insurance.The Common-wealth Fund. Available at: http://www.cmwf.org /programs/insurance/quinn_ya_391.asp. Accessed April 13, 2004.
35.The Commonwealth Fund. Sandman D, Simantov E, An C. Out of touch: American men and the health care system-commonwealth fund men’s and women’s health survey findings. Available at: http://www.cmwf .org/programs/women/sandman_men’ssurvey2000 _374.asp. Accessed April 13, 2004.