Protection against High-Fat Diet Induced Obesity in MDM2
C305FMice due to Reduced p53 Activity and Enhanced Energy
Expenditure
Shijie Liu1,2,*, Tae-Hyung Kim1,2,*, Derek A. Franklin1,2,3, and Yanping Zhang1,2,3,4,
1Department of Radiation Oncology, University of North Carolina at Chapel Hill, Chapel Hill, NC,
27599-7461, USA
2Lineberger Comprehensive Cancer Center, University of North Carolina at Chapel Hill, Chapel
Hill, NC, 27599-7461, USA
3Department of Pharmacology School of Medicine, University of North Carolina at Chapel Hill,
Chapel Hill, NC, 27599-7461, USA
4Jiangsu Center for the Collaboration and Innovation of Cancer Biotherapy, Cancer Institute,
Xuzhou Medical College, Xuzhou, Jiangsu 221002, China
Abstract
The RPL11-MDM2 interaction constitutes a p53 signaling pathway activated by deregulated ribosomal biosynthesis in response to stress. Mice bearing an MDM2C305F mutation that disrupts RPL11-MDM2 binding were analyzed on a high-fat diet (HFD). The Mdm2C305F/C305F mice, although phenotypically indistinguishable from WT mice when fed normal chow, demonstrated decreased fat accumulation along with improved insulin sensitivity and glucose tolerance after prolonged HFD feeding. We found that HFD increases expression of c-MYC and RPL11 in both WT and Mdm2C305F/C305F mice; however, p53 was only induced in WT but not in
Mdm2C305F/C305F mice. Reduced p53 activity in HFD-fed Mdm2C305F/C305F mice resulted in higher levels of p53 down-regulated targets GLUT4 and SIRT1, leading to increased biosynthesis of NAD+, and increased energy expenditure. Our study reveals a role for the RPL11-MDM2-p53 pathway in fat storage during nutrient excess and suggests that targeting this pathway may be a potential treatment for obesity.
Keywords
Ribosomal protein; MDM2; p53; high-fat diet; NAD+; energy expenditure
¶Lead Contact to whom correspondence should be addressed: [email protected].
*These authors contribute equally Author Contributions
S.L. and T.K. conducted the experiments. S.L., T.K., D.A.F. and Y.Z. designed the experiments. S.L., D.A.F. and Y.Z. wrote the manuscript and interpreted the results. Y.Z. supervised the work.
HHS Public Access
Author manuscript
Cell Rep
. Author manuscript; available in PMC 2017 August 17.Published in final edited form as:
Cell Rep. 2017 January 24; 18(4): 1005–1018. doi:10.1016/j.celrep.2016.12.086.
A
uthor Man
uscr
ipt
A
uthor Man
uscr
ipt
A
uthor Man
uscr
ipt
A
uthor Man
uscr
INTRODUCTION
The transcription factor p53 is a tumor suppressor, and previous studies underscore the importance of p53 in inhibiting cancer development (Vousden and Prives, 2009). As a mediator of cellular stress response, p53 plays a central role in sensing and responding to a variety of stresses including genotoxic damage, oncogene activation, hypoxia, and nutrient deprivation (Horn and Vousden, 2007). The eventual outcome of p53-mediated stress response depends on the cell type and context as well as the extent, duration, and origin of the stress (Purvis et al., 2012). Aside from the conventional functions of p53 including cell cycle arrest, senescence, and apoptosis, new roles for p53 in regulating cell metabolism have received increasing attention with regards to tumor suppression (Berkers et al., 2013; Li et al., 2012). For instance, p53 regulates various targets to affect insulin resistance and to reduce glucose metabolism through glycolysis, a metabolic pathway that favors tumor growth (Jiang et al., 2011; Minamino et al., 2009).
Obesity contributes to numerous systemic diseases, reduces quality of life, and shortens life expectancy (Stewart et al., 2009). Previous studies have demonstrated that moderate obesity reduces life expectancy by 2–3 years and morbid obesity a further 8–10 years (Whitlock et al., 2009). High-fat diet (HFD) treated animals from several studies have shown that p53 is induced by HFD in various tissues (Derdak et al., 2013; Minamino et al., 2009; Yokoyama et al., 2014). Surprisingly, pharmacologic inhibition of p53 in mice fed with HFD inhibits body weight gain and hepatosteatosis (Derdak et al., 2013). Similarly, genetic ablation of
endothelial p53 increased insulin sensitivity and prevented the excess fat accumulation commonly observed under HFD feeding (Yokoyama et al., 2014). These studies demonstrate that p53 activation in mice during HFD feeding regulates global metabolism and directly contributes to HFD-induced obesity. However, how p53 is activated in response to HFD treatment and correspondingly regulates fatty acid metabolism is not fully understood.
Ribosomal biosynthesis is the most energetically demanding process in cells. As such, fluctuation of energy status at organismal and cellular levels will exert a profound impact on the overall capacity for ribosomal biosynthesis (Warner, 1999). Extracellular nutrient availability is a central contributor to cellular energetics and variation in nutrient availability is a common physiological stress affecting ribosomal biosynthesis (Deisenroth and Zhang, 2011). Inhibition of ribosomal biosynthesis causes ribosomal stress and activates p53 through ribosomal protein (RP) mediated suppression of MDM2 (Zhang and Lu, 2009). Multiple RPs have been identified that interact with MDM2 to mediate a RP-MDM2-p53 signaling pathway that links ribosomal biogenesis to p53 stress response (Kim et al., 2014).
We have recently demonstrated that mice carrying a cysteine to phenylalanine substitution at residue 305 of MDM2, which specifically disrupts MDM2 binding to RPL11 (Lindstrom et al., 2007), exhibited accelerated onset of oncogenic c-MYC induced lymphomas (Macias et al., 2010; Meng et al., 2015). Moreover, the Mdm2C305F/C305F (Mdm2C305F hereafter) mice showed impaired p53 regulation of lipid metabolism in response to nutrient depletion (Liu et al., 2014). Here we studied the Mdm2C305F mice fed with a HFD ad libitum and,
surprisingly, we found that the mutant mice are resistant to HFD-induced obesity and obesity-associated illnesses.
A
uthor Man
uscr
ipt
A
uthor Man
uscr
ipt
A
uthor Man
uscr
ipt
A
uthor Man
uscr
RESULTS
Mdm2C305F mice are metabolically comparable to WT mice on a normal chow diet
When maintained under a normal chow (NC) diet ad libitum, the Mdm2C305F mice exhibited similar lifespan along with a slight decrease in body weight compared to WT mice (Figure 1A) (Macias et al., 2010). Gross metabolic comparisons between WT and Mdm2C305F mice found no significant difference in food intake (Figure S1A), body weight gain per unit of food consumed (Figure S1B), total excretion of fecal matter (Figure S1C) or fecal lipid content (Figure S1D). Furthermore, no differences in the levels of blood glucose or triglycerides were detected between the WT and Mdm2C305F mice (Figures S1E and S1F). Glucose and insulin tolerance tests (GTT and ITT) were carried out to analyze glucose homeostasis in the mice. The GTT and ITT revealed no differences between the WT and Mdm2C305F mice (Figures S1G and S1H). Histological analysis also demonstrated no obvious differences in sections of adipose tissues (Figure S1I) and livers (Figure S1J) of the WT and Mdm2C305F mice. Thus, loss of the RPL11-MDM2 interaction by the MDM2C305F mutation appears to exert no significant metabolic effect in mice maintained on a NC diet.
Mdm2C305F mice are resistant to HFD-induced obesity
To investigate the effects of HFD treatment, a cohort of six-week old WT and Mdm2C305F male mice were fed ad libitum a diet containing 60% fat. Interestingly, the Mdm2C305F mice displayed resistance to HFD-induced obesity, and their body weight gain was significantly slower than the WT mice with an approximately 20% lower average body weight than that of WT mice after 20-weeks of HFD feeding (Figures 1A and 1B). We analyzed body composition of the mice and found that HFD-fed Mdm2C305F mice had a significantly lower percentage of total body fat (Figure 1C) and a correspondingly higher proportion of lean mass (Figure 1D) than that of WT mice, suggesting that the reduced body weight of the Mdm2C305F mice is primarily because of the difference in total body fat. Further study revealed that the epididymal white fat pads were approximately 50% smaller in the Mdm2C305F mice than that of WT mice (Figures 1E and 1F). To determine if the reduction in size of the fat pad was due to fewer cell numbers or smaller adipocytes, we examined adipose tissue sections and found that the average size of adipocyte was smaller in the Mdm2C305F adipose tissues than the WT adipose tissues (Figure 1G). A comparison between the average size of adipocytes (Figure 1H) and the average fat-pad weight (Figure 1I) suggested that the reduced total fat accumulation in Mdm2C305F mice is primarily due to reduced size of the adipocytes.
We also evaluated the Mdm2C305F mice for obesity-associated ailments such as hepatosteatosis. The livers of WT mice after 20 weeks of HFD feeding were paler and markedly enlarged compared with those of Mdm2C305F mice (Figure 2A), though the liver weight relative to body weight remained unchanged (Figure 2B). Histological examination of hematoxylin and eosin (H&E) stained liver sections revealed the development of severe steatosis and clear lipid accumulation in the livers of WT but not Mdm2C305F mice (Figure 2C). Oil-red-O staining showed that large lipid droplets accumulated diffusely in the liver of WT but not Mdm2C305F mice (Figure 2D). These data indicated that the Mdm2C305F mice are resistant to HFD induced fatty liver disease. Furthermore, non-fasting blood glucose
A
uthor Man
uscr
ipt
A
uthor Man
uscr
ipt
A
uthor Man
uscr
ipt
A
uthor Man
uscr
(Figure 2E) and blood triglyceride (Figure 2F) levels were lower in HFD-treated
Mdm2C305F mice than WT mice. Obesity-associated insulin resistance, as determined by ITT, was significantly decreased in Mdm2C305F mice as compared to WT mice (Figure 2G). Correspondingly, GTT revealed that the Mdm2C305F mice exhibited improved glucose clearance compared to WT mice (Figure 2H). We also evaluated long-term effects of HFD treatment on the mice. We placed a cohort of 6-week-old WT and Mdm2C305F male mice on HFD and monitored their lifespan. As shown in Figure 2I, both mean and maximum lifespan were significantly extended in the HFD-fed Mdm2C305F mice compared to HFD-fed WT mice. Together, these data suggest that the MDM2C305F mutation, which disrupts RPL11-MDM2 interaction, is sufficient to protect mice from HFD-induced, obesity-associated ailments, including fatty liver disease, insulin resistance, and glucose intolerance.
Mdm2C305F mice demonstrate increased energy expenditure
To begin to understand the mechanisms underlining the observed phenotypes of the HFD-fed Mdm2C305F mice, we first measured the mice for several metabolic parameters. Food consumption was measured to determine whether the reduced body weight gain of the Mdm2C305F mice was due to a reduced food intake. We did not observe differences in daily food intake between the WT and Mdm2C305F mice at either the beginning (week 1) or later (week 20) stages of HFD treatment, although daily food intake decreased significantly for all mice as HFD feeding continued (Figure 3A). Equal food intake was also observed through cumulative food intake measurements using a metabolic chamber over a 72 h period (Figure S2A). Total excretion of fecal matter and lipid content in the excretion were measured to determine whether the Mdm2C305F mice had increased steatorrhoea—the presence of excess fat in the feces, a potential mechanism for decreased lipid storage during HFD feeding. No significant differences in either total feces excretion or lipid content were observed (Figures S2B and S2C). Hence, the combination of decreases in body fat gain and equal food intake and feces excretion suggests that the rate of energy expenditure in the HFD-fed Mdm2C305F mice might be altered.
We therefore measured the feed efficiency, which is a measure of the efficiency in converting feed mass into body mass, of the mice from the time that the body weight begins to diverge at 5 weeks of HFD feeding (Figure 1A). Interestingly, feed efficiency was reduced by approximately 50% in Mdm2C305F mice compared to WT mice (Figure 3B).
Correspondingly, fat gain efficiency (fat accumulation per unit of food consumed) was also reduced approximately 50% in HFD-fed Mdm2C305F mice (Figure 3C). These results indicate that the energetic balance of HFD-fed Mdm2C305F mice is shifted towards increased energy expenditure. Total energy expenditure in animals is a sum of energy utilization during external physical activity and internal heat production. To determine if Mdm2C305F mice exhibit increased physical activity, we monitored locomotor activity in mice at 4 weeks of HFD treatment, prior to the development of the obesity phenotype, and found no
differences in total moving distance during either day or night (Figures S2D-S2F). Thus, the increased energy expenditure in the HFD-fed Mdm2C305F mice is likely because of
increased internal heat production. Indeed, indirect calorimetry analysis using the comprehensive laboratory animal monitoring system (CLAMS) showed that the heat production was significantly increased in HFD-fed Mdm2C305F mice during both day and
A
uthor Man
uscr
ipt
A
uthor Man
uscr
ipt
A
uthor Man
uscr
ipt
A
uthor Man
uscr
night compared to WT mice (Figure 3D). Correspondingly, total volume of carbon dioxide production (Vol. CO2) and oxygen consumption (Vol. O2) were significantly higher in
HFD-fed Mdm2C305F mice than WT mice (Figures 3E and 3F). Since no differences were observed in food intake or spontaneous physical activity, we therefore concluded that higher energy expenditure in the form of heat production in HFD-fed Mdm2C305F mice is the primary mechanism facilitating their resistance to adiposity and body weight gain.
HFD-driven p53 induction is attenuated in Mdm2C305F mice
Since the only alteration in the Mdm2C305F mice is the MDM2C305F mutation disrupting RPL11 binding, we reasoned that the metabolic alterations in the HFD-fed Mdm2C305F mice are likely a consequence of blocked signaling that is dependent upon this interaction. Previous studies have shown that excessive calorie intake increases expression of p53 in mouse adipose tissues (Minamino et al., 2009), and that HFD treatment can cause overexpression of c-MYC in mice (Kim et al., 2013; Liu et al., 2012b). We therefore investigated the effects of HFD on c-MYC expression and p53 activation in Mdm2C305F mouse adipose tissues. When maintained under NC diet, the expression of c-MYC was low in mouse adipose tissues of both WT and Mdm2C305F mice (Figure 4A). HFD feeding increased c-MYC expression in adipose tissues, and the increase was similar for both WT and Mdm2C305F mice (Figure 4A). HFD also increased RPL11 expression, likely a result of c-MYC overexpression because c-MYC can directly up-regulate ribosomal biogenesis (van Riggelen et al., 2010), to similar levels in WT and Mdm2C305F mice (Figure 4A), indicating that the MDM2C305F mutation does not affect HFD mediated induction of c-MYC and expression of RPL11. Conversely, HFD mediated induction of p53 expression and p53 transcriptional activity were attenuated in Mdm2C305F mouse adipose tissues (Figures 4B and 4C). No previous reports demonstrate MDM2 detection by western blot in mouse adipose tissues presumably because the levels of MDM2 in the adipose are too low, and correspondingly, we were unable to detect MDM2 or MDM2-RPL11 binding from adipose tissue lysates. Nevertheless, given that the MDM2C305F mutation disrupting RPL11 binding had been shown both in vitro (Lindstrom et al., 2007) and in vivo (Macias et al., 2010), we considered it probable that the diminished p53 induction in the HFD-fed Mdm2C305F mouse adipose tissues was due to the inability of the MDM2C305F mutant to interact with RPL11 and transduce RPL11-MDM2 dependent stress signals to p53.
In order to determine whether differentiated p53 regulation between WT and Mdm2C305F mice extends to the liver, as the liver is involved in converting excess nutrients into fatty acids to be exported and stored in adipose tissue, we tested the expression of RPL11, p21, and p53 in mouse livers. However, we didn’t observe any difference between WT and Mdm2C305F mice either with or without HFD treatment (Figure S3). MYC expression could not be detected in liver tissue likely due to low levels of expression and/or poor antibody specificity. These data suggest that the RP-MDM2-p53 pathway response to nutrient excess is tissue specific. The physical changes observed in the liver of Mdm2C305F mice after HFD feeding in Figure 2 could be indirect consequences of alterations in the adipose tissue as less energy expenditure in adipocytes may cause increased glucose and lipid accumulation in the liver of HFD-fed WT mice (Figures 3D–F).
A
uthor Man
uscr
ipt
A
uthor Man
uscr
ipt
A
uthor Man
uscr
ipt
A
uthor Man
uscr
To further investigate the mechanisms behind the specific metabolic alterations observed after HFD feeding in Mdm2C305F mice, we performed real-time quantitative polymerase chain reaction (qRT-PCR) to evaluate additional p53 target genes with particular interest in genes associated with metabolism in adipose tissue (Berkers et al., 2013; Kruiswijk et al., 2015; Liang et al., 2013). Since obesity is commonly associated with increased
inflammation, we analyzed the expression of p53-regulated genes linked to inflammation and detected lower levels of proinflammatory cytokines such as Ccl2, Tnfa, Cxcl10 and Cd68 (Figure 4D) in Mdm2C305F mice. This finding is consistent with the hypothesis that the secretion of proinflammatory cytokines by adipose tissue exacerbates insulin resistance (Hotamisligil et al., 1993; Weisberg et al., 2003), which is correspondingly lower in the Mdm2C305F mice (Figure 2G). Moreover, we observed increased expression of p53 down-regulated targets associated with glucose metabolism (Glut4) and energy expenditure (Ppargc1a, Ppargc1b and Sirt1) in the adipose tissue of Mdm2C305F mice compared to HFD-fed WT mice (Figure 4E). Surprisingly, no significant changes were detected in the levels of p53 regulated Glut1 or Tigar, which are both involved in glycolysis, suggesting that Glut4 may be specifically regulated by p53 in response to HFD rather than p53 generally inhibiting glycolysis (Figure 4E). Similarly, decreased levels of Pgm2 and Igfbp3, p53 regulated genes associated with glycolysis, were observed in the Mdm2C305F mice further showing that Glut4 expression may be independent of glycolysis. Increased expression of lipid metabolism genes such as Pck1 and Lipin1 were also observed in the Mdm2C305F mice, which is surprising as both genes are positively regulated by p53 suggesting that their expression after HFD feeding may be due to other factors. Generally, the Mdm2C305F mice exhibit decreased inflammatory cytokines along with increased levels of p53 repression targets Glut4, Sirt1, Ppargc1a, and Ppargc1b associated with metabolism and energy expenditure.
HFD-induced p53 regulates energy expenditure via the GLUT4/SIRT1 network
The glucose transporter GLUT4, a p53 repression target (Schwartzenberg-Bar-Yoseph et al., 2004), plays a critical role in the maintenance of glucose homeostasis, and its deregulation has profound effects on diet-induced obesity and diabetes in humans (Shepherd and Kahn, 1999); similarly, its down-regulation in mice leads to increased risk of obesity and diabetes (Abel et al., 2001; Carvalho et al., 2005). We confirmed that in adipose tissues isolated from mice maintained on NC diet the levels of GLUT4 expression was similar between WT and Mdm2C305F mice. Interestingly, the levels of GLUT4 were on average 50% higher in HFD-fed Mdm2C305F mouse adipose tissues as compared to those of WT mouse adipose tissues (Figure 5A). qRT-PCR analysis demonstrated that Glut4 mRNA was similarly expressed in NC-fed WT and Mdm2C305F mice, but expressed at higher levels in the HFD-fed
Mdm2C305F mice than HFD-fed WT mice (Figure 5B), consistent with increased p53 activity (Figure 4) suppressing GLUT4 expression (Schwartzenberg-Bar-Yoseph et al., 2004). This is also consistent with the observation that WT and Mdm2C305F mice are phenotypically similar when maintained on NC diet (Figure S1), but different after HFD treatment (Figure 1).
Recent studies have established a link between lower levels of GLUT4 and increased nicotinamide N-methyltransferase (NNMT) in HFD-fed WT mouse adipose tissues (Kraus
A
uthor Man
uscr
ipt
A
uthor Man
uscr
ipt
A
uthor Man
uscr
ipt
A
uthor Man
uscr
et al., 2014). NNMT controls energy expenditure through modulating the levels of two essential metabolic intermediates S-adenosylmethionine (SAM) and nicotinamide (a precursor of NAD+) (Kraus et al., 2014; Shlomi and Rabinowitz, 2013; Ulanovskaya et al., 2013). Consistent with these findings, Nnmt expression was lower in adipose tissues of HFD-fed Mdm2C305F mice, where GLUT4 expression was higher, than that of HFD-fed WT mice, where GLUT4 expression was lower (Figure 5C). Lower Nnmt expression in HFD-fed Mdm2C305F mouse adipose tissues resulted in increased NAD+ (Figure 5D) and a higher NAD+/NADH ratio (Figure 5E) compared to HFD-fed WT mice.
The NAD-dependent deacetylase SIRT1 is a critical sensor and regulator of cellular energy status (Chalkiadaki and Guarente, 2012). SIRT1 expression can be suppressed by p53-mediated induction of hypermethylated in cancer 1 (HIC1) (Chen et al., 2005) and microRNA-34a (Lee et al., 2010; Raver-Shapira et al., 2007). Consistently, in HFD-fed Mdm2C305F mouse adipose tissues, where p53 activity was lower, the levels of both SIRT1 protein and mRNA were higher as compared to those of HFD-fed WT mouse adipose tissues, where the p53 activity was higher (Figures 5F and 5G). SIRT1 can regulate cellular energy metabolism by promoting transcription of nicotinamide phosphoribosyltransferase (NAMPT) (Chang and Guarente, 2013), a rate-limiting enzyme in the NAD+ salvage pathway (Yang et al., 2007). In line with the higher levels of SIRT1 in HFD-fed Mdm2C305F adipose tissues, the levels of Nampt transcript were higher compared to HFD-fed WT adipose tissues (Figure 5H). Furthermore, the transcript levels of SIRT1 targets Cd36, Cat, and Mlycd, all of which promote energy expenditure (Alcendor et al., 2007; Derdak et al., 2013; Liu et al., 2012a; Wu et al., 2011), were also higher in HFD-fed Mdm2C305F mouse adipose tissues than in WT mouse adipose tissues (Figures 5I–K). It has been shown that increased NAD+ levels can enhance the catalytic activity of SIRT1 (Revollo et al., 2004). Thus, higher levels of NAD+ and an increased NAD+/NADH ratio in the adipose tissues of HFD-fed Mdm2C305F mice could promote further SIRT1 activity. Ppargc1a and Ppargc1b are transcription factors associated with energy expenditure and increased mitochondrial biogenesis (Jornayvaz and Shulman, 2010). Consistent with higher expression levels of Ppargc1a and Ppargc1b (Figure 4E), we detected increased mitochondrial DNA content in the adipocytes of Mdm2C305F mice compared to WT mice after HFD-fed, which correlates well with the increased energy expenditure observed in the Mdm2C305F mice (Figure 5L). Together, our data indicate that HFD feeding leads to stabilization of p53 and
downregulation of GLUT4, SIRT1, Ppargc1a and Ppargc1b in WT mouse adipose tissues, resulting in decreased energy expenditure and increased energy storage. Disruption of RPL11 binding by MDM2C305F mutation attenuates p53 activation, leading to increased energy expenditure and decreased energy storage.
To further determine the role of p53 regulation of GLUT4 and SIRT1 in adipocytes, we evaluated the expression of p53 regulated metabolism genes in mouse 3T3-L1 adipocytes. After we induced the 3T3-L1 cells to differentiate into adipocytes (Figure S4A), we treated these cells with 10 μM nutlin-3, which activates p53 by inhibiting the interaction between MDM2 and p53, or 5nM actinomycin D (ActD), which activates p53 by inducing ribosomal stress (Figure S4B). Consistent with the previous observations in mouse adipose tissue and other publications (Chen et al., 2005; Sahin et al., 2011; Schwartzenberg-Bar-Yoseph et al., 2004), p53 induction in 3T3-L1 adipocytes suppressed the expression of Glut4, Glut1, Sirt1,
A
uthor Man
uscr
ipt
A
uthor Man
uscr
ipt
A
uthor Man
uscr
ipt
A
uthor Man
uscr
Ppargc1a and Ppargc1b as well as SIRT1 targets Nampt, Mlycd, Cat and Cd36 indicating that p53 regulates these genes in the adipose tissue of mice (Figure S4C).
Compared to WT mice, Mdm2C305F mice exhibit improved insulin resistance and glucose tolerance after HFD treatment. In order to determine whether liver or adipose tissue is responsible for this improved phenotype, we examined the levels of phospho-AKT (S473), which is a critical effector of the insulin signaling pathway. Interestingly, phospho-AKT levels were consistently higher in the adipose tissue of Mdm2C305F mice compared to WT mice (Figure S5). This suggests that increased insulin signaling in the adipose tissue rather than the liver mediates the observed improvement in insulin resistance and glucose tolerance because no observable change in phospho-AKT levels were observed between liver tissue of Mdm2C305F and WT mice (Figure S5).
p53+/− mice demonstrate similar HFD-induced phenotype as the Mdm2C305F mice
To further determine whether the observed phenotype of HFD-fed Mdm2C305F mice is a consequence of reduced p53 function, we fed a cohort of 6-week old p53+/− male mice with the same HFD ad libitum and recorded their body weight compared to HFD-fed WT mice. The body weight of the p53+/− and WT mice started to diverge after 7 weeks of HFD feeding and the p53+/− mice demonstrated a slower increase in body weight than the WT mice (Figure 6A), a trend that is similar to what was observed with HFD-fed Mdm2C305F mice. The non-fasting blood glucose and triglyceride levels were lower in HFD-fed p53+/− mice than in HFD-fed WT mice (Figure 6B and 6C). The epididymal white adipose tissues were smaller in HFD-fed p53+/− mice than in HFD-fed WT mice (Figure 6D). Histological analysis also demonstrated that the average size of each adipocyte was smaller in the p53+/− adipose tissues than the WT adipose tissues (Figure 6E and 6F). As expected, p53 activity (as indicated by the levels of p21 mRNA) was lower in HFD-fed p53+/− mouse adipose tissues (Figure 6G). Lower p53 activity in the p53+/− mice led to higher protein levels of GLUT4 and SIRT1 (Figure 6H–6J). Accordingly, qRT-PCR analysis revealed higher mRNA levels of Glut4, Sirt1, Ppargc1a, Ppargc1b and Cat (Figures 6K–6O) along with lower mRNA levels of Nnmt (Figure 6P) in adipocytes of p53+/− mice compared to WT. Thus, the observations from HFD-fed p53+/− mice mimic the findings from the HFD-fed Mdm2C305F mice suggesting that the resistance to obesity and metabolic disorder observed in the HFD-fed Mdm2C305F mice is p53 dependent.
DISCUSSION
Our results support a role for the RPL11-MDM2-p53 pathway as an intrinsic stress response mechanism linking c-MYC expression to ribosome biosynthesis and regulation of energy homeostasis. Studies have shown that c-MYC is induced in response to HFD treatment in various animal models (Kim et al., 2013; Liu et al., 2012b). Chronic nutrient abundance leads to obesity and a corresponding increase in amino acid concentration in the serum (Caballero et al., 1988; Newgard et al., 2009). Elevated intracellular amino acids have been shown to activate the mammalian target of rapamycin complex 1 (mTORC1), promoting global protein synthesis and increased expression of c-MYC (Gera et al., 2004; Wullschleger et al., 2006). The transcription factor c-MYC regulates multiple components of ribosomal
A
uthor Man
uscr
ipt
A
uthor Man
uscr
ipt
A
uthor Man
uscr
ipt
A
uthor Man
uscr
biosynthesis including ribosomal RNA, ribosomal protein, gene products required for the processing of ribosomal RNA, nuclear exporters of ribosomal subunits, and factors involved in the initiation of mRNA translation (van Riggelen et al., 2010). The data presented here suggest that nutritional excess enhances c-MYC expression and engages the RPL11-MDM2-p53 pathway to promote nutrient storage, which shortens the mouse lifespan through obesity-linked metabolic alterations. Mice with the MDM2C305F mutation disrupting RPL11 binding demonstrate alleviated p53 activation, reduced obesity, decreased metabolic
disorder, and extended lifespan. Our result is consistent with a recent study showing c-MYC haploinsufficient mice (c-Myc+/−) exhibit decreased body mass, higher metabolic rate, and longer lifespans compared to the WT mice (Hofmann et al., 2015). Moreover, mice with reduced p53 expression, such as p53+/− mice, respond to HFD feeding similarly as the Mdm2C305F mice, suggesting that the unique phenotype of the HFD-fed Mdm2C305F mice is because of reduced p53 activity.
Energy expenditure controlled by p53 regulation of GLUT4 and SIRT1
GLUT4 plays a major role in glucose uptake into muscle, heart, and adipocytes in response to rising insulin levels after feeding. In both humans and rodents with type 2 diabetes and obesity GLUT4 is selectively down regulated in adipose tissues (Shepherd and Kahn, 1999). Experiments with altered expression of Glut4 in mouse adipocytes have shown that GLUT4 plays an essential role in type-2 diabetes and associated metabolic alterations (Abel et al., 2001; Carvalho et al., 2005). As we have observed in the adipose tissue of HFD-fed WT, but not Mdm2C305F mice, there is an increase in p53 activity leading to decreased expression of GLUT4 and increased expression of nicotinamide N-methyltransferase (NNMT) (Figure 6). This finding corresponds with a recent study demonstrating that the levels of NNMT are reciprocally regulated with the levels of GLUT4 (Kraus et al., 2014). In mouse adipose tissues, NNMT decreases the levels of the two metabolic intermediates, NAD+ and S-adenosylmethionine (SAM), which have been shown to also affect histone methylation, polyamine flux and SIRT1 signaling (Kraus et al., 2014; Shlomi and Rabinowitz, 2013; Ulanovskaya et al., 2013).
This NAD+ dependent increase in energy expenditure is at least partially mediated through the NAD+-dependent deacetylase SIRT1, a metabolic regulator that is activated by increased NAD+ levels (Canto et al., 2009). Our results show that HFD-fed Mdm2C305F mice exhibit increased SIRT1 expression in adipose tissue corresponding to the previously discussed decrease in p53 activation and increased NAD+ levels. This is consistent with previous findings showing that transgenic mice that moderately overexpress SIRT1 or treated with SIRT1 activators are protected from developing liver steatosis or insulin resistance after HFD feeding (Banks et al., 2008; Feige et al., 2008). Moreover, multiple studies have demonstrated that increase of NAD+ biosynthesis by introducing nicotinamide
mononucleotide intermediates or the NAD+ precursor nicotinamide riboside protects mice from HFD-induced metabolic abnormalities (Canto et al., 2012; Yoshino et al., 2011). Based on these previous studies and our current data, we propose that excess nutrient availability, such as feeding with HFD, promotes c-MYC expression and RPL11 dependent p53 activation, which inhibits p53 target genes including Ppargc1a, Ppargc1b, GLUT4 and SIRT1 to reduce NAD+ levels and energy expenditure, leading to obesity. Disruption of
A
uthor Man
uscr
ipt
A
uthor Man
uscr
ipt
A
uthor Man
uscr
ipt
A
uthor Man
uscr
RPL11 binding by MDM2C305F mutation blocks HFD-induced p53 activation leading to increased energy expenditure and improved resistance to the development of obesity (Figure 7A).
The role of RPL11-MDM2-p53 pathway in energy expenditure
A previous study from our lab has demonstrated that fasted Mdm2C305F mice exhibit attenuated oxidative respiration and increased fatty acid accumulation in the liver, suggesting that the RPL11-MDM2-p53 pathway is involved in stimulating fatty acid oxidation in response to nutrient deprivation (Liu et al., 2014). Surprisingly, under conditions of nutrient abundance, the RPL11-MDM2-p53 pathway is necessary for fat accumulation in the liver and adipose tissue. Collectively, we propose that the RPL11-MDM2-p53 pathway is essential in balancing energy expenditure and storage in response to nutrient availability (Figure 7B). p53 stress response is considered to be one of the central stress response pathways in mammalian biology, with its effects being most obvious in the study of cancer; however, recent studies suggest that p53 regulates metabolism. The ability of p53 to maintain nutrient homeostasis may have developed as the earliest form of stress response as all organisms face uncertain nutrient availability. The obese phenotype of HFD-fed WT mice maintaining normal p53 function seems counterintuitive to the established pro-survival effects of p53; yet, sustained periods of nutrient abundance have only become common for humans recently, and are rarely observed in nature. Thus, the RP-MDM2-p53 pathway is activated in response to various nutrient conditions to maintain energy homeostasis and efficiency in nutrient utilization. We speculate that in the past this pathway could have facilitated fitness and survival in adverse conditions such as a harsh winter or drought in the wild, but may contribute to the development of obesity with the excess food available in modern society. The ability of p53 to regulate energetic homeostasis when presented with varied nutrient availability at both the cellular and organismal levels supports the hypothesis that p53 acts as a metabolic regulator facilitating the survival of the organism. Furthermore, our results implicate that the RPL11-MDM2-p53 pathway is involved in the development of diet-induced obesity and diabetes, which is a rapidly growing health concern for modern society.
EXPERIMENTAL PROCEDURES
Mice
Wild type and Mdm2C305F mice were bred and maintained on a 12h light and 12h dark cycle with lights on from 7:00am to 7:00pm. All mice were given standard food pellets (normal chow, NC) and water ad libitum. Cohorts of age-matched male mice were used for the study. Body weight and food intake were measured weekly. For high-fat diet (HFD) feeding experiments, mice were fed with HFD (Research Diet, D12492) beginning at the age of 6 weeks. The Institutional Animal Care and Use Committee (IACUC) at the University of North Carolina Animal Care Facility approved all studies using animals (protocol 10-045).
Mouse calorimetry
Age-matched male mice were housed individually in metabolic chambers of an Oxymax system (Columbus Instruments). The first readings were taken after a 24 h acclimation
A
uthor Man
uscr
ipt
A
uthor Man
uscr
ipt
A
uthor Man
uscr
ipt
A
uthor Man
uscr
period. Heat production, physical activity, oxygen consumption rate (VO2) and carbon
dioxide production (VCO2) rates were determined. VO2, VCO2, and heat were measured
every 26 min during a 48 h period and were normalized to the body weight. Physical activity was determined by measuring interruptions in the infrared beams (Breaks X-beam total and Breaks Y-beam total).
Mouse whole-body composition and fecal lipid excretion
EchoMRI-100 quantitative magnetic resonance whole body composition analyzer (Echo Medical Systems) was used to measure whole-body water, fat, and lean mass. Each value was normalized to body weight. To analyze fecal lipid excretion, lipid content of feces was extracted using chloroform:methanol (2:1) and air dried in a fume hood.
Glucose and Insulin tolerance tests
Glucose homeostasis was examined via intra-peritoneal glucose tolerance test (IP-GTT) and intra-peritoneal insulin tolerance test (IP-ITT). IP-GTT and IP-ITT were performed
following 15 weeks and 16 weeks, respectively, of HFD feeding. For IP-GTT, after 6 h fasting, mouse body weight was measured and a drop of blood was collected from tail vein to measure basal blood glucose level (t=0) using a glucometer (Roche, ACCU-CHEK® Aviva). Then D-glucose (2mg/g) was injected to the mice intraperitoneally followed by measurements of blood glucose level at 15, 30, 60, and 120 min. For IP-ITT, insulin (Gibco, #12585-014) was injected at the dosage of 1 U/kg in place of D-glucose. All other
procedures were same as IP-GTT. The area under the curve (AUC) was calculated by the trapezoidal method.
Triglyceride and NAD+ measurement
Serum triglyceride was measured with Stanbio Triglyceride Liquicolor® colorimetric kit (Stanbio Laboratory, 2100-430) as instructed by the manufacturer. NAD+ and NADH levels were determined with the NAD+/NADH Quantification Colorimetric Kit (Biovision) according to the manufacturer’s protocol.
Histology and Oil Red O staining
Mouse liver and white adipose tissues were fixed in 10% neutral formalin in PBS for 24 h, and stored in 70% ethanol until they were transferred to the Histology Research Core Facility at UNC. H&E staining and Oil red O staining were conducted according to the standard protocol used in the Histology Research Core Facility at University of North Carolina (UNC).
qRT-PCR analysis of mRNA expression
Total RNA was prepared from mouse tissues using Trizol® Reagent (Invitrogen, #15596-026). RNA concentration was determined with a NanoDrop spectrophotometer (Thermo Scientific, NanoDrop™ 2000c) and quality was assessed by agarose gel electrophoresis. cDNA was synthesized using Superscript III reverse transcriptase (Invitrogen, 18080-051). qRT-PCR was performed with SYBR Green probes using the
A
uthor Man
uscr
ipt
A
uthor Man
uscr
ipt
A
uthor Man
uscr
ipt
A
uthor Man
uscr
Applied Biosystems 7900HT Fast Real-Time PCR system. Results were expressed as the fold-change in transcript levels.
For mitochondrial DNA copy quantification, total DNA were isolated from adipose tissue by using Puregene Core Kit B (Qiagen) following the manufacture’s instruction. Relative amounts of nuclear DNA and mtDNA were determined by qRT-PCR. We used NADH dehydrogenase flavoprotein 1-coding gene for quantification of nuclear DNA and
mitochondrial cytochrome c oxidase 2-coding gene, mitochondrial D-loop for mitochondrial DNA quantification.
Protein analysis
For western blotting, proteins were extracted from tissues as previously described (Macias et al., 2010). Briefly, mouse tissue was homogenized and lysed in 0.5% NP-40 lysis buffer. Results detected by using either Pico or Dura enhanced chemiluminescence (ECL) systems (Thermo Scientific, SuperSignal™ West Dura Substrate). Antibodies: Rabbit polyclonal c-MYC (N262; Santa Cruz); p53 (NCL-505; Novocastra); Rabbit polyclonal SIRT1 (#2028; Cell Signaling); Rabbit polyclonal GLUT4 (H61; Santa Cruz); Rabbit polyclonal AKT (#9272; Cell Signaling); Rabbit Monoclonal Phospho-AKT (Ser473) (#3787; Cell Signaling); Rabbit polyclonal antibodies to p21 were gifts from Dr. Yue Xiong (UNC-Chapel Hill). Rabbit polyclonal antibodies to L11 were made in house and previously described (Macias et al., 2010).
Statistical analysis
Results are represented as mean ± standard error of the mean. The survival curve was evaluated for significance using the Log-rank (Mantel–Cox) test. Quantitative PCR data and immunohistochemistry quantifications were evaluated for significance using the two-tailed student’s t-tests. A p value <0.05 was considered significant for all analyses. Significant differences between experimental groups were: *P < 0.05, **P < 0.01, or ***P < 0.001.
Supplementary Material
Refer to Web version on PubMed Central for supplementary material.
Acknowledgments
We thank Yong Liu, Patrick Leslie, and Nicole Carlson for their helpful advice and technical assistance.
Funding Statement
This research was supported by grants from the National Institutes of Health (CA100302, CA127770, and CA167637) to Y.Z., a grant from the UNC Center for Environmental Health and Susceptibility (P30ES010126) to J.M., and fellowship from the UNC Pharmacology Department Training grant (GM007040-41) to D.F. This research was also supported by grants from the NSFC and Jiangsu Center for the Collaboration and Innovation of Cancer Biotherapy to Y.Z.
References
Abel ED, Peroni O, Kim JK, Kim YB, Boss O, Hadro E, Minnemann T, Shulman GI, Kahn BB. Adipose-selective targeting of the GLUT4 gene impairs insulin action in muscle and liver. Nature. 2001; 409:729–733. [PubMed: 11217863]
A
uthor Man
uscr
ipt
A
uthor Man
uscr
ipt
A
uthor Man
uscr
ipt
A
uthor Man
uscr
Alcendor RR, Gao S, Zhai P, Zablocki D, Holle E, Yu X, Tian B, Wagner T, Vatner SF, Sadoshima J. Sirt1 regulates aging and resistance to oxidative stress in the heart. Circ Res. 2007; 100:1512–1521. [PubMed: 17446436]
Banks AS, Kon N, Knight C, Matsumoto M, Gutierrez-Juarez R, Rossetti L, Gu W, Accili D. SirT1 gain of function increases energy efficiency and prevents diabetes in mice. Cell metabolism. 2008; 8:333–341. [PubMed: 18840364]
Berkers CR, Maddocks OD, Cheung EC, Mor I, Vousden KH. Metabolic regulation by p53 family members. Cell metabolism. 2013; 18:617–633. [PubMed: 23954639]
Caballero B, Finer N, Wurtman RJ. Plasma amino acids and insulin levels in obesity: response to carbohydrate intake and tryptophan supplements. Metabolism. 1988; 37:672–676. [PubMed: 3290625]
Canto C, Gerhart-Hines Z, Feige JN, Lagouge M, Noriega L, Milne JC, Elliott PJ, Puigserver P, Auwerx J. AMPK regulates energy expenditure by modulating NAD+ metabolism and SIRT1 activity. Nature. 2009; 458:1056–1060. [PubMed: 19262508]
Canto C, Houtkooper RH, Pirinen E, Youn DY, Oosterveer MH, Cen Y, Fernandez-Marcos PJ, Yamamoto H, Andreux PA, Cettour-Rose P, et al. The NAD(+) precursor nicotinamide riboside enhances oxidative metabolism and protects against high-fat diet-induced obesity. Cell metabolism. 2012; 15:838–847. [PubMed: 22682224]
Carvalho E, Kotani K, Peroni OD, Kahn BB. Adipose-specific overexpression of GLUT4 reverses insulin resistance and diabetes in mice lacking GLUT4 selectively in muscle. Am J Physiol Endocrinol Metab. 2005; 289:E551–561. [PubMed: 15928024]
Chalkiadaki A, Guarente L. Sirtuins mediate mammalian metabolic responses to nutrient availability. Nat Rev Endocrinol. 2012; 8:287–296. [PubMed: 22249520]
Chang HC, Guarente L. SIRT1 mediates central circadian control in the SCN by a mechanism that decays with aging. Cell. 2013; 153:1448–1460. [PubMed: 23791176]
Chen WY, Wang DH, Yen RC, Luo J, Gu W, Baylin SB. Tumor suppressor HIC1 directly regulates SIRT1 to modulate p53-dependent DNA-damage responses. Cell. 2005; 123:437–448. [PubMed: 16269335]
Deisenroth C, Zhang Y. The Ribosomal Protein-Mdm2-p53 Pathway and Energy Metabolism: Bridging the Gap between Feast and Famine. Genes Cancer. 2011; 2:392–403. [PubMed: 21779508]
Derdak Z, Villegas KA, Harb R, Wu AM, Sousa A, Wands JR. Inhibition of p53 attenuates steatosis and liver injury in a mouse model of non-alcoholic fatty liver disease. J Hepatol. 2013; 58:785– 791. [PubMed: 23211317]
Feige JN, Lagouge M, Canto C, Strehle A, Houten SM, Milne JC, Lambert PD, Mataki C, Elliott PJ, Auwerx J. Specific SIRT1 activation mimics low energy levels and protects against diet-induced metabolic disorders by enhancing fat oxidation. Cell metabolism. 2008; 8:347–358. [PubMed: 19046567]
Gera JF, Mellinghoff IK, Shi Y, Rettig MB, Tran C, Hsu JH, Sawyers CL, Lichtenstein AK. AKT activity determines sensitivity to mammalian target of rapamycin (mTOR) inhibitors by regulating cyclin D1 and c-myc expression. The Journal of biological chemistry. 2004; 279:2737–2746. [PubMed: 14576155]
Hofmann JW, Zhao X, De Cecco M, Peterson AL, Pagliaroli L, Manivannan J, Hubbard GB, Ikeno Y, Zhang Y, Feng B, et al. Reduced Expression of MYC Increases Longevity and Enhances Healthspan. Cell. 2015; 160:477–488. [PubMed: 25619689]
Horn HF, Vousden KH. Coping with stress: multiple ways to activate p53. Oncogene. 2007; 26:1306– 1316. [PubMed: 17322916]
Hotamisligil GS, Shargill NS, Spiegelman BM. Adipose expression of tumor necrosis factor-alpha: direct role in obesity-linked insulin resistance. Science. 1993; 259:87–91. [PubMed: 7678183] Jiang P, Du W, Wang X, Mancuso A, Gao X, Wu M, Yang X. p53 regulates biosynthesis through direct
inactivation of glucose-6-phosphate dehydrogenase. Nat Cell Biol. 2011; 13:310–316. [PubMed: 21336310]
Jornayvaz FR, Shulman GI. Regulation of mitochondrial biogenesis. Essays in biochemistry. 2010; 47:69–84. [PubMed: 20533901]
Kim TH, Leslie P, Zhang Y. Ribosomal proteins as unrevealed caretakers for cellular stress and genomic instability. Oncotarget. 2014; 5:860–871. [PubMed: 24658219]
Kim WG, Park JW, Willingham MC, Cheng SY. Diet-induced obesity increases tumor growth and promotes anaplastic change in thyroid cancer in a mouse model. Endocrinology. 2013; 154:2936– 2947. [PubMed: 23748362]
Kraus D, Yang Q, Kong D, Banks AS, Zhang L, Rodgers JT, Pirinen E, Pulinilkunnil TC, Gong F, Wang YC, et al. Nicotinamide N-methyltransferase knockdown protects against diet-induced obesity. Nature. 2014; 508:258–262. [PubMed: 24717514]
Kruiswijk F, Labuschagne CF, Vousden KH. p53 in survival, death and metabolic health: a lifeguard with a licence to kill. Nature reviews Molecular cell biology. 2015; 16:393–405. [PubMed: 26122615]
Lee J, Padhye A, Sharma A, Song G, Miao J, Mo YY, Wang L, Kemper JK. A pathway involving farnesoid X receptor and small heterodimer partner positively regulates hepatic sirtuin 1 levels via microRNA-34a inhibition. The Journal of biological chemistry. 2010; 285:12604–12611. [PubMed: 20185821]
Li T, Kon N, Jiang L, Tan M, Ludwig T, Zhao Y, Baer R, Gu W. Tumor suppression in the absence of p53-mediated cell-cycle arrest, apoptosis, and senescence. Cell. 2012; 149:1269–1283. [PubMed: 22682249]
Liang Y, Liu J, Feng Z. The regulation of cellular metabolism by tumor suppressor p53. Cell & bioscience. 2013; 3:9. [PubMed: 23388203]
Lindstrom MS, Jin A, Deisenroth C, White Wolf G, Zhang Y. Cancer-associated mutations in the MDM2 zinc finger domain disrupt ribosomal protein interaction and attenuate MDM2-induced p53 degradation. Mol Cell Biol. 2007; 27:1056–1068. [PubMed: 17116689]
Liu TF, Vachharajani VT, Yoza BK, McCall CE. NAD+-dependent sirtuin 1 and 6 proteins coordinate a switch from glucose to fatty acid oxidation during the acute inflammatory response. The Journal of biological chemistry. 2012a; 287:25758–25769. [PubMed: 22700961]
Liu Y, He Y, Jin A, Tikunov AP, Zhou L, Tollini LA, Leslie P, Kim TH, Li LO, Coleman RA, et al. Ribosomal protein-Mdm2-p53 pathway coordinates nutrient stress with lipid metabolism by regulating MCD and promoting fatty acid oxidation. Proc Natl Acad Sci U S A. 2014; 111:E2414– 2422. [PubMed: 24872453]
Liu Z, Brooks RS, Ciappio ED, Kim SJ, Crott JW, Bennett G, Greenberg AS, Mason JB. Diet-induced obesity elevates colonic TNF-alpha in mice and is accompanied by an activation of Wnt signaling: a mechanism for obesity-associated colorectal cancer. J Nutr Biochem. 2012b; 23:1207–1213. [PubMed: 22209007]
Macias E, Jin A, Deisenroth C, Bhat K, Mao H, Lindstrom MS, Zhang Y. An ARF-independent c-MYC-activated tumor suppression pathway mediated by ribosomal protein-Mdm2 Interaction. Cancer Cell. 2010; 18:231–243. [PubMed: 20832751]
Meng X, Carlson NR, Dong J, Zhang Y. Oncogenic c-Myc-induced lymphomagenesis is inhibited non-redundantly by the p19Arf-Mdm2-p53 and RP-Mdm2-p53 pathways. Oncogene. 2015
Minamino T, Orimo M, Shimizu I, Kunieda T, Yokoyama M, Ito T, Nojima A, Nabetani A, Oike Y, Matsubara H, et al. A crucial role for adipose tissue p53 in the regulation of insulin resistance. Nat Med. 2009; 15:1082–1087. [PubMed: 19718037]
Newgard CB, An J, Bain JR, Muehlbauer MJ, Stevens RD, Lien LF, Haqq AM, Shah SH, Arlotto M, Slentz CA, et al. A branched-chain amino acid-related metabolic signature that differentiates obese and lean humans and contributes to insulin resistance. Cell metabolism. 2009; 9:311–326. [PubMed: 19356713]
Purvis JE, Karhohs KW, Mock C, Batchelor E, Loewer A, Lahav G. p53 dynamics control cell fate. Science. 2012; 336:1440–1444. [PubMed: 22700930]
Raver-Shapira N, Marciano E, Meiri E, Spector Y, Rosenfeld N, Moskovits N, Bentwich Z, Oren M. Transcriptional activation of miR-34a contributes to p53-mediated apoptosis. Mol Cell. 2007; 26:731–743. [PubMed: 17540598]
Revollo JR, Grimm AA, Imai S. The NAD biosynthesis pathway mediated by nicotinamide phosphoribosyltransferase regulates Sir2 activity in mammalian cells. The Journal of biological chemistry. 2004; 279:50754–50763. [PubMed: 15381699]
Sahin E, Colla S, Liesa M, Moslehi J, Muller FL, Guo M, Cooper M, Kotton D, Fabian AJ, Walkey C, et al. Telomere dysfunction induces metabolic and mitochondrial compromise. Nature. 2011; 470:359–365. [PubMed: 21307849]
Schwartzenberg-Bar-Yoseph F, Armoni M, Karnieli E. The tumor suppressor p53 down-regulates glucose transporters GLUT1 and GLUT4 gene expression. Cancer Res. 2004; 64:2627–2633. [PubMed: 15059920]
Shepherd PR, Kahn BB. Glucose transporters and insulin action--implications for insulin resistance and diabetes mellitus. N Engl J Med. 1999; 341:248–257. [PubMed: 10413738]
Shlomi T, Rabinowitz JD. Metabolism: Cancer mistunes methylation. Nat Chem Biol. 2013; 9:293– 294. [PubMed: 23594782]
Stewart ST, Cutler DM, Rosen AB. Forecasting the effects of obesity and smoking on U.S. life expectancy. N Engl J Med. 2009; 361:2252–2260. [PubMed: 19955525]
Ulanovskaya OA, Zuhl AM, Cravatt BF. NNMT promotes epigenetic remodeling in cancer by creating a metabolic methylation sink. Nat Chem Biol. 2013; 9:300–306. [PubMed: 23455543]
van Riggelen J, Yetil A, Felsher DW. MYC as a regulator of ribosome biogenesis and protein synthesis. Nat Rev Cancer. 2010; 10:301–309. [PubMed: 20332779]
Vousden KH, Prives C. Blinded by the Light: The Growing Complexity of p53. Cell. 2009; 137:413– 431. [PubMed: 19410540]
Warner JR. The economics of ribosome biosynthesis in yeast. Trends Biochem Sci. 1999; 24:437–440. [PubMed: 10542411]
Weisberg SP, McCann D, Desai M, Rosenbaum M, Leibel RL, Ferrante AW Jr. Obesity is associated with macrophage accumulation in adipose tissue. The Journal of clinical investigation. 2003; 112:1796–1808. [PubMed: 14679176]
Whitlock G, Lewington S, Sherliker P, Clarke R, Emberson J, Halsey J, Qizilbash N, Collins R, Peto R. Body-mass index and cause-specific mortality in 900 000 adults: collaborative analyses of 57 prospective studies. Lancet. 2009; 373:1083–1096. [PubMed: 19299006]
Wu D, Qiu Y, Gao X, Yuan XB, Zhai Q. Overexpression of SIRT1 in mouse forebrain impairs lipid/ glucose metabolism and motor function. PLoS One. 2011; 6:e21759. [PubMed: 21738790] Wullschleger S, Loewith R, Hall MN. TOR signaling in growth and metabolism. Cell. 2006; 124:471–
484. [PubMed: 16469695]
Yang H, Yang T, Baur JA, Perez E, Matsui T, Carmona JJ, Lamming DW, Souza-Pinto NC, Bohr VA, Rosenzweig A, et al. Nutrient-sensitive mitochondrial NAD+ levels dictate cell survival. Cell. 2007; 130:1095–1107. [PubMed: 17889652]
Yokoyama M, Okada S, Nakagomi A, Moriya J, Shimizu I, Nojima A, Yoshida Y, Ichimiya H, Kamimura N, Kobayashi Y, et al. Inhibition of endothelial p53 improves metabolic abnormalities related to dietary obesity. Cell reports. 2014; 7:1691–1703. [PubMed: 24857662]
Yoshino J, Mills KF, Yoon MJ, Imai S. Nicotinamide mononucleotide, a key NAD(+) intermediate, treats the pathophysiology of diet- and age-induced diabetes in mice. Cell metabolism. 2011; 14:528–536. [PubMed: 21982712]
Zhang Y, Lu H. Signaling to p53: ribosomal proteins find their way. Cancer Cell. 2009; 16:369–377. [PubMed: 19878869]
A
uthor Man
uscr
ipt
A
uthor Man
uscr
ipt
A
uthor Man
uscr
ipt
A
uthor Man
uscr
Figure 1. Mdm2C305F mice are refractory to HFD-induced body fat gain
(A) Body weights of WT (n=10) and Mdm2C305F (n=12) male mice fed with normal chow (NC), and body weights of WT (n=30) and Mdm2C305F (n=23) male mice fed a high-fat diet (HFD) for 20 weeks. (B) Picture of mice after 10 weeks HFD-feeding. WT: wild type mouse; 305: Mdm2C305F mouse. (C and D) Body composition of WT and Mdm2C305F mice after 6 weeks HFD treatment detected by magnetic resonance imaging (MRI) (n=4 per group). (E and F) Weights and picture of epididymal white adipose tissue (EWAT) after 10 weeks of HFD treatment (n=5 per group). (G) Sections from epididymal adipose tissues from WT and Mdm2C305F mice stained by haematoxylin and eosin (H&E). Scale Bar 50μm. (H) Relative quantified size of adipocytes from (G). (I) Relative weight of epididymal white adipose tissue from 20 weeks HFD-fed WT and Mdm2C305F mice. Error bars, ±SEM; *P<0.05; **P<0.01; ***P<0.001.
A
uthor Man
uscr
ipt
A
uthor Man
uscr
ipt
A
uthor Man
uscr
ipt
A
uthor Man
uscr
Figure 2. Mdm2C305F mice are resistant to HFD-induced obesity associated metabolic alterations and exhibit longer lifespan
(A) Pictures were taken of livers of WT or Mdm2C305F mice after 20 weeks HFD treatment. Scale Bar 2mm. (B) Liver weight in percentages of body weight for WT or Mdm2C305F mice fed HFD for 20 weeks. (C) H&E staining of the liver sections of WT and Mdm2C305F mice on HFD. Scale bar 5μm. (D) Oil-Red-O staining for lipid droplets in livers from HFD-fed WT and Mdm2C305F mice. Scale bar 50μm. (E) Blood glucose and (F) triglycerides were measured in 10 weeks HFD-fed WT and Mdm2C305F mice. (G) Insulin tolerance test (ITT) and (H) glucose tolerance test (GTT) in WT and Mdm2C305F mice on HFD for 15 weeks (n=5 each group). AUC: area under the curve. (I) Mdm2C305F mice exhibited longer lifespans than WT mice upon long-term HFD feeding. Error bars, ±SEM; *P<0.05; **P<0.01.
A
uthor Man
uscr
ipt
A
uthor Man
uscr
ipt
A
uthor Man
uscr
ipt
A
uthor Man
uscr
Figure 3. Mdm2C305F mice demonstrate increased energy expenditure
(A) Average food intake for HFD-fed WT and Mdm2C305F mice at different ages as indicated (n=5 each group). (B and C) Feed efficiency as indicated by body-weight gain (B) and body fat gain (C) per gram high-fat food consumed in WT and Mdm2C305F mice for 5 weeks. (D–F) After 4 weeks of HFD treatment, the comprehensive laboratory animal monitoring system (CLAMS) measured heat generation (D), CO2 production (E), and O2
consumption (F); bar graphs indicate average O2 consumption, CO2 or heat production
during night and day. Error bars, ±SEM; *P<0.05; **P<0.01.
A
uthor Man
uscr
ipt
A
uthor Man
uscr
ipt
A
uthor Man
uscr
ipt
A
uthor Man
uscr
Figure 4. Mdm2C305F mice demonstrate attenuated HFD-induced p53 activation
(A) Cell lysates from epididymal adipose tissues of WT and Mdm2C305F mice were analyzed by immunoblotting for c-MYC and RPL11. NC: normal chow; HFD: 10 weeks HFD treatment. (B) Adipose tissue lysates were analyzed by immunoblotting for expression levels of p53 and p21 (left). Quantification analysis by Image J was shown to the right (3 mice each group). (C–E) qRT-PCR analysis for expression of p53 regulated targets (C) and p53 targets associated with inflammation (D), or p53 targets associated with metabolism (E) in 10 weeks HFD-fed mice adipose tissues. Error bars, ±SEM; *P<0.05; **P<0.01; *** P<0.001.
A
uthor Man
uscr
ipt
A
uthor Man
uscr
ipt
A
uthor Man
uscr
ipt
A
uthor Man
uscr
Figure 5. Mdm2C305F mice demonstrate increased energy expenditure in adipose tissues
(A) Cell lysates from epididymal adipose tissues of WT and Mdm2C305F mice (n=3 each group) were analyzed by immunoblotting for GLUT4 expression. NC: normal chow; HFD: 10 weeks HFD treatment. Quantification analysis by Image J was shown to the right. (B and C) qRT-PCR analysis of the expression of Glut4 and Nnmt in adipocytes from WT or Mdm2C305F mice treated with NC or HFD for 10 weeks. NAD+ level (D) and NAD+/NADH ratio (E) measured in adipose tissues from WT or Mdm2C305F mice treated with NC or HFD for 10 weeks. (F) Immunoblotting analysis for SIRT1 protein expression. NC: normal chow; HFD: 10 weeks HFD treatment. Quantification analysis by Image J was shown to the right. (G and H) The mRNA expression levels of Sirt1 and Nampt in adipose tissues from WT or Mdm2C305F mice treated with NC or HFD. qRT-PCR measurement of Cd36 (I), Cat (J), and Mlycd (K) in response to HFD treatment. (L) Mitochondrial DNA (mt-DNA) content in WT and Mdm2C305F mice in response to HFD treatment. D, mitochondrial DNA D-loop;
mt-A
uthor Man
uscr
ipt
A
uthor Man
uscr
ipt
A
uthor Man
uscr
ipt
A
uthor Man
uscr
Co1, mitochondrial cytochrome c oxidase 2 gene; data normalized by nuclear DNA coding NADH dehydrogenase flavoprotein 1 (Ndufv1). Error bars, ±SEM; *P<0.05; **P<0.01.
A
uthor Man
uscr
ipt
A
uthor Man
uscr
ipt
A
uthor Man
uscr
ipt
A
uthor Man
uscr
Figure 6. HFD-fed p53+/− mice display similar phenotype as the HFD-fed Mdm2C305F mice
(A) WT and p53+/− mice (n=7 per group) were fed with HFD for 12 weeks; body weights are shown. (B and C) Blood glucose and triglycerides were measured after 12 weeks of HFD treatment. (D) Weights of epididymal white adipose tissue (EWAT) after 12 weeks HFD treatment (n=5 per group). (E) Picture of epididymal EWAT from WT and p53+/− mice after 12 weeks of HFD treatment. (F) Relative quantified size of adipocytes from (E). (G) qRT-PCR measurements of p21. (H–J) Immunoblotting analysis for GLUT4 and SIRT1 protein expression for lysates from adipose tissue after 10 weeks HFD treatment (n=3 per
genotype). Quantification analysis by Image J was shown to the right. (K–P) qRT-PCR measurements of Glut4 (K), Sirt1 (L), Ppargc1a (M), Ppargc1b (N), Cat (O) and Nnmt (P) in adipose tissues from HFD-fed WT and p53+/− mice Error bars, ±SEM; *P<0.05; **P<0.01; ***P<0.001.
A
uthor Man
uscr
ipt
A
uthor Man
uscr
ipt
A
uthor Man
uscr
ipt
A
uthor Man
uscr
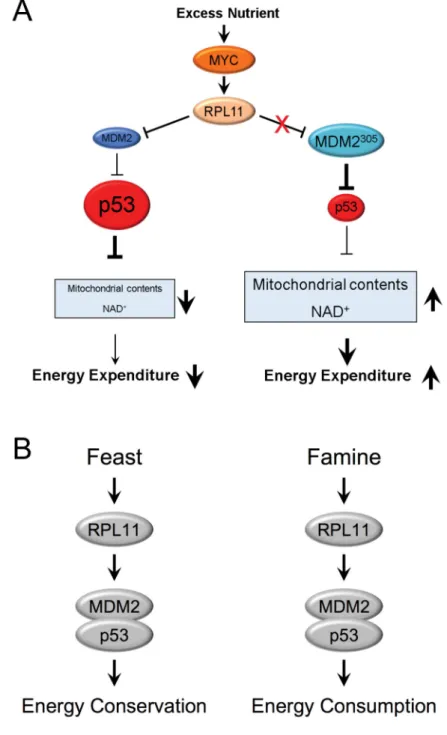
Figure 7. RPL11-MDM2-p53 pathway senses nutrient availability and regulates energy expenditure
(A) During nutrient abundance, c-MYC is activated and promotes ribosomal protein biosynthesis including RPL11, which can interact with and inhibit the E3 ligase function of WT MDM2 (Blue), to stabilize and activate p53. Activation of p53 will transcriptionally repress the expression of Glut4, Sirt1, Ppargc1a and Ppargc1b; consequently, mitochondrial biogenesis and NAD+ biosynthesis are inhibited, decreasing energy expenditure. In
Mdm2C305F mice, where RPL11 does not bind MDM2 (Teal), p53 is not induced and energy expenditure is increased during conditions of nutrient abundance. The size of the circles and the thickness of the lines and arrows indicate levels of expression and activity.
A
uthor Man
uscr
ipt
A
uthor Man
uscr
ipt
A
uthor Man
uscr
ipt
A
uthor Man
uscr
(B) A model depicting the role of the RPL11-MDM2-p53 pathway in regulation of energy expenditure under nutrient overabundance or scarcity conditions.