THE RELATIONSHIP BETWEEN PHYSICAL ACTIVITY STATUS, BODY COMPOSITION, AND EXECUTIVE FUNCTION IN OLDER ADULTS
Michael Babbitt
A thesis submitted to the faculty of The University of North Carolina at Chapel Hill in partial fulfillment of the requirements for the degree of Master of Arts in the Department of
Exercise and Sport Science (Exercise Physiology).
Chapel Hill 2008
ABSTRACT
MICHAEL BABBITT: The relationship between physical activity status, body composition and executive function in older adults
(Under the direction of Dr. Bonita Marks)
This study investigated the relationship between executive function (EF) and three fitness measurements: body mass index (BMI), body fat percentage (%BF), and physical activity levels (PA). This was a sub-study as part of the study of Role of recreational sport participation on cerebral white matter integrity in older adults (PI: B. Marks, Biomedical IRB #:05-3151; Funding: Biomedical Research Imaging Center, UNC-CH). Nineteen older adults aged 60 to 76 (10 males, 6 females) volunteered from the Raleigh/Durham/Chapel Hill area of North Carolina. The subjects’ executive function (EF) was determined with the The Behavioral Assessment of the Dysexecutive System (BADS) test battery. Body composition was assessed using skinfold measurements of the same four anatomical sites for both men and women: tricep, bicep, subscapular, and suprailiac. Physical activity levels were derived using a combined score for household, sports and leisure activities from the Modified Baecke Daily Activity questionnaire. Pearson correlations and simple regression found that the BADS was not significantly related to any of the three measurements (BMI: r2 = 0.0073, p = 0.75; %BF: r2 = 0.0626, p = 0.35; PA: r2 = 0.0454; p = 0.43). The three individual
ACKNOWLEDGEMENTS
This has been both a work of love and labor. I could not have completed this task were it not for the help of the following people for whose support I am grateful: Dr. Bonita Marks, for far, far more than cat tales and Halloween stories; Dr. Laurence Katz, for “words, words, words” (his Hamlet to my Polonius); Dr. Ed Shields, for allowing me to jump on his statistical back and travel a few thousand miles; Dr. Claudio Battaglini, for pushing me onward and rallying me to soar; to all of my classmates (Melissa, Jess, Eric, Anya, Sheila, Laura, Shoshanna, Doracy) for putting up with an old curmudgeon.
TABLE OF CONTENTS
LIST OF TABLES ...vii
LIST OF FIGURES... viii
ABBREVIATIONS...ix
Chapter 1. INTRODUCTION...10
Statement of the Problem...11
Research Questions ...12
Definition of Terms ...13
Delimitations...14
Limitations ...14
Assumptions...15
Significance of the study...15
2. LITERATURE REVIEW ...16
Body Composition and Cognitive Status...16
Physical Activity Status and Executive function ...19
Summary & Conclusion ...25
3. METHODOLOGY...27
Research Design and Statistical Analysis...38
4. RESULTS...41
5. DISCUSSION ...48
Body Composition...48
Physical Activity Levels ...50
Limitations ...51
6. SUMMARY AND CONCLUSIONS...53
Summary...53
Conclusions...54
Practical Application ...55
Future Recommendations ...56
LIST OF TABLES Table
LIST OF FIGURES Figure
1. Relationship between BMI and BADS...43
2. Relationship between %BF and BADS ...44
3. Relationship between the PA and BADS...45
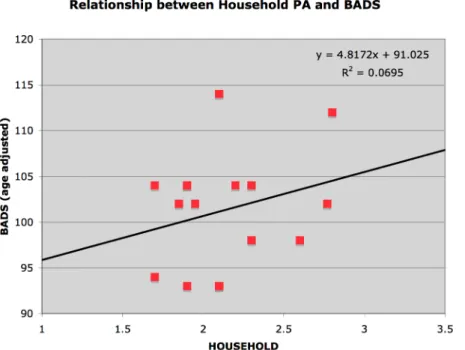
4. Relationship between household activity and BADS...46
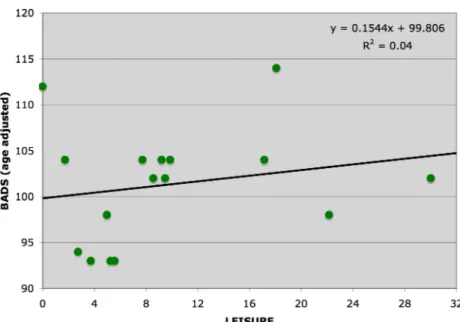
5. Relationship between leisure activity and BADS ...47
ABBREVIATIONS
%BF Percentage Body Fat 24-HF 24-Hour History
BADS The Behavioral Assessment of the Dysexecutive System BDI Beck Depression Inventory
BMI Body Mass Index EF Executive Function
MHF Medical History Questionnaire MIS Memory Impairment Screen MBDA Modified Baecke Daily Activity PA Physical Activity
SKF Skin Fold Body Composition measurement
CHAPTER ONE Introduction
The aging adult population is fast becoming the largest demographic in the United States. It has been estimated by the year 2030 nearly 1 in 5 Americans will be 65 years or older. In the year 2000, the United States and China combined for almost 28% of the aging population (65 years and older) in the world and this number is expected to rise to 33% in the next 20 years.21, 35 Furthermore, cognitive changes have been well documented to occur with the aging process3 and this change has been shown to occur at a greater rate in the elderly populations.4, 39, 42
Concurrent with aging comes a decrease in physical activity. A report issued in 2002 by the American Association of Retired Persons (AARP) identified that only about 40% of older American men and 30% of older American women participated in exercise; in addition, less than 25% of older American men and less than 15% of older American women reported enjoying exercise.40 This is concerning since epidemiological evidence suggests that less active older adults are more likely to experience a rapid decline in executive function.6 Thus, as shown by Chogahara et al. (1998), nearly 60-70% of aging Americans may be at risk for cognitive decline simply due to an insufficient amount of physical activity.13
over the age of 20.21 Obesity has also been linked to coronary heart disease, stroke, and diabetes, further supporting the importance of physical activity to reduce obesity and promote healthy aging.18, 27, 38
Obesity has been shown to influence executive function. A recent study conducted by Whitmer et al. (2005) showed a 60-70% increase in the development of rapid cognitive decline between the ages of 45-65 for those with elevated subscapular and tricep skinfold measurements (this was after adjusting for co-morbidities).58 As physical activity decreases, there is often a corresponding increase in body mass index (BMI) or body fat. Thus, it is not clear if the decline seen in executive function by Whitmer et al. (2005) and Hillman et al. (2006) was truly related to the reported increase in body fat measurements or if it was simply due to a concomitant decrease in physical activity alone.37, 58 A study by Brubacher et al (2004) suggested that to prevent any cognitive decline the elderly should strive to maintain normal recommended body weight, good nutrition and physical activity levels.10
Statement of the Problem
Research suggests that executive function may be improved through exercise and physical activity.6, 7, 10, 36, 41 However, research reports a conflicting association between weight alone and cognitive function. Therefore, it remains unclear the potential interaction between body weight, physical activity, and executive function in older adults. Hence, the purpose of this study was to examine the potential relationship between physical activity status and body composition factors (BMI, skinfold measurements) on
Research Questions
The research questions and null hypotheses are listed below:
1. Research Question 1: Is there an association between body mass index (BMI)
and overall executive function (EF)?
a. Ho1: There is no association between BMI and EF.
2. Research Question 2: Is percent body fat (%BF) associated with overall executive function (EF)?
b. Ho2: There is no association between %BF and EF.
3. Research Question 3: Is overall physical activity level (PA) associated with overall executive function (EF)?
c. Ho3: There is no association between overall PA and EF.
i. Research Sub-question 3a: Is leisure activity associated with
overall executive function (EF)?
1. Ho3a: There is no association between leisure activity and EF. ii. Research Sub-question 3b: Is sports activity associated with
overall executive function (EF)?
1. Ho3b: There is no association between sports activity and EF. iii. Research Sub-question 3c: Is household activity associated with
overall executive function (EF)?
Definition of Terms and Abbreviations
Beck Depression Inventory (BDI): A short self-assessment questionnaire used for estimating depression in differing populations including the elderly.8
The Behavioral Assessment of the Dysexecutive System (BADS): A collection of six executive control (EF) tests designed to assess the ability to plan and perform simple and complex tasks required in everyday living. Declining EF can result in a loss of independent living among community-dwelling elderly.54
Body Mass Index (BMI): A reference number of weight to height ratio calculated from the body mass of an individual (kilograms) divided by the individual’s height (meters, squared).2
Cognitive Function: A collective term used to describe a variety of brain functions, such as motor control, memory, comparison, abstraction, visual-spatial recognition and executive function.53
Executive Function (EF): The portion of cognitive function consisting of coordination, inhibition, scheduling, planning and working memory. It is part of a subgroup of cognitive function that is concerned with environmental interaction such as the organization of action, complex discrimination, error monitoring and inhibition.36 EF includes such tasks as
responding to a target cue while simultaneously inhibiting conflicting or non-essential cues presented with the target cue.41, 50
Modified Baecke Daily Activity (MBDA): A short questionnaire for the measurement of habitual physical activity.2, 5, 55
model. It is recognized that excess body fat is associated with various types of health related issues such as coronary heart disease, hypertension, and diabetes.2
Skinfold Measurement Technique: A measurement of subcutaneous fat at anatomical sites. The sum of these skinfolds is used to estimate %BF, which correlates well with the gold standard of hydrodensiometry.2
Delimitations
This study was delimited to older adults with an age range set between 60 and 80 years of age. Subjects were physically healthy with no signs of depression. None had significant cognitive impairment, nor did they have pacemakers, orthopedic, metabolic or cardiopulmonary limitations that would prevent or limit their ability to participate in a peak treadmill-based exercise stress test. The subjects were either historically active (participated in an aerobic sport regularly for at least 3 hours per week for the past 10 years) or were historically less active (participated in no more than 90 minutes of regular aerobic exercise weekly for the past 10 years).
Limitations
thereby compensating for over-prediction errors.23 Lastly, the small sample size, the relatively higher socio-economic status, and few women limit the ability to extrapolate the results of this study to the general populations.
Assumptions
1. Subjects provided accurate self-reports on the various questionnaires.
2. Research administrators collecting data performed the test protocols accurately. Significance of the study
Chapter Two Literature Review Introduction
There is growing interest into the research of cognitive function and its relationship to physical activity in aging populations. Physical activity levels often influence with body composition factors such as BMI and skinfolds and may predict risk for obesity-related diseases. A new wave of research is now looking at similar relationships between physical activity and obesity in older adults. The published reports thus far are equivocal regarding the role of weight status and its interaction with cognitive function, thereby rendering the
mechanisms and scope of impact unclear and in need of further study.10, 11, 43, 57 Body Composition and Cognitive Status
Obesity is a world wide epidemic with no age group left unscathed.21 Various body composition methods have been used to determine degree of overweight status, including (but not limited to), body mass index (BMI) and estimation of percent body fat. BMI scores over 30 have been associated with increased risk of obesity-related diseases.2 A relatively recent research interest has been the potential relationship between elevated body mass (as well as fat mass) and executive function. Emerging evidence suggests that unhealthy body composition (BMI > 25 or %BF > 25) hinders cognitive performance from youth to old age.
0.01).32 Specifically, those with BMI scores greater than 25 performed more poorly on executive function tasks than those with BMI scores ranging between 18.5-24.9. Thus, that study supported the theory that higher BMI scores were strongly related to lower executive function scores in otherwise healthy adults. These findings were supported by Cournot et al. (1975) who utilized an even larger sample size (n = 2,223; age range = 32-62 years).19
Gustafson et al. (2003) conducted a study using 93 participants from a group of 392 women who developed dementia between the ages of 70 and 88.34 Their results showed a linear relationship between advancing age and increasing BMI beginning at age 70 (p < 0.02). They also suggested for every 1.0 kg/m2 increase in BMI after age 70, Alzheimer’s Disease risk increased by 36%. This same BMI:Aging relationship was not evident in their male sample. However, a large cross sectional study by Kuo et al. (2006) involving 2,684 elderly subjects (65-94 years of age) did not support the BMI executive function findings of
determined the subject’s executive function, but with Gustafson et al. (2003) the subjects came from those clinically diagnosed with dementia.34, 44
A 27-year longitudinal study by Whitmer et al. (2005) explored the relationship between body composition and onset of dementia.58 10,276 adults were identified having participated in health evaluations from 1964-1973 and were still living and members of the same health care service (Kaiser Permanente) in 1994. Of this selected population, 719 were diagnosed with dementia between 1994 and 2003. The study incorporated not only BMI but also skinfold thickness at selected anatomical sites. The study found that those with a BMI greater than 30 had a 74% increased risk of dementia compared to those with lower BMI scores (between 25-29.9). Furthermore, skinfold thicknesses, in two upper body locations, were also investigated. Those with the greatest subscapular thickness had a 72% increased risk of dementia; those with the highest tricep skinfold thickness had a 59% increased risk of dementia. The results were similar for men and women.
In summary, research suggests that greater BMI (and perhaps greater skinfold
Physical Activity Status and Executive function Epidemiological and Cross-sectional Evidence
Just as it is common for weight to increase with aging, it is equally common to see a decline in physical activity level with aging due to a variety of reasons, such as growing medical issues, lifestyle changes and economic factors (DHHS, 2005).21 A study by Barnes et al. (2007) reported that women who engaged in more exercise at baseline versus a control group were less likely to have a resulting decline in executive function over a period of 6 to 8 years.6 That longitudinal study investigated 5,925 women, 65 years or older, with
osteoporotic fractures. Based upon their self-reported physical activity levels recorded in blocks walked per week (bw/w), those in the highest walking tier (113-672 bw/w) had a 37% reduction in risk for cognitive decline in comparison to the lowest walking tier (0-22 bw/w), even after adjusting for age and education levels. The study hypothesized that potential mechanisms for this cognitive protection were reduced vascular risk factors (such as hypertension and diabetes) that can contribute to increased risk of stroke and dementia, reduced obesity (determined by both body mass index and skinfolds) and increased brain stimulation.6
The 1991-1992 Canadian Study of Health and Aging by Laurin et al. (2001)
measured incidence of cognitive impairment and dementia using the MMSE and stratified by levels of physical activity at baseline.45 4,615 men and women over 65 years of age
Disease (CI = 0.28-0.90; p < 0.02) and dementia (CI = 0.40-0.98; p < 0.04) when compared to no exercise at all.
As with the other studies, Albert et al. (1995) found that many longitudinal
investigations into physical activity and executive function sought early markers to use as identifiers for cognitively ‘at-risk’ individuals.3 That study suggested that the three best predictors for declining executive function were education (p < 0.01), pulmonary peak expiratory flow rate (p < 0.05) and level of strenuous physical activity (p < 0.05). It is necessary to note that educational impact may be confounded by lifestyle, health, or environmental factors. Lower education came out as the top predictor of cognitive decline. Studies by Diamond et al. (1985) and Grennough et al. (1985) suggested that access to
quartiles based on the range of estimated calories expended from the number of measured blocks walked in a week (1st quartile: 0-615 kcals/wk; 2nd quartile: 616-1323 kcals/wk; 3rd quartile: 1324-2414 kcals/wk; 4th quartile: 2415-17,531 kcals/wk). The data were adjusted for age, education level, smoking status, functional limitations and estrogen use. It was found that women in the highest physical activity level were significantly (p < 0.001) less likely to develop cognitive decline compared with the least active women.
Weuve et al. (2004) also found that physical activity levels, including walking, helped maintain executive function in older women.56 A battery of tests (The Telephone Interview for Cognitive Status to test for immediate memory difficulties, the East Boston Memory Test to measure immediate and delayed paragraph recall, the Digit Span Backwards test to
measure memory and attention) was used and a global z-score (to standardize the scores from the range of tests) was obtained for general executive function. The participants were 18,766 women ranging in age from 70 to 81 years old. Self-reported energy expenditure for all activities was given in equivalent metabolic activity levels (METs) and these were totaled for a weekly average. The women were placed into five quintiles based on their MET levels as follows: 1st quintile: < 5.2; 2nd quintile: 5.2-10.0; 3rd quintile: 10.1-16.2; 4th quintile: 16.3-26.0; 5th quintile: >26.0). Women in the second through fifth quintiles of energy expenditure scored significantly (p < 0.001) better on their composite global cognitive score than those in the lowest quintile.
activities such as walking, dancing, and circuit training. Control groups received no exercise interventions. Subjects were grouped from these interventions into either a purely
cardiovascular trained group or a combined cardiovascular plus resistance trained group. The groups were coded based on the length and duration of the training programs (i.e. 15-60 minutes; 1-6+ months). The study suggested that the combined cardiovascular plus resistance exercise had the greatest positive effect (p < 0.05) on maintaining or increasing executive process.
A study by Aartsen et al. (2002) had a population size (2,076) was half of Yaffe et al. (2001) and included subjects who were 10 years younger (55-85 years old).1, 60 Everyday activities (i.e. social, experiential, and developmental) were measured against four executive functions (immediate recall, fluid intelligence, learning and information-processing speed) and a global cognitive test (MMSE) over a period of six (rather than eight) years. Regression models found that none of the activities enhanced executive function after controlling for age, gender, level of education and health. The authors suggested that no specific activity helped to maintain executive function but instead socio-economic status, which is closely connected to what activities are performed (i.e. access to a free gymnasium or access to mall walking), determines cognitive decline. However, these, conclusions are not supported elsewhere and the suggestions made by the authors do not account for a variety of socio-economic factors that can equally be obtained by lower economic status groups (i.e. street basketball, more outside activity because of the lack of modern electronic gaming availability).1
However, the type and amount of physical activity needed to maintain normal executive function with aging needs to be defined.
Intervention/Outcome Studies
With aging there are concerns of a decline in executive control processes. In studies by Kramer et al. (1999) and Colcombe et al. (2004) suggested that anatomically, control of these particular functions is housed within the prefrontal region of the brain.16, 17, 41 Two aspects of executive control in which exercise may provide a beneficial impact are response speed and accuracy involving interference; the ability to think quickly and filter out useless information is important not only for many occupations, but can also aid older adults in remaining accident-proof (e.g. averting a fall). Both of these variables are crucial for optimal everyday functioning.
Hillman et al. (2004) investigated the effect of exercise intensity on executive control processes in a study with 32 subjects assigned to one of four groups based on age and
(through the positive influence of brain activity stimulate by task demands), it remains unclear whether physical exercise can enhance executive function.36
Short-term exercise programs (less than 14 days of structured activity) appear to be just as effective in maintaining/preserving executive function as long term, chronic exercise. Small et al. (2006) looked at the effects of the 14-day “healthy longevity lifetime program” on cognition in people (aged 53 ± 10 years) with memory complaints related to advancing age.52 The study was broken into two groups: a control group (“usual” routine”) and an intervention group. The intervention group received relaxation exercises, cardiovascular exercise prescription, mental brain teasers and memory training techniques as well as a heart healthy diet. The menu guides and shopping lists for five daily meals emphasized fruits and vegetables for antioxidants, omega-3 fatty acids and low glycemic index carbohydrates (Small et al. 2006).51 Eight subjects were randomly placed in the intervention group and nine in the control group. Subjects were excluded if they met diagnostic criteria for depression, mild executive function loss or dementia as detailed by the Quality Standards Subcommitte of the American Academy of Neurology.51 Pre and post intervention measurements were taken using verbal learning and memory tests as well as the Memory Functioning
Questionnaire (MFQ). The MFQ is a 64-item test that measures frequency of forgetting, seriousness of forgetting, retrospective functioning and mnemonic use (Gilewski et al. 1986 and 1988). Higher scores indicate higher levels of memory function.28, 29 Cognitive testing suggested significantly (p < 0.015) greater word fluency in the intervention group in the Small et al (2006) study.52
Colcombe et al. (2006) evaluated 59 older healthy subjects (age 60 to 79 years) and 20 younger subjects (age 18-30 years) and tested for the effect of exercise on brain volume.14 Both genders were included in the study with 55% being female. The older subjects were randomly assigned to either an aerobic exercise program or a non-aerobic stretching and toning exercise program. The aerobic program was designed to begin at 40%-50% of HR reserve based on a VO2peak test and progress to 60%-70% over the course of six months. The toning exercise intervention involved an overall body stretching and toning program
designed for individuals of 60 years and older. As flexibility increased, more difficult stretches were incorporated. Each group attended three 1-hour sessions per week for a six-month period. Compliance was reported as exceeding 85% for all participants. Pre and post VO2peak test were performed for each group. The aerobic group showed a 16.1% increase in VO2peak while the toning group showed only a 5.3% increase. The study suggested that aerobic exercise significantly (p < 0.05) increased gray and white matter volume in the brain areas usually associated with substantial age-related deterioration (e.g. prefrontal and
temporal cortices). It also showed an average reduction in the risk of brain tissue loss (42.1% anterior cingulated cortex, 33.7% right superior temporal gyrus, 27.2% right middle frontal gyrus, 27.3% anterior white matter) relative to those in the control group and the non-aerobic exercise group. These findings suggest that physical activity may have an impact on brain volume and that further study is needed.
Summary & Conclusion
Chapter Three METHODOLOGY
This was a sub-study as part of the study of Role of recreational sport participation on cerebral white matter integrity in older adults (PI: B. Marks, Funding: Biomedical Research Imaging Center, UNC-CH). The study was approved by the UNC-Chapel Hill Committee on the Protection of the Rights of Human Subjects (Medical IRB study #015-3151). The purpose of the main study was to investigate the role of participation in aerobic fitness on cerebral white matter integrity and executive function in older adults. The purpose of this sub-study was to investigate a potential relationship between body mass index, skinfold measurements, physical activity status, and executive function in older populations. Subjects
Beck Depression Inventory (BDI) score above 10, significant cognitive impairment as measured with the prescreening cognitive assessment questionnaires and per the medical exam, orthopedic, metabolic, or cardiopulmonary limitations that would limit their ability to fully participate in a maximal treadmill-based exercise stress test, and any condition that would exclude them from having an MRI scan. MRI exclusions criteria were established by UNC Hospital and the Biomedical Research Imaging Center and included: claustrophobia, 300 lbs. weight limit and electronic/metal implants above the waist.
All subjects signed an informed consent prior to testing. All appointments were conducted within a four-week period from their initial appointment.
Instrumentation
The following instruments from the main study were used to address the research questions of this study: Telephone Prescreening, Detailed Medical History Questionnaire, BDI, Telephone Interview for Cognitive Status Screening, Memory Impairment Screen, body composition assessment, the Behavioral Assessment of the Dysexecutive System executive function test battery (BADS) and a 24-hour History Form.
Questionnaires.
Telephone Prescreening. A 15-minute telephone-administered questionnaire designed to determine if the prospective subject met study inclusion/exclusion criteria. Callers
answered questions relevant to their physical activity history and medical status to make sure they are healthy, fit one of the activity categories and were without contraindications for neuro-imaging or exercise stress testing.
and leisure time pursuits, as well as a limited amount of sociological information (gender, age, race and education).
a. Sociological information needed in order to account for executive function biases. b. Physical Activity History Information using the Modified Baecke Daily Activity
(MBDA). A questionnaire to determine a general physical activity level of an individual by looking at household activities, sporting activities and leisure time activities.5 A validity in two different studies were reported as 0.78 and 0.89.55 Beck Depression Inventory. The BDI is a short self-assessment questionnaire. It was used for estimating depression in differing populations including the elderly. A score of < 10 (using a scale of 0-63) was considered to be in the ‘normal’ range. It has a reliability and internal consistency of .85 in a number of populations. This normal score was used in the study as the end point for inclusion with regards to depression.8
24-Hour History Form. This was used to ensure subject was mentally and physically rested for the daily testing.
Performance Measurements
Memory Impairment Screen (MIS). A quickly administered 4-item test.12 It focused on delayed and cued recall and allowed sufficient time for word processing. It was free from age, education and gender bias and was highly sensitive for detecting any type of dementia (sensitivity = 0.80; specificity = 0.96).
Body Compostion Assessment.
Body composition was assessed with the following equipment:
b. Detecto Physician Balance Beam Scale with height rod (Model 438 - Webb City, MO). A balance beam scale used for height and weight measurements.
c. Lange Skinfold Caliper (Beta Technology, Cambridge, MD). This spring-loaded metal caliper was used to measure fatfolds at specific anatomical locations. This caliper provides a constant standard pressure of 10 gm./sq. mm and was
guaranteed to be accurate within ± 1 mm. To ensure this accuracy it was calibrated with a measurement block prior to testing.
In order to estimate percent body fat, skinfolds were measured at the same four anatomical sites for both men and women: tricep, bicep, subscapular, and suprailiac.23 All measures were taken on the right side of the body in a rotational fashion. Three measures at each site were taken, with the average of the two closest measures within 2 mm used for the sum of skinfold sites. Percent body fat was determining using a body fat percent table based upon gender and age.23
The Behavioral Assessment of the Dysexecutive System (BADS). A cognitive assessment test battery used to detect subtle executive dysfunction among older adults who appear to be cognitively intact. It is a series of 6 subtests involving problem solving, prioritization, and adaptation to changing situations. It has a high inter-rater reliability (> 0.88) but test-retest correlations varied depending upon the specific test within the battery (0.08 to 0.71). BADS research shows it is useful in finding subtle differences in executive function in older populations.54
Procedures
The telephone pre-screening interview was performed to determine subject eligibility and required approximately 15 minutes. If the prospective subject met the initial required criteria, he/she was booked for the first appointment. The consent form and medical history questionnaire were mailed for him/her to review and complete prior to arrival to the lab. Appointment One
The subject reported to the Exercise Science Teaching Laboratory in the Fetzer Gym Building on the University of North Carolina at Chapel Hill campus for the first appointment. The primary investigator reviewed the consent form and procedures for the study with the subject. Once it was determined the subject fully understood the purpose of the study and the nature of involvement, the consent form was signed. After written consent was obtained, the subject was screened for depression using the BDI. The subject then completed a 24-hour history form to verify he/she was mentally and physically rested enough for the remainder of the assessment.
physical examination administered by a physician to screen for contraindications for exercise testing as indicated from the medical history and the physical exam. If no contraindications were evident, the subject proceeded to the cognitive status screening.
The administrator then took body composition measurements. Cognitive Screenings
Telephone Interview for Cognitive Status (TICS): This 11-item test was administered in interview format and took approximately 10 minute to complete. A score of less than 10 indicated normal executive function.46
Memory Impairment Screen (MIS). The subject was instructed to read aloud four words from a sheet of paper. These four words represented items in different categories (animal = dog; city = Boston; vegetable = corn; musical instrument = piano). The subject then completed approximately 2 minutes of a ‘distraction task’: first counting out loud from 1 to 20 and then counting from 20 to 1 out loud. After completion of the two counting tasks, the subjects were then asked to recall, in any order, the four words they had been asked to read. If they faltered, they were given the category as a “hint”. The number of initial correct responses and guided responses were recorded. A score of 4 out of 8 suggested unimpaired semantic recall ability.12, 46 It has been shown to be accurate in identifying any form of dementia (sensitivity = 0.80; specificity = 0.96). There are no age, gender or educational biases.46
Appointment Two
Subjects reported to the Exercise Science Teaching Laboratory at the Fetzer Gym Building on the University of North Carolina at Chapel Hill campus. A trained research assistant administered the executive function assessments. A clinical neuropsychologist trained both the primary investigator and the research assistant, and the neuropsychologist reviewed all test results.
Upon arrival to the lab, the subject completed a 24-hour history form to verify he/she was mentally and physically rested enough for the remainder of the assessment. The
executive function battery contained in The Behavioral Assessment of the Dysexecutive System (BADS) test kit was performed in the same order for each subject.
The BADS cognitive test kit was used to detect subtle differences in the executive control capabilities of the subjects. The BADS test kit consisted of six smaller subtests. A profile score ranging from 0 to 4 was given to each subtest. The method used to calculate these scores was based on the extended version of The Rivermead Behavioural Memory Test (de Wall et al. 2004).20 Individual tasks and scoring are described in detail below.
profile score was obtained based on the number of errors made and adjusted to a lower score if the time to complete the test exceeded 67 seconds.59
Action Program. This task involved the subject removing a cork from a tube using provided equipment and following certain predetermined rules. The equipment was prepared in advance and included a large blue base on which all equipment rested, a long narrow beaker holding the cork, a smaller tube with a screw-on top (unscrewed at the beginning of the test) and large round container filled with water and topped with a lid that had a small hole and a metal rod. The subject was instructed to remove the cork from the tube using only the materials presented. The subject was not allowed to lift the base, the long narrow beaker, nor the large round container. The subject was also not allowed to touch the lid with his/her hands. Five components were evaluated for completion. The five components of the test were:
a. Remove the lid using the provided handle. b. Secure the cap to the lid of the small bottle. c. Fill the small bottle with water.
d. Pour one glass of water into the long tube. e. Pour a second glass of water into the long tube.
If the subject struggled for more than two minutes on any given component, the administrator completed that particular component and the subject was informed to continue. The time to complete the task was recorded in seconds but was not used for scoring. Time was only used to determine when to provide a ‘hint’ to the subject so that the subject could continue the test. A profile score was obtained based on the number of components
Key Search. For this test, the subject was given a pen and shown a piece of paper with a large square drawn at the top and a small dot near the bottom. The subject was informed that the box represented a field in which they had “lost their keys”. The subject was told he/she did not know where the keys were in the field as he/she had been all over the field. The subject’s job was to draw a continuous line from the starting dot outside of the field in through the field to demonstrate how he/she would walk through the field to search for the keys. If the subject did not understand the instructions, the administrator used a separate piece of paper to demonstrate by drawing a simple L-shaped path (not the same as the path for searching), noting to the subject that this represented walking in a straight path and turning right at the angle in the L. The main objective for the subject was to make certain to search the entire field. After the instructions were given, timing began. If the subject lifted the pen from the paper a reminder was given to make certain to keep the pen on the paper without lifting it. These instructions were repeated for each occurrence that the subject removed the pen from the paper. Time was only stopped when additional explaining was required regarding keeping the pen on the paper before starting the search. The time to complete the task was recorded in seconds. Scoring for the key search compared a variety of different predetermined patterns that were laid out in the reference manual.59 The criteria of these patterns was broken down into the following categories:
a. Entering the field: if the search was begun near a determined point a higher score was recorded.
d. Parallel lines: if all lines were in the same basic orientation a higher score was recorded.
e. Vertical/Horizontal lines: if all horizontal or vertical lines were used a higher score was recorded.
f. Ground Cover: if an attempt was clearly demonstrated to cover all ground a higher score was recorded.
g. Determining Success: If the strategy presented would have clearly recovered the keys a higher score was recorded.
A profile score was then obtained from this overall score. The profile score was lowered if the subject took longer than 95 seconds to complete the task.
Temporal Judgment. This test involved asking the subject to estimate how long four different tasks take. Exact answers were not important, merely estimations. If the subject had questions concerning each of the four examples, he/she was encouraged to make the best sensible estimation. One profile point was recorded for each correct answer.59
the subject was encouraged to complete the remainder of the test as best as possible while following the rules. Version 2 was performed exactly as the first, with the exception that the instructions printed on version 2 of the map were different. Planning time, as well as total time to complete the task, was recorded in seconds. The test was given a base line score for each subtest based on the following criteria:
a. Sequence points were recorded for visiting a location in the appropriate sequence, maximum of eight points.
b. One error point was recorded for each deviation from the path. c. One error point was recorded for failure to make a continuous line. d. One error point was recorded for each inappropriate place visited.
e. Using the provided template one error point was recorded for each path that was used more than once.
f. Error points were subtracted from the total sequence points.
Totaling the scoring for each subtest generated a profile score and one profile point was deducted if the planning time for version 2 took longer than 15 seconds and one point was deducted if the completion time for version 2 took longer than 123 seconds.59
Modified Six Elements. In this final test, the subject was given ten minutes to do three different kinds of tasks using the indicated equipment. The three tasks were Event
tasks, the subject was once again told that the task was to complete at least some of each of the six individual parts. The subject was assured there was no way to complete everything in the ten minutes and that the important objective was not to complete any one single task, but to make sure an attempt was made to complete a part from each of the six parts. The subject was given one rule to follow: he/she could not move to the second part of a task immediately after attempting the first part (i.e. from Arithmetic A to Arithmetic B) and the reverse (from B to A) was also against the rule. For example, if the subject attempted part A of the
arithmetic problem, he/she could not move onto part B of the arithmetic but must go to either part A or part B of the picture naming or the dictation task. The subject was then asked to summarize the requirements for the test. The administrator corrected any errors until the subject was clear as to the test objectives. Timing was started at the end of clarification. Time was recorded in seconds from the point a subject engaged in each part of each task and from when the subject stopped that task. Each subtask time was totaled in seconds. The profile score was obtained based on the number of tasks completed minus the number of tasks in which rules were broken. The profile score was reduced if the subject spent longer than 271 seconds on any one subtask.59
At the conclusion of the appointment, the subject received a small monetary compensation after filling out a payment disbursement form.
Research Design and Statistical Analysis
and Modified Six Elements. An overall EF score encompassing the scores of all six individual EF tasks was calculated.
Descriptive statistics (means, standard deviations) were used to summarize the personal characteristics and overall EF of the subject population (age, height, weight, BMI, %BF, BDI, TCIS, MIS, EF). The data was analyzed using JMP statistical software package (SAS Institute Inc., JMP™ 6.0.3 for Mac® OS X). Statistical significance was set a priori at p = 0.05 for all analyses. To test specific research questions and corresponding null
hypotheses, the following analyses were used:
1. Research Question 1: Is there an association between BMI and overall executive function (EF)?
a. Ho1: There is no significant association between BMI and EF.
Statistical Analyses: A simple regression was used to determine if a relationship existed between EF and BMI.
2. Research Question 2: Is percent body fat (%BF) associated with overall executive function (EF)?
a. Ho2: There is no significant association between %BF and EF.
Statistical Analyses: A simple regression was used to determine if a relationship existed between EF and %BF.
3. Research Question 3: Is physical activity status (PA) associated with overall executive function (EF)?
a. Ho3: There is no significant association between PA and EF.
a. Research Sub Question 3a: Is leisure activity associated with overall executive function (EF)?
1. Ho3a: There is no significant association between leisure activity and EF.
Statistical Analyses: A simple regression was used to determine if a relationship existed between EF and leisure activity.
b. Research Sub Question 3b: Is sports activity associated with overall
executive function (EF)?
1. Ho3b: There is no significant association between sports activity and EF.
Statistical Analyses: A simple regression was used to determine if a relationship existed between EF and sports activity.
c. Research Sub Question 3c: Is household activity associated with
overall executive function (EF)?
1. Ho3c: There is no significant association between household activity and EF.
Chapter Four RESULTS
Nineteen subjects (11 males, 8 females) were recruited for this study from an initial screening of 120 potential subjects. One female subject dropped out after completing the medical exam prior to cognitive testing and two subjects (1 male, 1 female) were excluded from these analyses due to medications taken that did not meet the original study criteria of no current medications prescribed for Alzheimer’s disease. Hence, all analyses are based on a subject sample of 16. Of this remaining sample pool, all were college graduates except one, and this one who did not have a college degree reported having had “some college”
education. The subject pool was ethnically diverse as well (1 African American, 1 Asian, 1 Native American-Caucasian, 1 “mixed”, and 12 Caucasian).
Subject Characteristics
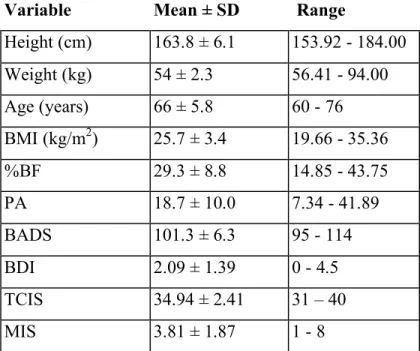
Means, standard deviations, and ranges for the subjects’ personal characteristics and major variables are listed in Table 1 below. None were clinically depressed as evidenced by their BDI scores, where a score above 15 would indicate potential depression.8 Although all were functioning well and living in the community, there were a few who were experiencing some memory deficits as evidenced by their mini-mental screenings. The Memory
Behavioral Assessment of the Dysexecutive System (BADS) scores suggested that the group did not present with any executive dysfunction as a composite score of less than 93 would be required.59 There was a relatively even distribution of “more” aerobically active (n = 9) and “less” aerobically active (n = 7) individuals recruited for the larger study but the PA scores did not reflect that recruitment strategy, with PA scores ranging from a low of 7.3 to a high of 41.9. The %BF and BMI scores suggest that the body composition of this subject
population could be classified as elevated/overweight.2
Variable Mean ± SD Range
Height (cm) 163.8 ± 6.1 153.92 - 184.00 Weight (kg) 54 ± 2.3 56.41 - 94.00
Age (years) 66 ± 5.8 60 - 76
BMI (kg/m2) 25.7 ± 3.4 19.66 - 35.36
%BF 29.3 ± 8.8 14.85 - 43.75
PA 18.7 ± 10.0 7.34 - 41.89
BADS 101.3 ± 6.3 95 - 114
BDI 2.09 ± 1.39 0 - 4.5
TCIS 34.94 ± 2.41 31 – 40
MIS 3.81 ± 1.87 1 - 8
Table 1: Subject characteristics where BMI = body mass index score; %BF = percent body fat estimation from 4 skinfold sites; BADS = Behavioral Assessment of Dysexecutive Function composite score; PA = physical activity score obtained from the Baecke Modified Physical Activity Questionnaire; BDI = Beck Depression Inventory; TCIS = Telephone Interview for Cognitive Status; MIS = Memory Impairment Screen
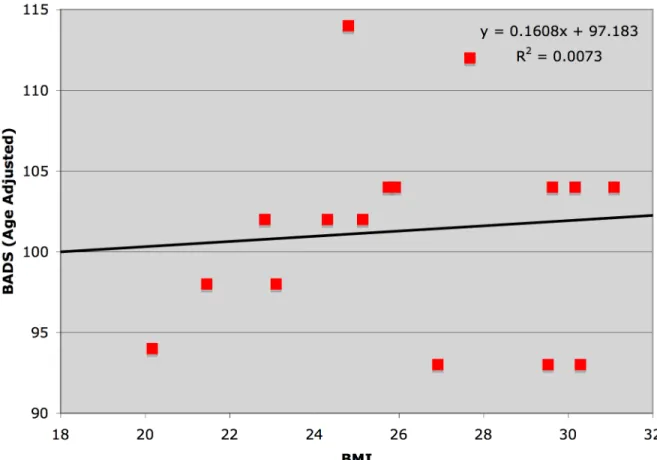
Relationship Between Body Mass Index and Executive Function
the BADS composite score (r = 0.085 and an r2 = 0.0073; p = 0.75).
Figure 1: Scatter plot depicting the relationship between BMI and BADS with line of best fit and line of best-fit equation (BMI = body mass index; BADS = Behavioral Assessment of Dysexecutive Function composite score.)
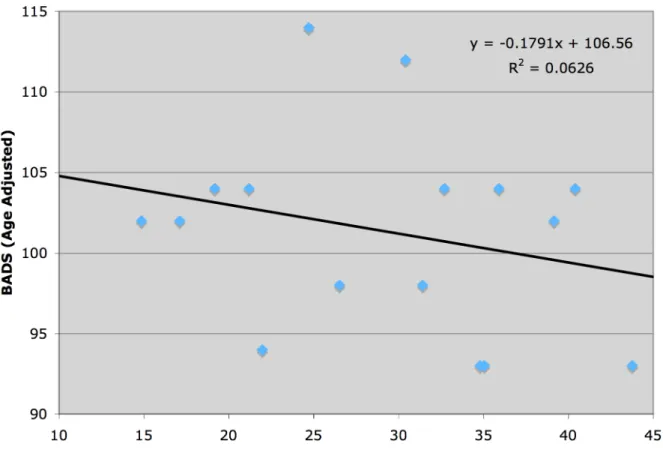
Relationship Between Percent Body Fat and Executive Function
The Null Hypothesis for Research Question 2 stated that there would be no association between percent body fat (%BF) and executive function (EF). A simple regression was used to determine the strength of association between the %BF score and the BADS composite score. This sample shows in Figure 2 a non-significant negative
Figure 2: Scatter plot depicting the relationship between %BF and BADS with line of best fit and line of best-fit equation (%BF = percent body fat; BADS = Behavioral Assessment of Dysexecutive Function composite score.)
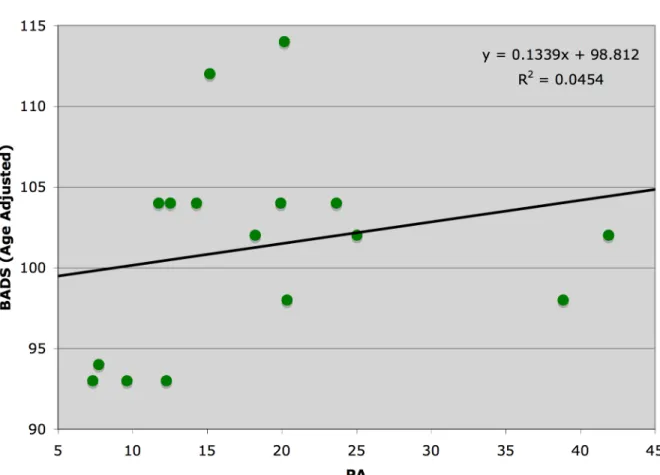
Relationship Between Physical Activity and Executive Function
The Null Hypothesis for Research Question 3 stated that there would be no association between physical activity (PA) and executive function (EF). A simple
regression was used to determine the strength of association between the PA score obtained from the overall PA score calculated from the Baecke Modified Physical Activity
Figure 3: Scatter plot depicting the relationship between the PA and BADS with line of best fit and line of best-fit equation (PA = physical activity composite score; BADS = Behavioral Assessment of Dysexecutive Function composite score.)
To determine if perhaps subtle activity differences could be distinguished, the PA overall score was broken down into its three sub-components: household activities, sporting activities, and leisure activities. The specific scores for PA sub-categories are noted in Table 2 below.
PA Variable Mean Std Dev
PA 18.6732 10.0221
Household 2.1356 0.3448
Sport 6.7804 5.1277
As with the overall PA score, this sample shows that none of the above three sub-components were significantly related to the BADS composite score representing EF. Although the PA sub-categories of household and leisure activities had weak positive
correlations (Household: r2= 0.070, p = 0.329; Leisure: r2= 0.040, p = 0.458) with the BADS composite score, neither relationship was statistically significant (see Figures 4 and 5). Figure 6 illustrates the total lack of any relationship between sport activities and BADS (r2= 0.006, p = 0.768).
Figure 5: Scatter plot depicting the relationship between leisure activity and BADS with line of best fit and line of best-fit equation (Leisure PA = leisure physical activity score; BADS = Behavioral Assessment of Dysexecutive Function composite score.)
Figure 6: Scatter plot depicting the relationship between sport activity and BADS with line of best fit and line of best-fit equation (Sport PA = sport physical activity score; BADS =
Chapter Five DISCUSSION
The present study was designed to determine the relationships between body mass index (BMI), body fat percentage (%BF) and physical activity levels (PA) to executive function (EF) in an older population. Although our study did not seek to look at the
individual components of physical activity levels (PA), three distinct categories (Household, Sport and Leisure) were used to provide more specific recommendations regarding
investigating the relationship of physical activity with EF for future studies. None of the measurements studied in this investigation showed a significant relationship with EF. Similarly, the specific of PA also demonstrated no statistically significant relationships with EF. The following discussion examines the results for each of the measurements as they relate to the EF measurement of cognitive function per the Behavioral Assessment of
Dysexecutive Function (BADS) scores, followed by a review of the limitations of our study. Body Composition
Body Mass Index and Executive Function. Our study found no significant relationship between the BMI and the BADS composite with age-adjusted scores. A
correlational study by Kuo et al (2006) that found overweight individuals (BMI between 25-30) actually scored higher on cognitive reasoning and memory composite scores (p < 0.03 and p < 0.03).44 However, that study runs contrary to the majority of literature which
decline when adjusted for age, gender and educational levels. The age range in Cournot et al.’s study (2006) was 30 years, with the age adjusted at 4 different ages (i.e., 32, 42, 52, 62 years of age.) Educational levels were also broken down into three groups (i.e., ≤9 years, 10-12 years, ≥10-12 years).19 Similarly, Gunstad, et al. (2007) also reported inverse (albeit modest) relationships (r range: 0.20 to 0.23, p range of 0.01 – 0.60) between BMI and cognitive decline for six different variables (executive function, verbal interference, switch of attention – letters/numbers, maze errors and span of visual errors). 32 The Gunstad et al. (2007) study explained that “stringent exclusion criteria” might have limited the study as a full representation of obese individuals. That study also theorized since the mechanisms for the link between obesity and BMI are still as yet unknown, it is possible that obesity may be a result of the decline of cognition that naturally occurs with age, rather than vice versa. This then might explain the prevalence of declining executive function along with obesity as one advances in age. It is also possible that the link between PA and EF has an upper limit or that older populations may require more physical activity than in this study’s subject base to gain an effect.
studies have populations numbering from hundreds of subjects to thousands. Thus, BMI is certainly a much easier measurement to obtain for large populations and the correlation of BMI with %BF as a valid measurement is well documented.24 It should also be noted that many of the studies using BMI used self-reported height and weights. Self-reported data can be problematic if there is no ability to check on the veracity of the self-reports. Our study eliminated this potential confounding factor by measuring body composition measurements during the first session. Using one competent and a trained administrator for %BF
measurements probably helped reduce potential technical errors in the measurement procedure.
Physical Activity Levels
Our study found no significant relationship between PA and EF as determined with the BADS composite age-adjusted score. All of the studies reviewed showed a significant relationship between cognitive decline and physical activity. Our study’s results were unable to confirm what is reported in the literature. A study by Weuve et al. (2004) showed a significant trend in the mean values (p < 0.001) between physical activity levels measuring expended energy and cognitive decline in women.56 Barnes et al. (2007) noted a 37%-39% decrease in risk depending on the age level and level of physically activity such that those who were more physical active in their older years showed less cognitive decline then their counterparts.6 A study by Laurin et al. (2001) found that high levels of physical activity were associate with reduced cognitive decline.45 All of these studies used self-reported
intensity and frequency to place the subjects in one of three categories (low, moderate, high). The current study did not separate the subjects into activity categories, but it did use a much more extensive questionnaire for establishing physical activity levels along with verifying responses with the subjects when items needed to be clarified. One note of interest, although it was not part of the original study design, when reviewing the three individual levels of the Modified Baecke Questionnaire (household, sports and leisure activities), a trend was evident in the relationship between household activities and BADS. This trend, however, remained non-significant. Since the number of activities that a subject could report was not limited, it is postulated that the less active individuals may have reported a greater number of household activities than the more active individuals as either a means to compensate for their
‘inactivity’ or the active individuals may have reported fewer household activities as not important enough to ‘count’ as an activity. Baecke et al. (1982) discussed this relationship and noted that education also impacts PA. He reported a significant inverse relationship with the comparison of perceived effort (p < 0.05) in leisure and sport activities for females but not for males.5
However, it is doubtful that education was a confounding factor in our study since all subjects had at least an undergraduate college degree. We were unable to examine potential gender differences due to the small sample size.
Limitations
The limitations of this current study may have decreased the ability to detect
primary study (Telephone Interview for Cognitive Status and the Memory Impairment Screen), indicated that none of the subjects had suffered minor cognitive impairment.
Chapter Six
SUMMARY AND CONCLUSIONS
Summary
The purpose of this thesis was to determine the relationship between body mass index, body fat percentage and physical activity levels to executive function in older populations.
The subjects were part of another study investigating brain structure and aerobic fitness (PI: B.L. Marks, Funding: Biomedical Research Imaging Center, UNC-Chapel Hill). Brief cognitive screenings indicated that the subjects were not depressed nor cognitively limited (BDI, TCIS, MIS).
Nineteen older adults aged 60 to 76 (10 males, 6 females) volunteered from the Raleigh/Durham/Chapel Hill area of North Carolina. Three were excluded from this study (1 male, 2 females). One female was excluded for insufficient data (the subject dropped out of the study early) the other two were excluded due to medications taken that did not meet the original study criteria of no current medications prescribed for Alzheimer’s disease. The subjects’ executive function (EF) was determined with the BADS test battery and body composition was assessed using skinfold measurements of the same four anatomical sites for both men and women: tricep, bicep, subscapular, and suprailiac. PA was estimated using the Modified Baecke Daily Activity questionnaire.
Conclusions
Based on the results of the current investigation, the following research questions and corresponding null hypotheses from Chapter One were addressed:
1. To determine whether BMI was associated with executive function in this older adult sample, the following null hypothesis was tested:
a. There would be no association between executive function and BMI.
This null hypothesis was accepted because there was not a significant correlation between BMI and EF.
2. To determine whether percent body fat was associated with executive function in this older adult sample, the following null hypothesis was tested:
b. There would be no association between executive function and percent body fat.
This null hypothesis was accepted because there was not a significant correlation between %BF and EF.
3. To determine whether physical activity status was associated with executive
function in this older adult sample, the following null hypothesis was tested: c. There would be no association between executive function and physical
activity status.
This null hypothesis was accepted because there was not a significant correlation between PA and EF.
3a. To determine whether leisure activity was associated with executive function in this older adult sample, the following null hypothesis was
a. There would be no association between executive function and leisure activity.
This null hypothesis was accepted because there were not a significant correlation between leisure activity and EF.
3b. To determine whether household activity was associated with executive
function in this older adult sample, the following null hypothesis was tested:
a. There would be no association between executive function and household activity.
This null hypothesis was accepted because there were not a significant correlation between household activity and EF.
3c. To determine whether sports activity was associated with executive
function in this older adult sample, the following null hypothesis was tested:
a. There would be no association between executive function and sports activity.
This null hypothesis was accepted because there were not a significant correlation between sports activity and EF.
Practical Application
was found in this study, much of the literature suggests that this relationship does exist. Future studies should seek to address many of the suggested limitations of this study to help further clarify this potential tool.
Future Recommendations
Based on the findings and limitations of this thesis, the following recommendations for future research are made:
1. A larger and more diverse sample size is needed to account for varying educational levels and age cohorts.
2. More detailed body composition analyses, the use of individual skin fold sites for example, may be helpful in discerning contributions of obesity to cognitive decline. 3. A comparison group of older adults with known cognitive impairment could be
REFERENCES
1. Aartsen MJ, Smits CH, van Tilburg T, Knipscheer KC, Deeg DJ: Activity in older adults: cause or consequence of cognitive functioning? A longitudinal study on everyday activities and cognitive performance in older adults. The Journals of Gerontology.Series B,
Psychological Sciences and Social Sciences 2002; 57(2): P153-62.
2. ACSM: ACSM's Guidelines for Exercise Testing and Prescription, 7th ed. Baltimore, MD, Philadelphia, PA.: American College of Sports Medicine, Lippincott Williams & Wilkins, 2007.
3. Albert MS, Jones K, Savage CR, Berkman L, Seeman T, et al.: Predictors of cognitive change in older persons: MacArthur studies of successful aging. Psychology and Aging 1995; 10(4): 578-589.
4. Arenberg D: Longitudinal changes in cognitive performance. Advances in Neurology 1990; 51: 207-209.
5. Baecke JA, Burema J, Frijters JE: A short questionnaire for the measurement of habitual physical activity in epidemiological studies. The American Journal of Clinical Nutrition 1982; 36(5): 936-942.
6. Barnes DE, Whitmer RA, Yaffe K: Physical activity and dementia: The need for prevention trials. Exercise and Sport Sciences Reviews 2007; 35(1): 24-29.
7. Barnes DE, Yaffe K, Satariano WA, Tager IB: A longitudinal study of cardiorespiratory fitness and cognitive function in healthy older adults. Journal of the American Geriatrics Society 2003; 51(4): 459-465.
8. Beck AT, Ward CH, Mendelson M, Mock J, Erbaugh J: An inventory for measuring depression. Archives of General Psychiatry 1961; 4: 561-571.
9. Brandt J, Folstein S, Folstein M: Differential cognitive impairment in Alzheimer's disease and Huntington's disease. Annals of Neurology 1988; 23(6): 555-61.
11. Bryan J, Tiggemann M: The effect of weight-loss dieting on cognitive performance and psychological well-being in overweight women. Appetite 2001; 36(2): 147-156.
12. Buschke H, Kuslansky G, Katz M, Stewart WF, Sliwinski MJ, et al.: Screening for dementia with the memory impairment screen. Neurology 1999; 52(2): 231-238.
13. Chogahara M, Cousins SOB, Wankel LM: Social influences on physical activity in older adults: a review. / Influences de l ' environnement social sur l ' activite physique chez les personnes agees: synthese. Journal of Aging & Physical Activity 1998; 6(1): 1-17.
14. Colcombe S, Erickson K, Scalf P, Kim J, Prakash R, et al.: Aerobic exercise training increases brain volume in aging humans. Journal of Gerontolgy: Medical Sciences 2006; 61A(11): 1166-1170.
15. Colcombe S, Kramer AF: Fitness effects on the cognitive function of older adults: a meta-analytic study. Psychological Science : a journal of the American Psychological Society / APS 2003; 14(2): 125-130.
16. Colcombe SJ, Kramer AF, Erickson KI, Scalf P, McAuley E, et al.: Cardiovascular fitness, cortical plasticity, and aging. Proceedings of the National Academy of Sciences of the United States of America 2004; 101(9): 3316-3321.
17. Colcombe SJ, Kramer AF, McAuley E, Erickson KI, Scalf P: Neurocognitive aging and cardiovascular fitness: recent findings and future directions. Journal of Molecular
Neuroscience 2004; 24(1): 9-14.
18. Corday E, Corday SR: Editorial: Prevention of heart disease by control of risk factors: the time has come to face the facts. The American Journal of Cardiology 1975; 35(2): 330-333.
19. Cournot M, Marquie JC, Ansiau D, Martinaud C, Fonds H, et al.: Relation between body mass index and cognitive function in healthy middle-aged men and women. Neurology 2006; 67(7): 1208-1214.
20. de Wall C, Wilson B, Baddeley A: The Extended Rivermead Behavioural Memory Test: a measure of everyday memory performance in normal adults. Memory 1994; 2(2): 149-66.
22. Diamond M, Jonson R, Protti A, Ott C, Kajisa L: Plasticity in the 904-day-old male rat cerebral cortex. Experimental Neurology 1985; 87: 309-317.
23. Durnin JV, Womersley J: Body fat assessed from total body density and its estimation from skinfold thickness: measurements on 481 men and women aged from 16 to 72 years. The British Journal of Nutrition 1974; 32(1): 77-97.
24. Fogelholm M, van Marken Lichtenbelt W: Comparison of body composition methods: a literature analysis. European Journal of Clinical Nutrition 1997; 51(8): 495-503.
25. Folstein MF, Folstein SE, McHugh PR: "Mini-mental state". A practical method for grading the cognitive state of patients for the clinician. Journal of Psychiatric Research 1975; 12(3): 189-198.
26. Fuller N, Sawyer M, Laskey M, Paxton P, Elia M: Prediction of body composition in elderly men over 75 years of age. Ann Hum Biol. 1996; 23(2): 127-47.
27. Garcia-Palmieri MR: Primary and secondary prevention of cardiovascular disease in the elderly. Boletin de la Asociacion Medica de Puerto Rico 2000; 92(1-3): 3-8.
28. Gilewski A, Zeliniski E: Questionaire assessment of memory complaints. In: Poon L, ed. Handbook for Clincal Memory Assessment of Older Adults. Washington, DC: American Psychological Association, 1986; 93-107.
29. Gilewski M, Zelinski E: Memory Functioning Questionnaire (MFQ). Psychopharmacol Bull 1988; 24(4): 665-70.
30. Greenough W, Larson J, Withers G: Effects of unilateral and bilateral training in a reaching task on dendritic branching of neurons in the rat motor-sensory forelimb cortex. Behavioral Neural Biology 1985; 44: 301-314.
31. Gunstad J, Paul RH, Cohen RA, Tate DF, Gordon E: Obesity is associated with memory deficits in young and middle-aged adults. Eating and weight disorders : EWD 2006; 11(1): e15-9.
33. Gustafson D, Lissner L, Bengtsson C, Bjorkelund C, Skoog I: A 24-year follow-up of body mass index and cerebral atrophy. Neurology 2004; 63(10): 1876-1881.
34. Gustafson D, Rothenberg E, Blennow K, Steen B, Skoog I: An 18-year follow-up of overweight and risk of Alzheimer disease. Archives of Internal Medicine 2003; 163(13): 1524-1528.
35. He W, Senqupta M, Velkoff V, Debarros K: 65+ in the United States: 2005 Current Population Reports Special Studies. In: Services. USDoHaH, Health. NIo, Aging. NIo, eds., 2005.
36. Hillman CH, Belopolsky AV, Snook EM, Kramer AF, McAuley E: Physical activity and executive control: implications for increased cognitive health during older adulthood. Research Quarterly for Exercise and Sport 2004; 75(2): 176-185.
37. Hillman CH, Motl RW, Pontifex MB, Posthuma D, Stubbe JH, et al.: Physical activity and cognitive function in a cross-section of younger and older community-dwelling
individuals. Health Psychology : Official Journal of the Division of Health Psychology 2006; 25(6): 678-687.
38. Hubert HB: The importance of obesity in the development of coronary risk factors and disease: the epidemiologic evidence. Annual Review of Public Health 1986; 7: 493-502.
39. Hultsch DF, Hertzog C, Small BJ, McDonald-Miszczak L, Dixon RA: Short-term
longitudinal change in cognitive performance in later life. Psychology and Aging 1992; 7(4): 571-584.
40. Korczyk S: Back to Which Future: The U.S. Aging Crisis Revisited. Washington, D.C: AARP, 2002.
41. Kramer AF, Hahn S, Cohen NJ, Banich MT, McAuley E, et al.: Aging, fitness and neurocognitive function. Nature 1999; 400(6743): 418-419.
43. Kretsch MJ, Green MW, Fong AK, Elliman NA, Johnson HL: Cognitive effects of a long-term weight reducing diet. International Journal of Obesity and Related Metabolic Disorders 1997; 21(1): 14-21.
44. Kuo HK, Jones RN, Milberg WP, Tennstedt S, Talbot L, et al.: Cognitive function in normal-weight, overweight, and obese older adults: an analysis of the Advanced Cognitive Training for Independent and Vital Elderly cohort. Journal of the American Geriatrics Society 2006; 54(1): 97-103.
45. Laurin D, Verreault R, Lindsay J, MacPherson K, Rockwood K: Physical activity and risk of cognitive impairment and dementia in elderly persons. Archives of Neurology 2001; 58(3): 498-504.
46. Lezak MD: Neuropsychological Assessment, 4th ed. Oxford ; New York: Oxford University Press, 2004.
47. Picton T, Champagne S, Nelson R: The effects of age on human event-related potentials. Psychophysiology 1984; 21: 312-325.
48. Pivik R, Broughton R, Copolla R, Davidson R, Fox N, Nuwer M: Guidelines for
recording and quantitative analysis of electroencephalographic activity in research contexts. Psychophysiology 1993; 30: 547-558.
49. Raz N: Aging of the brain and its impact on cognitive performance: integration of structural and functional findings. In: In CF, Salthouse T, eds. Handbook of Aging and Cognition. Hillsdale, NJ: Erlbaum, 2000; 1-90.
50. Shay KA, Roth DL: Association between aerobic fitness and visuospatial performance in healthy older adults. Psychology and Aging 1992; 7(1): 15-24.
51. Small G, Vorgan G: The Memory Prescription. New York: Hyperion, 2004.