ASSSESSING ESTUARINE-SCALE POPULATION CONNECTIVITY AND DYNAMICS FOR THE MANAGEMENT OF MARINE FISHERIES
Ian Robert Kroll
A dissertation submitted to the faculty at the University of North Carolina at Chapel Hill in partial fulfillment of the requirements for the degree of Doctor of Philosophy in the
Department of Marine Sciences.
Chapel Hill 2017
ABSTRACT
Ian Robert Kroll: Assessing Estuarine-Scale Population Connectivity and Dynamics for the Management of Marine Fisheries
(Under the direction of F. Joel Fodrie)
In response to the degradation of coastal environments and their associated habitats, managers and policy makers have looked to utilize population dynamics and, more
black sea bass to the adult stock; however, there is significant annual variation in
contribution. The role of estuarine habitats becomes even more complex for the protogynous black sea bass, as fish exhibited carry-over effects (COEs) related to nursery habitats:
To Jamie Nisse Greenberg,
ACKNOWLEDGMENTS
I would first like to acknowledge and thank my advisor and mentor, Dr. F. Joel Fodrie, for his dedication to my success. Throughout my graduate school experience, you consistently challenged me to think harder and perform better, while also providing the instructive support and guidance needed to accomplish my goals. Because of your
mentorship, I have grown as a scientist, a writer, and marine enthusiast. I am additionally grateful for the lab you have cultivated at the Institute of Marine Sciences, the intelligence and resourcefulness of each member is a reflection of our mentor.
To Drs. Kevin Craig, Jeff Buckel, Pete Peterson, and Adrian Marchetti, I have greatly appreciated the perspective each of you brought to my committee and the effort and
thoughtfulness you put into my manuscript revisions. To Dr. Brandon Puckett, thank you for being both a peer and a mentor and for keeping me sane both on drifter/settlement string recovery missions and in the dreaded LA ICP-MS basement at 2 am. To Kerry Irish, thank you for being my IMS mother—a constant source of strength and support, my sounding board, and my biggest cheerleader. I will always appreciate it.
when we were on a boat together with Bojangles in hand. An additional thank you (and hug) to the rest of the Fod Squad, both past and present: Laura Alexander, Stacy Zhang, Julie Geyer, Shelby Ziegler, Martin Benavides, Max Tice-Lewis, Quin Walker, Mariah Livernois, Rich Mahoney, Emily Woodward, Cori Lopazanski, and Carson Miller.
To my other IMS friends, Teri O’Meara, Caitlin White, Avery Paxton, Kellen Lauer, thank you for accompanying me along the way (and having just a little fun, too). To my swolemates, Caitlin Hamer and Heather Foley, you have kept both my body and my mind in shape, thank you for your companionship. To Lucy Zipf, my budding ecologist, you are brilliant, bold, and beautiful. Thank you for making North Carolina my home. To Hanna Flynn, Brianne Wempen, Kelly Lindquist, Ivey Kromka, and Ami Paul—you ladies
embraced me when I needed it most and you will forever be my sanctuary. To Holly Runde, noted philosopher and best friend extraordinaire, I am so glad we could take this crazy, confusing, and immensely rewarding grad school journey together (emotionally, not physically). To Talia Shear, Erica Shieh, Sasha Minkovsky, and Fiona Koch, thank you for constantly being sources of inspiration and encouraging me always to be better.
TABLE OF CONTENTS
LIST OF TABLES ... xi
LIST OF FIGURES ... xii
INTRODUCTION ... 1
LITERATURE CITED ... 5
CHAPTER 1: ENVIRONMENTAL EFFECTS ON ELEMENTAL SIGNATURES IN EASTERN OYSTER, CRASSOSTREA VIRGINICA, SHELLS: IMPLICATIONS FOR THE USE OF GEOCHEMICAL TAGGING TO ASSESS POPULATION CONNECTIVITY ... 7
Introduction ... 7
Methods... 10
Temperature, salinity, and trace metal manipulations ... 10
Spat settlement sampling and site prediction ... 13
Sample preparation and LA ICP-MS ... 14
Data analyses ... 16
Results ... 18
Temperature, salinity and trace metal manipulations ... 18
Settler signatures and site prediction ... 19
Discussion ... 21
Environmental influence of trace metal signatures ... 22
Application of elemental tagging to assess oyster larval population connectivity ... 24
CHAPTER 2: QUANTIFYING ESTUARINE-SCALE INVERTEBRATE LARVAL CONNECTIVITY: METHODOLOGICAL AND ECOLOGICAL
INSIGHTS ... 40
Introduction ... 40
Methods... 43
Study system and previous application of geochemical signatures ... 43
Study species ... 45
Larval outplanting ... 46
Spat settlement sampling ... 48
Sample preparation and LA ICP-MS ... 48
Data analysis ... 49
Results ... 50
Mooring and drifter deployments ... 50
Self-recruitment and connectivity ... 51
Discussion ... 54
Connectivity and ecological insights ... 55
Tracking methods ... 58
Reserve design ... 59
LITERATURE CITED ... 68
CHAPTER 3: CARRY-OVER EFFECTS FROM NURSERY HABITATS INFLUENCE REPRODUCTIVE LIFE HISTORY OF A COASTAL MARINE FISH ... 74
Introduction ... 74
Materials and methods ... 76
Study species ... 76
Study area and sample collections ... 77
Age and growth ... 80
Data analyses ... 81
Results ... 82
Juvenile habitat utilization ... 82
Growth and sexual maturity... 84
Discussion ... 85
Nursery habitat contributions ... 85
Carry-over effects from nursery habitats ... 86
Conservation considerations of COEs for exploited species ... 89
LITERATURE CITED ... 98
CHAPTER 4: INTEGRATING CARRY-OVER EFFECTS FROM JUVENILE HABITATS INTO POPULATION MATRIX MODELS REVEALS NURSERY CONTROL OF ADULT STOCK STRUCTURE ... 103
Introduction ... 103
Methods... 105
Study species ... 105
Model construction and parameterization ... 106
Perturbation analyses ... 109
Results ... 110
Discussion ... 112
Model parameterization and uncertainty ... 113
Developing habitat-based management ... 115
LITERATURE CITED ... 123
CONCLUSION ... 127
LIST OF TABLES
Table 1.1. Mean temperature (± standard error) and salinity (± standard error) measurements for spat collection sites over the collection periods in summer
2012... 34 Table 1.2. Analysis of variance (ANOVA) table summarizing the effects of
temperature (T), salinity (S), and Mn/Pb spike ([ ]) on C. virginica larvae in
laboratory experiments (Note: N=number of larval homes). ... 35 Table 2.1. Chi-squared (χ2) statistics, degrees of freedom (df), and associated
p-values (p) for connectivity matrix comparisons within and among tracking
methods, by sampling period. ... 62 Table 2.2. Shannon-Wiener diversity indices (H’), evenness (J’), and richness
as measures of larval connectivity within and among regions in Pamlico Sound for each tracking method, and by sampling period. H’ values of 0 represent a single larval source whereas a value of 1 would represent several larval sources. J’ values of 0 indicate one source contributed all the recently settled spat whereas a value of 1 would indicate several larval sources
contributed the same amount of recently settled spat. ... 63 Table 3.1. Number of juveniles collected and classification success, using
discriminant function analysis, for C. striata from estuarine and offshore
nurseries during 2010, 2013, 2014 and 2009+2011+2012 combined. ... 96 Table 3.2. Number of females, males, and overall percent males for each age
class by predicted juvenile habitat. ... 97 Table 4.1. Name, size classification, source and associated vital rates for each
mode stage. f: fecundity; zhigh: upper bound mortality; zlow: lower bound
mortality; and d: stage duration ... 121 Table 4.2. λ; F: number of females (x103); and M: number of males resulting
from a single model, ran over 30yrs, with varying estuarine and offshore
LIST OF FIGURES
Figure 1.1. Map of spat settlement collection sites within Pamlico Sound, NC
(triangles) and Bogue-Back-Core Sound (circles) study system. ... 28 Figure 1.2. Average X:Ca elemental ratios, determined by LA ICP-MS, for
larvae exposed to high and low temperature and salinity and ambient [0] , mid
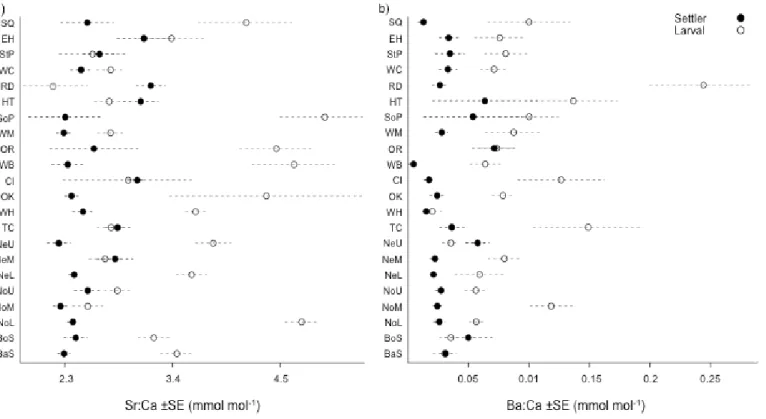
[+], and elevated [++] concentrations of: a) Sr, b) Ba, c) Mn, and d) Pb. ... 29 Figure 1.3. Elemental ratios (±SE), X:Ca, of settler and larval components of
collected spat shell, by site, for a) Sr and b) Ba. Sites are arranged moving east to west within the northern and southern Pamlico Sound and grouped by
geomorphological features in the Bogue-Back-Core Sound ... 30 Figure 1.4. Contour plots showing the distribution of elemental ratios for a)
Mn, b) Sr, c) Ba, and d) Pb over observed temperature and salinity gradients for all collected individuals throughout the Bogue-Back-Core-Pamlico Sound
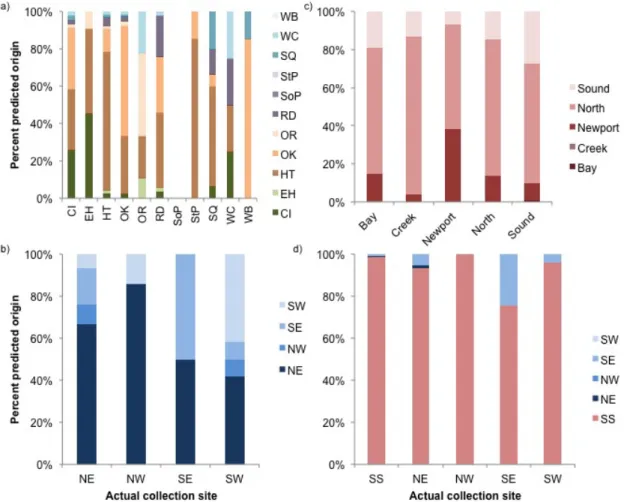
system. ... 31 Figure 1.5. Classification success determined by linear discriminant function
analysis for a) individual sites within Pamlico Sound, b) regions within Pamlico Sound, c) geographic regions among southern sites (SS), d) and all groupings of sites where spat were collected. The colors represent the predicted collection sites and cumulative percentage correctly identified is
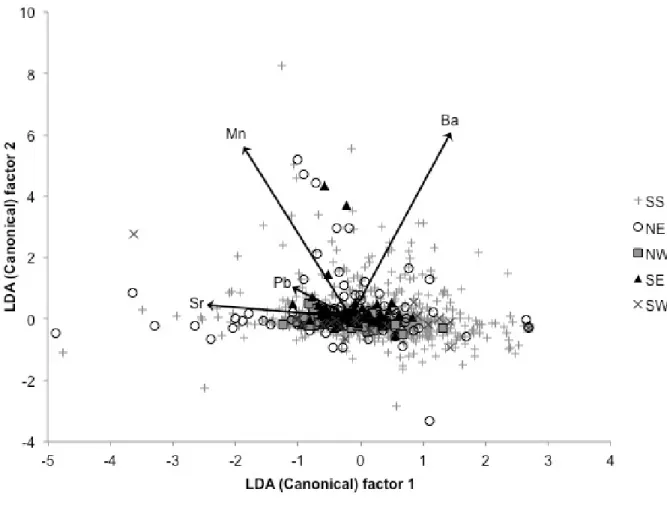
displayed on the y axis. ... 32 Figure 1.6. Canonical score plots of the linear discriminant function analysis
for C. virginica settler shells grouped into Pamlico Sound quadrants and
adjacent southern sites (SS). ... 33 Figure 2.1. Map of a) all spat settlement collection sites within Pamlico
Sound, NC and drifter deployment sites (D), termination sites (T), and average wind speed and direction for drifters deployed during b) June 2013, c) June 2014, and d) August 2014. Question marks (?) indicate last known location of lost drifters. Wedge size in wind roses corresponds to measured frequency of wind speed/direction. Arrows on wind rose diagrams correspond to length and
direction of drifter path. ... 64 Figure 2.2. Linear discriminant function analysis results for classification of
geochemical ratios for oyster larvae housed on surface drifters (black) and moorings (grey), by region (shapes), for a) June 2013, b) June 2014, and c)
August 2014. ... 65 Figure 2.3. Distribution of manganese (Mn) in shells of larvae outplanted to a)
on a) June 2013 drifters, b) June 2014 drifters, c) August 2014 drifters, d) June 2013 moorings, e) June 2014 moorings, and f) August 2014 moorings. Brighter (lighter) colors indicate higher levels of connectivity between/within
regions. ... 67 Figure 3.1. Map of southeastern United States displaying collection sites for
black sea bass during the July 2014 leg of the South Eastern Fisheries
Independent Sampling efforts about the NOAA ship Pisces. ... 91 Figure 3.2. Canonical score plot of a) the linear discriminant function analysis
for C. striata juveniles grouped by nursery habitat, displayed vertically by year
and b) influence of key elements on canonical score. ... 92 Figure 3.3. Determined contribution of estuarine and offshore nurseries to the
adult population of C. striata, by year-class. ... 93 Figure 3.4. (a) Mean growth rates (±SE) of juvenile through adult and (b)
mean sizes (SL; ±SE) of adult C. striata that utilized estuarine or offshore
nursery habitats. ... 94 Figure 3.5. Logistic growth projection (±SE) representing predicted percent
male for each nursery type fit to observed percent male at age for C. striata,
by year. ... 95 Figure 4.1. Life-cycle diagram used to construct stage-based population
matrix models for two black sea bass subpopulations separated by juvenile habitat alternative: estuarine (est) and offshore (off). L: larvae; J: juvenile; F: female; M: Male. Pi is the probability of surviving to remain in the same stage
duration and Gi is the probability of surviving and advancing to the next stage
during 1 time step. FF is female fertility (contribution of offspring to the L
stage). ... 118 Figure 4.2. Sensitivity (A, D), elasticity (B, E), and contribution (C, F) of each
matrix element to changes in λ for fish associated with estuarine(A-C) and offshore (D-F) nursery habitats. Bar colors correspond to models with 0, 15,
and 30% reductions in female stage fecundity (FF) ... 119
Figure 4.3. Population growth (λ) resulting from 0, 15, and 30% reductions in female stage fecundity (FF), using two potential female stage mortalities (zF),
INTRODUCTION
Global declines in coastal habitats, such as saltmarshes, seagrass beds, mangrove forests and shellfish reefs, have decreased the availability of nursery, foraging, and refuge habitats used by several marine fish and invertebrate (Aarts and Van Den 2003). In response to this, managers and policy makers have looked to utilize population dynamics and, more specifically, connectivity (i.e., import and export of larvae, juveniles, and adults) among subpoputions in order to rebuild stocks. However, most estimates of connectivity are based on theoretical models which are informed by a relatively small number of empirical studies (Cowen and Sponaugle 2009). Therefore, to create effective management plans that protect the distribution and abundance of ecologically and economically valuable species, further research is needed to not only identify dispersal pathways, but also quantify the contribution of specific subpopulations and habitats.
As the majority of population bottlenecks are thought to result from critical periods experienced in earlier life stages (Limburg 2001), it is particularly important for managers to discern movement patterns during larval and juvenile stages. Recent studies have
demonstrated higher levels of self-recruitment and longer dispersal pathways than previously assumed (Almany et al. 2007; Puckett and Eggleston 2016); however, larval dispersal is highly dependent on physical factors (e.g., current patterns and tidal forcing), which fluctuate annually, seasonally, and even daily, causing dispersal distances to be highly variable among years or even among neighboring habitats within the same temporal scales (O’Connor et al. 2007, Puckett et al. 2014, Qian et al. 2014). Juvenile connectivity, both between nursery habitats and from nursery to adult habitats, is also of particular interest, as resource availability can vary extensively among putative nursery habitats, exposing organisms to varied environmental conditions during an already vulnerable life stage (Anders et al. 1998). It is also necessary to attribute the role and contribution of juvenile habitats to the adult population in order to preserve essential nursery habitats and adult stock dynamics.
Estuaries comprise a unique domain for connectivity studies, as they are characterized by high environmental spatiotemporal variation (e.g., multiple freshwater input sources) and encompass nursery and adult habitats for several commercially and ecologically important fisheries. The Eastern oyster provides an important model organism for the study of estuarine-scale larval connectivity because of their ecological role as a reef-building, foundation species, commercial fishery status, and metapopulation dynamics. Biophysical models have simulated the dispersal of oyster larvae (over their 2-3 week planktonic veliger phase) and found dispersal distances ranging from 5-40 km, which may limit both
there are no empirical data on Eastern oyster larval connectivity and demographic rates across whole-estuarine scales, severely limiting our ability to managing historically overfished stocks.
Although estuarine habitats, such as oyster reefs, were once thought to provide the only nursery ground to the majority of estuarine-associated organisms, recent syntheses have found that estuarine nursery utilization can be facultative, rather than obligate (Able et al. 2005; Nagelkerken et al. 2015). As a result, there is the impetus to understand how organisms like the black sea bass, a socially, economically, and ecologically important member of the snapper-grouper complex, utilize estuarine nurseries and quantify the contribution of
estuarine habitats to the adult. Additionally, usage of specific nursery habitats may confer life history benefits beyond the juvenile stage via carry-over effects (Norris 2005). As estuarine habitats are especially vulnerable to climate change and anthropogenic exploitation
(Grabowksi et al. 2012), it is important to discern whether the utilization of offshore habitats will increase as estuarine habitat availability decrease and how this may impact population fitness, biomass, and structure (van de Wolfshaar et al. 2015).
The use of the Eastern oyster and black sea bass as model organisms provides an ideal platform by which to examine connectivity at two critically important life stages within ecologically-prized estuarine systems. Examining oyster larval connectivity among estuarine subpopulations not only demystifies the metapopulation dynamics of invertebrate
LITERATURE CITED
Able, K. W., Fahay, M. P., and Shepherd, G. R. (1995). Early life history of black sea bass, Centropristis striata, in the mid-Atlantic Bight and a New Jersey estuary. Fishery Bulletin, 93(3), 429-445.
Almany, G. R., Berumen, M. L., Thorrold, S. R., Planes, S., and Jones, G. P. (2007). Local replenishment of coral reef fish populations in a marine reserve. Science (New York, N.Y.), 316(5825), 742–4.
Anders, A, Faaborg, J., and Thompson, F. (1998). Postfledging dispersal, habitat use, and home-range size of juvenile Wood Thrushes. The Auk, 115(2), 349–358.
Cowen RK, Sponaugle S (2009) Larval Dispersal and Marine Population Connectivity. Annu Rev Mar Sci 1:443–466
Grabowski, J. H., Brumbaugh, R. D., Conrad, R. F., Keeler, A. G., Opaluch, J., Peterson, C. H., … Smyth, A. R. (2012). Economic Valuation of Ecosystem Services Provided by Oyster Reefs. BioScience, 62(10), 900–909.
Limburg, K. E. (2001). Through the gauntlet again: demographic restructuring of American shad by migration. Ecology, 82(6), 1584-1596.
Nagelkerken, I., Sheaves, M., Baker, R., and Connolly, R. M. (2015). The seascape nursery: a novel spatial approach to identify and manage nurseries for coastal marine
fauna.Fish and Fisheries,16(2), 362-371.
Norris, D.R. (2005). Carry-over effects and habitat quality in migratory populations. Oikos, 109(1), 178-186.
O’Connor, M. I., Bruno, J. F., Gaines, S. D., Halpern, B. S., Lester, S. E., Kinlan, B. P., and Weiss, J. M. (2007). Temperature control of larval dispersal and the implications for marine ecology, evolution, and conservation. Proceedings of the National Academy of Sciences of the United States of America, 104(4), 1266–71.
Puckett, B. J., Eggleston, D. B., Kerr, P. C., and Luettich, R. A. (2014). Larval dispersal and population connectivity among a network of marine reserves. Fisheries
Oceanography, 23(4), 342–361.
Puckett, B. J., and Eggleston, D. B. (2016). Metapopulation dynamics guide marine reserve design: importance of connectivity, demographics, and stock
Qian, H., Li, Y., He, R., and Eggleston, D. B. (2015). Connectivity in the Intra-American Seas and implications for potential larval transport. Coral Reefs,34(2), 403-417. Van de Wolfshaar, K., Tulp, I., Wennhage, H., & G, S. J. (2015). Modelling population
CHAPTER 1: ENVIRONMENTAL EFFECTS ON ELEMENTAL SIGNATURES IN EASTERN OYSTER, CRASSOSTREA VIRGINICA, SHELLS: IMPLICATIONS FOR
THE USE OF GEOCHEMICAL TAGGING TO ASSESS POPULATION CONNECTIVITY
Introduction
Researchers have long been interested in the complex larval dispersal patterns that govern early life history and distribution patterns of marine organisms (Young 1990). Current management strategies have only bolstered the impetus to discern population
Estuaries comprise an important domain for connectivity studies, as they are
characterized by high environmental spatiotemporal variation (e.g., multiple freshwater input sources) and encompass varying geomorphological components (e.g., creeks, salt water inlets, and marshland). Estuaries also function as important nursery, juvenile, and even adult habitat for many marine organisms (Beck et al. 2001), resulting in the development of distinct subpopulations with varying amounts of larval exchange and connectivity. Finfish connectivity has been examined over many spatial scales, including intra- and inter-estuarine dynamics on both the east and west coasts of the United States (e.g., Able 2005, Fodrie & Levin 2008). However, invertebrate dispersal across estuarine scales has not been as intensively examined, with only a few studies exploring connectivity across estuarine environmental gradients (Becker et al. 2007, Cathey et al. 2012; Puckett et al. 2014 and references therein).
retention (Puckett et al. 2014). However, there are no empirical data on oyster larval connectivity and demographic rates within this reserve system. The present study, which evaluates the efficacy of geochemical signatures in shells of larval stage oysters and recent settlers in the waters of Pamlico Sound and beyond, is a key step in testing model predictions of larval connectivity for this and similar bivalve metapopulation.
Because of C. virginica’s calcium carbonate shells, geochemical tagging methods can be used to empirically assess larval dispersal and connectivity (Carson 2010, Fodrie et al. 2011). Geochemical tags are based on unique physical and chemical environments experienced by organisms during their larval and post-larval life-history stages. As the organism grows, elements present in natal environments are accreted and stored in calcium carbonate structures (e.g., otoliths in fishes, shells in bivalves), usually through the
The ultimate goal of this study was to develop geochemical tagging as an empirical tool to assess oyster larval connectivity. A requisite for achieving this goal was to first ground-truth tagging methods for oysters via spatially-implicit laboratory experiments with larval oysters, coupled with spatially-explicit field collections of recent settlers. In laboratory mesocosms, we conducted a fully crossed, 3-way, experiment to investigate the effects of temperature, salinity, and seawater concentrations of Mn and Pb on larval (prodissoconch) shell signatures (i.e., elemental ratio, X:Ca). Second, we collected recently settled oysters (hereafter “spat”) from sites within the Bogue-Back-Core-Pamlico Sound estuarine system in North Carolina (NC), USA, and examined signatures present in larval shells and outermost portions of settler shells. These geochemical signatures were used to examine natural elemental variability in shells, with respect to salinity and temperature, and to explore discriminatory ability and resolution between sample sites or regions.
Methods
Temperature, salinity, and trace metal manipulations
(mid-September). Trace metal spikes were calculated to increase the ambient levels of Mn and Pb in seawater, as measured by Statham and Burton (1986) for Mn and Wu and Boyle (1997) for Pb, by 400% and 800% for mid and elevated spike levels, respectively.
Three-day old C. virginica larvae were obtained from the University of Maryland’s Horn Point Laboratory in Cambridge, Maryland, USA. These larvae were mass spawned from a total of 21 males and 28 females and reared in a hatchery system until shipment to the Institute of Marine Sciences (IMS) in Morehead City, NC. Upon arrival, larvae were divided equally into 2, 1.2 L aerated holding tanks filled with a 12.5 ppt seawater mix (ultrapure H2O added to filtered seawater from Bogue Sound, NC). Over the next 4 days, larvae were
acclimatized, with one tank receiving a salinity increase of approximately 2 ppt per day, resulting in a final salinity of 20 ppt, while the other tank remained at 12.5 ppt.
After the acclimatization process was complete, larvae from both holding tanks, now 7 days old, were divided equally into 72 “larval homes”, with approximately 1.6 x 10⁴ larvae per home (21.2 larvae cm-3). Larval homes were constructed from hollow PVC tubing capped on each side with nitex cloth, with a 30 μm mesh opening, to allow for the flow of water and food into the home, but prevent larvae from escaping. Homes were then placed into 24 aerated aquarium tanks (35 L), with 3 homes per tank. All tubing, PVC, air stones, and nitex were soaked in a HNO3 solution and then rinsed thoroughly with ultrapure H2O prior to its use in the experiment.
Fisher Scientific reference standard solutions, for mid and elevated spike treatments,
respectively. Individual treatments (temperature, salinity, and Mn/Pb spiking) were crossed, to produce a full factorial design with 12 total treatment combinations. Water changes were conducted every other day by removing one-third (~12 L) of water from the tank and replacing it with a freshly made mix. To account for trace element dilution when un-spiked water was added during water changes, tanks with mid or elevated spike treatments were re-spiked with one-third of the original spike (182 μl of Mn + 1.82 μl of Pb or 363 μl of Mn + 3.63 μl of Pb). Immediately following water changes, larvae were fed by depositing dilute Instant Algae Shellfish Diet 1800 (Reed Mariculture; Campbell, California, USA) into larval homes via syringe. The experiment ran for 7 days, until the larvae were 14 days old.
Dissolved oxygen, temperature and salinity were monitored daily with a HACH HQ40d dual input, multi-parameter portable water quality meter. Dissolved oxygen, pH, salinity and temperature measures remained consistent among the treatments throughout our laboratory experiments. Mean dissolved oxygen and pH were 8.68 ± 0.025 mg L-1 and 7.72 ± 0.032, respectively. Mean salinity for high and low salinity treatments were 20.7 ±0.091 ppt and 12.8± 0.120 ppt, respectively. Mean temperature for high temperature treatments was 25.7 ± 0.157 °C and 21.3 ±0.104 °C for low temperature treatments.
Wuenschel 2006). While measurements of specific elements are possible (e.g., Pb),
determining the bioavailability of these elements within specific environments can be more challenging (Eggleton & Thomas 2004). Furthermore, the addition of larval oyster food into our mesocosms may complicate traditional elemental detection methods (Bath Martin & Wuenschel 2006). However, larval diet was distributed uniformly to all tanks and thus, while the chemistry of the actual treatments was not verified, we do have reason to assume
consistency among treatments. The larval diet used, Shellfish Diet 1800, was cultured in artificial seawater (with a deionized water base), which precludes any suspicions that it may contain above average levels of trace elements.
At the conclusion of these mesocosm incubations, larvae from each home were filtered using nitex cloth (30 μm) and then resuspended in 15 mL of water from their respective tank. A 0.5-1 mL subsample of each larval resuspension was removed and the number of whole larvae were counted. The remaining larval solution was then frozen at -23°C until sample preparation for geochemical analysis.
Spat settlement sampling and site prediction
We collected recently settled spat (see below) across the Bogue-Back-Core-Pamlico Sound (BBCPS) estuarine system of NC sites to assess whether unique elemental signatures existed among estuarine regions that could be used to accurately predict collection sites of individual spat.
Study sites
Spat settlement collectors were constructed by affixing 2-3 wire strings, each
21st and again on August 1st and 16th of 2012 and retrieved approximately 2 weeks after each deployment as part of an ongoing settlement sampling program (Eggleston and Puckett, unpubl.data). Recovered settlement collectors were frozen until individual spat could be
counted and removed from adult oyster shells with a tungsten probe. Sample preparation and LA ICP-MS
Frozen larvae from the laboratory experiments were thawed and approximately 1000 larvae were obtained representing each replicate home. The larvae were then rinsed with ultrapure H2O and shells were inspected for any remaining tissue. The process of freezing, thawing, and rinsing larvae appeared to remove most soft tissue, and therefore acid and peroxide-which could degrade shells-were not needed nor employed. If larvae were highly translucent (i.e., no tissue present), they were mounted as a concentrated mass on a labeled glass microscope slide covered in double-sided tape. This process continued until larvae from each home were mounted on a slide in haphazard order (i.e., each home was represented by 1 mound of shells; total N=72). The slides then stored in a laminar flow hood until analysis.
Both larval and spat samples were analyzed using a Thermo-Fisher Element2 inductively coupled plasma mass spectrometer with a Teledyne ATLex 300si-x 193nm Excimer laserablation unit (LA ICP-MS). To correct for mass bias and instrument drift, National Institute of Technology Standards-certified standards (Reference Material 612, 614, and 616) were run at the beginning and end of every 4 slide sequence (~140 burns).
Concentrations of the following elements were quantified from laboratory larval samples: 48Ca, 55Mn, 88Sr, 138Ba, and 208Pb; and from field-collected spat: 26Mg, 48Ca, 55Mn, 63Cu, 88Sr, 118Sn, 138Ba, and 208Pb. These elements were all analyzed in low-resolution mode, and were chosen because of their previous use in uptake and tagging studies of fish otoliths and bivalve shells (Bath Martin & Thorrold 2005; Strasser et al. 2008a,b; Fodrie et al. 2011).
coefficients in bivalves (Strasser et al. 2008b), we opted to only utilize and report X:Ca ratios in our analyses.
Data analyses
Temperature, salinity, and trace metal manipulations
A 2-way ANOVA was used to test the effects of salinity and temperature on elemental ratios for the elements that were not spiked during the laboratory experiment (Sr and Ba). Due to the large amount of zero values in certain cases (e.g., undetectable amounts of Ba), Sr ratios and Ba ratios were transformed using a Box-Cox transformation to meet assumptions of normality and homogenous variances. After ensuring no interactive effects of Mn and Pb spikes with Sr or Ba signatures, or nesting effects for homes within individual tanks (using intraclass correlation), all tanks were included in this analysis with individual larval homes treated as replicates (N=6) and temperature and salinity treated as fixed factors.
For spiked elements (Mn and Pb), a three-way ANOVA was used to test the effects of salinity, temperature, and spike level on elemental ratios. Mn ratios were transformed with a Box-Cox transformation, while Pb ratios were transformed logarithmically to meet
assumptions of normality. After ensuring no nesting effects of individual tanks, homes were treated as replicates (N=6) temperature, salinity and spike level were treated as fixed factors. For all 4 elements, Tukey’s HSD tests were used post-hoc to explore differences among treatment groups
Spat settlement sampling and site classification
possible temperature and salinity gradients present among natal sites. Additionally, contour plots were used to explore how settler shell elemental concentrations of Mn, Sr, Ba, and Pb varied with temperature and salinity. Contour plots were created using the graphics package in R (version 3.0.3). Multiple regression models were then used to quantitatively assess the relationship between salinity, temperature and shell signatures in a natural environment. Because some collection sites did not produce any spat over a given collection period, spat were grouped only by site to increase the sample size and statistical power of our results. A logarithmic transformation of elemental ratio was used as the response variable.
Linear Discriminate Function Analysis (DFA) was performed on Box-Cox transformed ratios to examine spatial variability in settler shell geochemistry and to determine the viability of using geochemical fingerprints to assess connectivity in oyster populations. All 23 sites were used in preliminary DFAs, however the classification success was low, directing us toward independent examination of PS sites from the BBCS sites. Because of spatial autocorrelation in temperature/salinity, PS sites were then grouped by geographic quadrant within PS: Northwest (NW; WC, EH, StP), Northeast (NE; RD, HT), Southeast (SE; OK, CI, WB), and Southwest (SW; OR, SoP, SQ). Each quadrant contained a diagonal of approximately 35 km to the centroid of PS. BBCS sites were similarly broken up into 5 groups based on geomorphology and site location: Bay (JB, WM), Creek (WH, TC), Newport (NeU, NeM, NeL), North (NoU, NoM, NoL), and Sound (BoS, BaS). Jack-knifed classification matrices, without sample replacement, were compared to expected
classification matrices, based on random chance, to assess classification success. Sites were additionally grouped based on similar temperature and salinity profiles, however
analysis did not continue with these groupings. Because natal origins are unknown and modeled dispersal pathways for the area (e.g. Haase et al. 2012) have not been empirically validated, no DFA was performed on larval signatures.
Results
Temperature, salinity and trace metal manipulations
Of the initial 1.60 x 10⁴ larvae per home, a mean of 8390 ± 920 larvae were
recovered, with an average of 128 ± 22.5 actively moving larvae per home. While estimated larval survival was low (based on presence of moving larvae), 0.80 ± 0.14%, survival did not vary significantly by treatment (p=0.524) and was consistent with published values of C. virginica larval survival (Davis 1964).
We found a significant interactive effect of temperature and salinity on Sr concentrations in larval shells (F=4.23, df=3, p=0.041; Fig. 1.2). Highest larval Sr concentrations, 5.51 ± 0.752 mmol mol-1, were presentin the low salinity (12 ppt), low temperature (21°C) treatment, representing an average increase of 35.1% over the mean concentrations of the other treatments. A similar pattern was observed in Ba concentration with a 572% increase in the low salinity, low temperature treatment as opposed to mean Ba concentrations of the other treatments combined. However, this trend was not statistically significant due to high variance within the treatment, cv=0.991 (F=1.02, df=3, p=0.383; Fig
1.2b).
treatments (F=59.6, df=11, p<0.001; Fig. 1.2). Temperature and salinity did not influence overall Mn concentration (F=1.46, df=3, p=0.228).
Larval shell concentration of Pb was highly variable, with no change in overall concentration with spike level and an overall mean of 0.034 ± 0.014 mmol mol-1 (F=1.02, df=2, p=0.361; Fig. 1.2). There was a significant interactive effect of temperature, salinity and spike level (F=3.369; df=11, p=0.0374) seen in the ambient and elevated Pb treatments. Specific comparisons for all examined elements and treatments are provided in Table 1.2. Settler signatures and site prediction
Both settler and larval shells from field-collected spat showed robust spatial
variability in Sr signatures (Fig. 1.3a,b), while elemental concentrations of Sr were typically higher in larval shell than in settler shell (e.g., 73.9% increase in intensity from settler to larval shell at SQ). Strong Sr:Ca gradients were present, with increasing Sr settler shell concentrations when moving northward (e.g., from SQ to EH, a 30.2% increase) and eastward toward inlet openings (e.g., RD and HT, 31.1% increase from SQ). High larval Sr:Ca concentrations were present in the southern Pamlico Sound (e.g., SoP, OR, WB), mean 4.72 ± 0.654 mmol mol-1 when compared to concentrations in the northern Pamlico Sound (e.g., EH, StP, WC), mean 3.28 ± .0292 mmol mol-1.
and even TC) exhibited higher Ba concentrations (e.g., a 127% increase when moving from SQ to RD).
Settler shell elemental concentrations varied greatly along natural temperature and salinity gradients (Fig. 1.4a-d). For Mn:Ca, greater concentrations (> 3.5 mmol mol-1) were found in settler shell collected from mid-salinity (26 ppt), mid-temperature (26 °C) sites, with concentrations declining at lower temperatures and higher salinities (<2 mmol mol-1; Fig. 1.4a). A multiple-regression model verified this, as Mn concentrations were negatively correlated with salinity (p<0.001) and positively correlated with temperature (p<0.001), with an R2 value of 0.101.Sr concentrations were greatest (> 3.8 mmol mol-1) at low temperature (<22 °C) and low salinity (< 21 ppt) waters, with concentrations decreasing with increasing salinity and temperature (Fig. 1.4b). Multiple-regression analysis validated this, showing strong, negative correlations between Sr signatures and temperature (p<0.001) and salinity (p=0.007), with an R2 value of 0.091. Conversely, observed Ba concentrations were greatest (> 0.06 mmol mol-1) at either end of the temperature range (<18 °C or >28 °C) and at high salinity (<30 ppt; Fig. 1.4c). Pb concentrations were the greatest in higher salinity water (>24 ppt), however concentrations varied across a wide range of temperatures (>16 °C and <29 °C), with highest levels in mid temperature water (Fig. 1.4d). We found no significant correlations between Ba:Ca or Pb:Ca ratios and salinity and temperature.
increase over the null expected of 34.1% (Fig. 1.5a,b). Classification success for spat collection location varied greatly between sites and quadrants, ranging from 0-68% correct assignments. The strongest discriminating elemental ratios for quadrant divisions were Sr:Ca, followed by Mn:Ca and Mg:Ca. For BBCS sites, discriminatory ability did not increase substantially when examining them without Pamlico Sound sites (classification success of 20.25%). When dividing southern sites into geomorphological regions (e.g., Bay, Creek), there was a marginal increase in average classification success to 34.9% (Fig. 1.5c).
Discrimination was driven, in order of predictive ability, by Mn:Ca, Mg:Ca, and Sr:Ca ratios, based on forward stepwise variable analysis. When consolidating all the BBCS sites into a single “SS” grouping and including Pamlico Sound quadrants, jackknifed classification success rose to 76.5% over a null expected of 23.8% (Fig. 1.5d), however classification success was still highly variable among sites, ranging from 96% (SS) to 0% (NW). The strongest discriminating elemental ratios for these groupings were, again, Sr:Ca, followed by Mn:Ca and Mg:Ca, based on forward stepwise variable analysis (Fig. 1.6). For all grouping combinations, Pb:Ca was the least discriminatory element.
Discussion
Geochemical tags, reflective of spatial gradients in environmental conditions, have been successfully used to identify natal origins, nursery use, and population-level
oyster shells are reliable over regional (35 km) spatial scales within a large estuarine complex. However, conditions of an individual site (i.e., temperature and salinity) can vary greatly across time and space. Consequently, this approach may be better suited to predicting environmental conditions within a site at a given time, rather than discriminating between specific collection sites. Here, we consider the utility of geochemical signatures in discerning environmental condition over various scales within an estuarine system.
Environmental influence of trace metal signatures
It has been suggested that biological regulation of Sr ions has more influence on shell elemental concentration than salinity or kinetic effects of temperature (Gillikin et al. 2005, Strasser et al. 2008b). However, we observed significantly higher levels of Sr at low salinity and low temperatures in experimental larval oysters and field-collected settlers, supporting the utility of Sr as a marker of abiotic conditions experienced by an individual in tagging studies. If Sr incorporation into oyster shell is biologically regulated (as suggested by Strasser et al. 2008b), it follows that factors affecting metabolism (e.g., temperature) will likely impact Sr signatures. For example, cold water can lead to proportionally heavier calcium carbonate structures (Worthington et al. 1995) as well as altered precipitation rates and elemental incorporation (Bath Martin & Thorrold 2005). For oysters in our study, lower temperatures may have slowed larval growth, resulting in increased proportional
accumulation of Sr within the settler shells (sensu Bath Martin & Wuenschel 2006) and thereby allowing the possibility of duel biotic and abiotic regulation of Sr signatures.
ambient Ba concentration and temperature and/or salinity. In the field however, higher levels of Ba were detected at lower temperatures, a trend also found in clams (Strasser et al. 2008b) and neogastropod shells (Zacherl et al. 2003). There was an anomalous spike in Ba at higher temperatures (>26°C) within the HT site, however this site also experienced the greatest variance in Ba concentrations (Fig. 1.3b). While the specific mechanisms remain unclear, we believe Ba signature can be used dependably to effectively discriminate between temporal environments in geochemical tagging studies.
Previous literature on the geochemistry of bivalve shells has been unable to define a specific relationship between Mn concentrations and temperature and salinity (Siegele et al. 2001, Strasser et al. 2008b). Similarly, Mn elemental ratios in our laboratory experiment did not show temperature or salinity effects, however Mn elemental ratios did scale with
increasing spike level. Mn can enter the marine environment via terrestrial runoff, particle re-suspension, and as a product of redox reactions occurring in low-oxygen environments (Limburg et al. 2015). Therefore, we can expect that riverine inputs and localized phytoplankton blooms created hypoxic/anoxic zones that resulted in the strong discriminatory ability of Mn among our study regions. This also explains why higher concentrations of Mn were found within warmer, less oxygen-rich waters (e.g., OR). While Strasser et al. (2008b) found results similar to ours with respect to Pb concentration in larval clams-no effects of temperature or salinity-they also assert that Pb signatures are more strongly influenced by seawater Pb concentration than temperature or salinity (as in Pitts & Wallace 1994). However, we did not find a relationship between
collection sites, or quadrants, and the addition of Pb to our final DFA model did not
significantly enhance prediction ability. Pb enters the marine environment via anthropogenic pollutants, but as there are no explicit point sources for Pb within the BBCPS system, it was improbable Pb would have as much discriminatory power as other trace metals. Furthermore, Pb in the water column is often adsorbed to sinking particles and scavenged very quickly by sediments; therefore, it is unlikely that much of it is bioavailable (Bruland and Lohan 2003).
Our initial larval cleaning methodology included rinsing larvae with a mild acid solution, however, significant degradation of shell material was observed and remaining larvae were rinsed only with ultrapure H2O. While shells were examined visually for signs of remaining tissue, it is possible that residual organic matter or surface contaminants
influenced observed elemental patterns. As individual tank environments were monitored and held constant (with the exception of treatment factors), it is unlikely that specific tanks, larval homes, or larvae would have higher contamination risks than others. Nevertheless,
differences in cleaning methodology may limit some comparisons of shell chemistry of mesocosm larvae with the larval shell of field-collected spat, which were cleaned with nitric acid. To avoid possible contamination and/or standardization issues, future larval mesocosm studies might consider developing and employing a methodology that utilizes mild acid-washing to clean larval shells.
Application of elemental tagging to assess oyster larval population connectivity
Among the established Pamlico Sound quadrants, elemental tags showed high discriminatory ability and accurately assigned juvenile oysters to their region of collection with a resolution of ~35 km. Comparatively, oysters failed to provide the same
resolution found by Cathey et al. (2012) for the hard clam, Mercenaria mercenaria, but did deliver close to the 20-30 km resolution found for mussel species Mytilus
californianus and Mytilus galloprovincialis and the 25-75 km resolution found for the
Olympia oyster Ostrea lurida in San Diego, CA, USA (Becker et al. 2007, Carson 2010). Several factors may be responsible for this dissimilarity in scales between hard clams and oysters, including differing ICP MS methods (dissolving shell in acid as in Cathey et al. 2012 is more integrative and incorporates longer time periods whereas laser ablation in the present study targets specific points in time), potential variations in uptake at the organismal level, and sample site selection and variability. Predicted dispersal distances for C. virginica larvae range from 0.1 km to up to 110km (North et al. 2008, Puckett et al. 2014), so our results indicate that elemental tagging can be valuable for refining our understanding of estuarine-scale larval connectivity for these species in the PS as well as in similar estuarine
environments (e.g., Chesapeake Bay).
high discriminatory ability, similar levels among sites within regional groupings provided greater uniqueness to the overall signature, however, at the scale of individual sites, site proximity and environmental similarity resulted in ambiguous elemental signatures.
Proximity to freshwater sources may also explain the low level of prediction accuracy within and among the BBCS and Pamlico Sound sites. When analyzed individually, the BBCS sites had very low prediction accuracy, driven by a large overlap in predicted site matching between the Newport and North Rivers. As the rivers are adjacent (~6 km apart) and experience comparable surrounding land usage, similar geochemical environments and signatures are to be expected. While including the Pamlico Sound sites (as quadrants) and the singular SS site into the geomorphological DFA (Fig. 1.5d) significantly improved
classification accuracy, high between-site variability was likely an additional result of the connection between Pamlico Sound and the Newport and North Rivers.
variability within sites (e.g., OK) may indicate multiple natal sources exist even within a single area or site where spat have settled.
Given the differences we recorded in larval and settler shell from individual spat, our findings support previous work demonstrating the importance of a larval shell atlas for exploring larval connectivity, such as that utilized by Becker et al. (2007). This is necessary to expand our understanding of larval connectivity and identify potential dispersal corridors within the BBCPS system. Larval outplant experiments would also allow for exposure to other environmental factors not examined in our laboratory experiments, such as ultraviolet radiation, localized primary production, and oxygen concentration, which may affect element uptake (e.g., Eldson & Gillanders 2005). Finally, we recommend the coupling of
geochemical tagging data (e.g., based on larval drifter studies) with expanded biological (e.g., surveys of adult oyster density and distribution), and physical (e.g., current and wind patterns) datasets to produce rigorous biophysical models, which can be used to predict dispersal and inform managers.
29
30
Table 1.1. Mean temperature (± standard error) and salinity (± standard error) measurements for spat collection sites over the collection periods in summer 2012.
Table 1.2. Analysis of variance (ANOVA) table summarizing the effects of temperature (T), salinity (S), and Mn/Pb spike ([ ]) on C. virginica larvae in laboratory experiments (Note: N=number of larval homes).
Element (X:Ca) Factor N df F p
Sr T 36 1 2.18 0.142
S 36 1 2.60 0.108
T × S 18 3 4.23 0.041*
Ba T 36 1 1.01 0.316
S 26 1 1.00 0.317
T × S 18 3 1.05 0.306
Mn T 36 1 0.417 0.519
S 36 1 0.710 0.401
[ ] 24 2 56.9 <0.001*
T × S 18 3 1.46 0.228
T × [ ] 12 4 2.19 0.115
S × [ ] 12 4 2.62 0.0753
T × S × [ ] 6 11 2.15 0.119
Pb T 36 1 0.731 0.393
S 36 1 0.096 0.757
[ ] 24 2 1.02 0.361
T × S 18 3 0.676 0.412
T × [ ] 12 4 0.177 0.838
S × [ ] 12 4 0.588 0.556
LITERATURE CITED
Able, KW (2005) A re-examination of fish estuarine dependence: Evidence for connectivity between estuarine and ocean habitats. Estuar Coast Shelf S 64:5–17
Angilletta MJ, Steury TD, Sears MW (2004) Temperature, growth rate, and body size in ectotherms: fitting pieces of a life-history puzzle. Integr Comp Biol 44:498–509 Bath G, Thorrold S, Jones C (2000) Strontium and barium uptake in aragonitic otoliths of
marine fish. Geochim Cosmochim Ac 64:1705–1714
Bath Martin G, Thorrold S (2005) Temperature and salinity effects on magnesium, manganese, and barium incorporation in otoliths of larval and early juvenile spot Leiostomus xanthurus. Mar Ecol Prog Ser 293:223–232
Bath Martin G, Wuenschel M (2006) Effect of temperature and salinity on otolith element incorporation in juvenile gray snapper Lutjanus griseus. Mar Ecol Prog Ser 324:229– 239
Beck MW, Heck KL, Able KW, Childers DL, Eggleston DB, Gillanders BM, Halpern B, Hays CG, Hoshino K, Minello TJ, Orth RJ, Sheridan PF, Weinstein MP (2001) The identification, conservation, and management of estuarine and marine nurseries for fish and invertebrates. Bioscience 51:633-641
Becker BJ, Fodrie FJ, McMillan PA, Levin LA (2005) Spatial and temporal variation in trace elemental fingerprints of mytilid mussel shells: A precursor to invertebrate larval tracking. Limnol Oceanogr 50:48-61
Becker BJ, Levin LA, Fodrie FJ, McMillan PA (2007) Complex larval connectivity patterns among marine invertebrate populations. P Natl Acad Sci USA 104:3267–3272
Bradbury IR, DiBacco C, Thorrold SR, Snelgrove PVR, Campana SE (2011) Resolving natal tags using otolith geochemistry in an estuarine fish, rainbow smelt Osmerus mordax. Mar Ecol Prog Ser 433:195–204
Bruland KW, Lohan MC (2003) Controls of trace metals in seawater. Treaties on Geochemistry 6:23-47
Carson HS (2010) The population connectivity of the Olympia Oyster among southern California estuaries. Limnol Oceanogr 55:134-148
Carson HS, López-Duarte PC, Cook GS, Fodrie FJ, Becker BJ, DiBacco C, Levin LA (2013) Temporal, spatial, and interspecific variation in geochemical signatures within fish otoliths, bivalve larval shells, and crustacean larvae. Mar Ecol Prog Ser 473:133–148 Cathey AM, Miller NR, Kimmel DG (2012) Microchemistry of juvenile Mercenaria
Cowen RK, Sponaugle S (2009) Larval Dispersal and Marine Population Connectivity. Annu Rev Mar Sci 1:443–466
Davis HC (1958) Survival and growth of clam and oyster larvae at different salinities. Biol Bull 114: 297-307
Eggleston J, Thomas KV (2004) A review of factor affecting the release and bioavailability of contaminants during sediment disturbance events. Environ Intern 30:973-980 Elsdon TS, Gillanders BM (2005) Strontium incorporation into calcified structures:
Separating the effects of ambient water concentration and exposure time. Mar Ecol Prog Ser 285:233–243
Finch AA, Allison N (2007) Coordination of Sr and Mg in calcite and aragonite. Mineral Mag, 71:539-552
Fodrie FJ, Levin LA (2008) Linking juvenile habitat utilization to population dynamics of California halibut. Limnol Oceanogr, 53:799–812
Fodrie FJ, Becker BJ, Levin LA, Gruenthal K, McMillan PA (2011) Connectivity clues from short-term variability in settlement and geochemical tags of mytilid mussels. J Sea Res 65:141-150
Gaines SD, White C, Carr MH, Palumbi SR (2010) Designing marine reserve networks for both conservation and fisheries management. P Natl Acad Sci USA 107: 18286– 18293
Gerber LR, Botsford LW, Hastings A, Possingham HP, Gaines SD, Palumbi SR, Andelman S (2003) Population models for marine reserve design: A retrospective and
prospective synthesis. Ecol Appl 13:47-64
Gillikin DP, Lorrain A, Navez J, Taylor JW, André L, Keppens E, Baeyens W, Dehairs F (2005) Strong biological controls on Sr/Ca ratios in aragonitic marine bivalve shells. Geochem Geophys Geosyst 6:1-16
Haase AT, Eggleston DB, Luettich RA, Weaver RJ, Puckett BJ (2012) Estuarine circulation and predicted oyster larval dispersal among a network of reserves. Estuar Coast Shelf S 101:33–43
Jones GP, Milicich MJ, Emslie MJ, Lunow C (1999) Self-recruitment in a coral reef fish population. Nature 402:802-804
Kinlan BP, Gaines SD, Lester SE (2005) Propagule dispersal and the scales of marine community process. Divers Distrib 11:139-148
Medcof JC (1939) Larval life of the oyster (Ostrea virginica) in Bideford River. J Fish Res Board Canada, 4b:287–301
Morris AW, Bale AJ, Howland RJM (1982) The dynamics of estuarine manganese cycling. Estuar Coast Shelf S 14:175–192
North EW, Schlag Z, Hood RR, Li M, Zhong L, Gross T, Kennedy VS (2008) Vertical swimming behavior influences the dispersal of simulated oyster larvae in a coupled particle-tracking and hydrodynamic model of Chesapeake Bay. Mar Ecol Prog Ser 359: 99–115
O’Connor MI, Bruno JF, Gaines SD, Halpern BS, Lester SE, Kinlan BP, Weiss JM (2007) Temperature control of larval dispersal and the implications for marine ecology, evolution, and conservation. P Natl Acad Sci USA 104:1266–1271
Patterson HM, Kingsford MJ, McCulloch MT (2005) Resolution of the early life history of a reef fish using otolith chemistry. Coral Reefs 24:222–229
Pitts LC, Wallace GT (1994) Lead deposition in the shell of the bivalve, Mya arenaria: An indicator of dissolved lead in seawater. Estuar Coast Shelf S 39:93–104
Puckett BJ, Eggleston DB (2012) Oyster demographics in a network of no-take reserves: Recruitment, growth, survival, and density dependence. Mar Coast Fish 4:605–627 Puckett BJ, Eggleston DB, Kerr PC, Luettich, RA (2014) Larval dispersal and population
connectivity among a network of marine reserves. Fish Oceanogr 23:342–361 Qian H, Li Y, He R, Eggleston DB (2014) Connectivity in the Intra-American Seas and
implications for potential larval transport. Coral Reefs doi:10.1007/s00338-014-1244-0
Shanks AL, Eckert GL (2005) Population persistence of California Current fishes and benthic crustaceans: A marine drift paradox. Ecol Monogr 75:505–524. Siegele R, Orlic I, Cohen DD, Markich SJ, Jeffree RA (2001) Manganese profiles in
freshwater mussel shells. Nucl Instrum Meth B 181:593–597
Statham PJ, Burton JD (1986) Dissolved manganese in the North Atlantic Ocean 0-35°N. Earth Planet Sc Lett 79:55-65
Stenzel HB (1964) Oysters: Composition of the larval shell. Science 145:155–156 Strasser CA, Mullineaux LS, Walther BD (2008a) Growth rate and age effects on Mya
Strasser CA, Mullineaux L, Thorrold S (2008b) Temperature and salinity effects on elemental uptake in the shells of larval and juvenile softshell clams Mya arenaria. Mar Ecol Prog Ser 370:155–169
Worthington DG, Doherty PJ, Fowler AJ (1995) Variation in the relationship between otolith weight and age: implications for the estimation of age of two tropical damselfish (Pomacentrus moluccensis and P.wardi). Can J Fish Aquat Sci 52:233-242 Wu J, Boyle EA (1997) Lead in the western North Atlantic Ocean: Cpleted response to
leaded gasoline phaseout. Geochim Cosmochim Ac 61:3279-3283
Young CM (1990) Larval ecology of marine invertebrates: a sesquicentennial history. Ophelia 32:1-48
CHAPTER 2: QUANTIFYING ESTUARINE-SCALE INVERTEBRATE LARVAL CONNECTIVITY: METHODOLOGICAL AND ECOLOGICAL INSIGHTS Introduction
The ability to discern larval dispersal patterns is fundamental to the understanding and subsequent management of ecologically and commercially valuable marine species (Young 1990; Gillanders et al. 2003). For example, idealized marine reserve design depends on sufficient larval import (via immigration and self-recruitment; Jones et al. 1999; Puckett and Eggleston 2016) and export (e.g., spillover; Gerber et al. 2003; Gaines et al. 2010). Additionally, knowledge of system-specific larval import and export allows managers to allocate resources more effectively: in areas where local retention is higher than overall connectivity, efforts should focus on improving subpopulation demographics to bolster recruitment. Conversely, for sub-populations with relatively high connectivity and low local retention, local demographics become less coupled with recruitment and therefore less important (Almany et al. 2009; Figueira 2009; Puckett and Eggleston 2016). A greater understanding of larval connectivity can also aid in the understanding of year-class fluctuations in commercially important species (Hjort 1914). Knowledge of dispersal patterns, as well as the biological and physical parameters which control connectivity, will also become essential to predicting the effects climate change will have on the resiliency and persistence of future populations (Cowen and Sponaugle 2009).
inform metapopulation dynamics (Thorrold et al. 2002; Levin 2006; Puckett et al. 2014). With the aid of improved technology (i.e., rapid and inexpensive genetic analyses and high-resolution mass spectrometry), the use of natural tag methods has become more accessible and diverse (Durrant and Ward 2005). Recently, tagging studies have reevaluated the extent of geographic connectivity of marine fishes and invertebrates (Lopez-Duarte et al. 2012), and by demonstrating higher levels of self-recruitment than previously assumed, have helped change the paradigm of marine larval dispersal from passive long-distance to behaviorally-mediated shorter-distance dispersal (Almany et al. 2007).
Geochemical signatures stored within calcified structures, such as fish otoliths, gastropod statocysts, and bivalve shells, are particularly useful for examining marine larval connectivity as many marine organisms begin recording geochemical signatures from egg fertilization (Thorrold et al. 2002; Becker et al. 2007; Kroll et al. 2016). Furthermore, geochemical tags are valuable to connectivity studies because they are capable of discerning between environmentally variable locations (e.g, within or among estuaries) with potentially high spatial resolution (~12 kms; Cathey et al. 2012). A key component of these studies involves the generation of reference signatures (i.e., atlases) from known location to inform multivariate algorithms that assign settling larvae of unknown natal origin to their natal source. For larval connectivity studies, generating reference signatures is traditional
natal sites, whereas drifter larvae contain a more integrated signature of the environments larvae are exposed to as they disperse.
Estuarine systems provide an ideal setting in which to develop geochemical tagging methods and explore connectivity as they are characterized by high environmental variation through time and space, encompass varying geomorphological components (i.e., oyster reefs, marshes, barrier islands), and function as important nursery, juvenile, and adult habitats for several marine organisms (Beck et al. 2001). Many vertebrate and invertebrate species form distinct subpopulations, with varying amount of larval exchange and connectivity, within estuarine systems (Kämpf et al. 2010; Vasconcelos et al. 2011; Cathey et al. 2012). While finfish connectivity has been examined over numerous spatial scales within estuaries of the US east and west coasts, as well as abroad (e.g., Able 2005; Fodrie and Levin 2008; Vinagre et al. 2011), we know relatively little about the scale of estuarine larval connectivity for invertebrates, and most of what is known is based on biophysical models (e.g., Reyns et al. 2007; North et al. 2008; Narvaez et al. 2012; Puckett et al. 2014). The few studies that have begun to examine invertebrate larval connectivity in estuarine systems have determined that geochemical tagging methods are a viable tool for connectivity studies (Cathey et al. 2012; Kroll et al. 2016).
The goal of this study was to gain insight into the larval connectivity and dispersal of a commercially and ecologically important invertebrate, the Eastern oyster (Crassostrea virginica), within a large, wind-driven estuarine system. A requisite for achieving this goal
two different methodological approaches for developing the atlas by outplanting recently spawned oyster larvae to stationary moorings and surface drifters. We compared outplanting methods in their ability to represent distinct natal signatures or potential larval dispersal corridors. Geochemical signatures from outplanted larvae were used to predict the region of origin (NW, NE, SE, SW), within PS, of recently settled oysters (hereafter “spat”) collected from several sites across the Sound. Classification successes from discriminant function analysis predicted patterns of dispersal, and diversity indices were used to evaluate connectivity and outplanting techniques.
Methods
Study system and previous application of geochemical signatures
Previous connectivity studies within PS have been used to not only investigate dispersal patterns but also highlight the relationship between prevailing wind magnitude and direction and current magnitude and direction. Over a two-year timespan, Reyns et al. (2007) found that 70-96% of the variance in non-tidal current velocities occurred within the
direction of primary wind flow, whereas tidal velocities increased with decreasing distance toward inlets. Floating surface drifters have also been used to empirically validate wind-based dispersal models with high levels of success within the PS, indicating that net transport is primarily wind-driven (Haase et al. 2012). More recently, biophysical models have shown that location and date of spawning in combination with frequency of wind reversals and magnitude of wind direction significantly influenced larval dispersal patterns within PS (Puckett et al. 2014).
nearly all aspects of dispersal, indicating the need to develop an atlas that incorporates site and region specific geochemical signatures.
A recent study conducted by the authors found that there was substantial
spatiotemporal variation throughout PS to successfully apply geochemical tagging methods to C. virginica shells and that geochemical signatures in shells could be utilized to
discriminate between collection regions within PS (~ 35 x 15 km; Kroll et al. 2016). For this study, we used larval outplanting methods to develop an atlas of geochemical signatures at the following sites in PS (Fig. 2.1): Cedar Island (CI), Crab Hole (CH), Gibbs Shoal (GS), Middle Bay (MB), Ocracoke (OK), West Bay (WBa), and West Bluff (WBl). Sites were chosen because of their proximity to oyster reefs of high density, or broodstock reserves. To capture a wide range of dispersal pathways, we also sampled the following sites within the Sound for newly settled spat: Englehard (EH), Hatteras (HT), North Central (NC), Oriental (OR), Point Peter (PP), Rodanthe (RD), South Central (SC), and Wanchese (WC) (Fig. 2.1a). Following the regions used in Kroll et al. (2016), we bisected PS twice to create four, ~ 35 x 15 km geographic regions (quadrants): Northwest PS (NW): CH, GS, EH, WC, PP;
Northeast PS (NE): HT, NC, RD; Southeast PS (SE): CI, OK, WB; and Southwest PS (SW): MB, OR, WBl.
Study species
individual settles on suitable benthic habitat (most typically, gregariously on other adult oyster shells; Stenzel 1964). Previous modeling studies have reported mean oyster larval dispersal range of ~5-40 km (Puckett et al. 2014). Recently settled spat are sessile for the remainder of their juvenile and adult life.
Larval outplanting
To (i) examine natal origins of settling C. virginica, (ii) identify larval connectivity, and (iii) compare larval outplanting methodology, we deployed larval “homes,” attached to stationary moorings and surface drifters during June 2013, June 2014, and August 2014. Outplanting times corresponded to known reproductive peaks of C. virginica within PS (Eggleston et al. 2011; Mroch et al. 2012). Larval homes were constructed from hollow PVC tubing capped on each side with 30 μm mesh, nitex cloth to allow for the flow of water, nutrients, and small phytoplankton into the home, yet prevent larvae from escaping. Three-day old C. virginica larvae were obtained from the University of Maryland’s Horn Point Laboratory in Cambridge, Maryland, USA, acclimatized to local salinity, and then divided into homes, with approximately 1.6 x 10⁴ larvae per home (21.2 larvae cm-3). For further detail on larval home construction and the acclimatization process, see Kroll et al. (2016).
MA). Drifters and moorings were deployed at reserve sites for approximately one week (7 d) to incorporate the chemical signature of the (i) associated site (moorings) and (ii) dispersal pathway (drifters) within the prodissoconch shell. For certain replicates, drifter trials were terminated early in cases of inclement weather, drifter removal by fisherman, or if a drifter ran aground.
In June 2013, stationary moorings were deployed at CH, CI, GS, MB, WB, and WBl. Drifters were deployed from CH, CI, GS, MB, WB. An additional drifter was deployed at WBl, however, the GPS signal was lost and the drifter was never recovered. Drifters and moorings were deployed from CH, CI, GS, OK, MB, WB, and WBl in June 2014, with all drifters successfully retrieved. In August 2014, drifters and moorings were deployed from CH, CI, GS, OK, MB, and WB. Additionally, in August 2014, a mooring, but no drifter, was deployed at WBl. All drifters, except MB, were successfully retrieved during this final trial. To focus resources on the regions with the highest concentrations and densities of oyster reefs (Puckett and Eggleston 2012; Peters 2014), no drifters or moorings were deployed within the NE region of PS during this study. During the drifter sampling periods, wind speed and direction was collected from PS monitoring station HCGN7 (35.2101 N, 75.6997 W) maintained by the National Centers for Environmental Information (ncdc.noaa.gov).
Spat settlement sampling
Spat settlement collectors were constructed by affixing 2-3 wire strings, each
containing 12 adult oyster shells, to the aforementioned stationary moorings at reserve sites, as well as private and public docks or stand-alone wooden pilings at EH, HT, NC, OR, PP, RD, and WC (consistent across all three trials). Although no outplanting was done in the NE region, we did collect spat from that region (e.g., HT, NC, and RD sites) because reefs do persist there and may function as larval “sinks” (Puckett et al. 2016). To ensure we collected spat that were larvae during our drifter/mooring deployment periods, settlement collectors were deployed during each larval home recovery (June 2013, June 2014, August 2014) and retrieved approximately 2 weeks later. Recovered shell-string oyster shells with recently settled spat were frozen until individual spat could be counted and removed from adult oyster shells with a dissecting microscope and tungsten probe, respectively.
Sample preparation and LA ICP-MS
Frozen larvae from homes and spat from field collections were thawed, cleaned (see Kroll et al. 2016 for respective cleaning methods), and mounted on a glass microscope slide in haphazard order. Larvae were mounted as a concentrated mass on a labeled glass
microscope slide covered in double-sided tape (i.e., each home was represented by 1 mound of shells), whereas each spat was mounted individually. The slides were then stored in a laminar flow hood until analysis.
and 616) were run at the beginning and end of every 4 slide sequence (~140 burns). Concentrations of the following elements were quantified from larval and spat samples: 26Mg, 48Ca, 55Mn, 59Co, 63Cu, 88Sr, 112Cd, 118Sn, 138Ba, and 208Pb. These elements were all analyzed in low-resolution mode, and were chosen because of their previous use in uptake and tagging studies of bivalve shells (Strasser et al. 2008a,b; Fodrie et al. 2011; Kroll et al. 2016).
Mounted larvae from drifter and mooring homes were ablated three times in bulk, using side-by-side line transects of 150 μm with 40 μm spot size and 80% laser intensity. Line transects covered ~2-3 shell lengths, following Becker et al. (2007), and were used instead of burning several individual larvae to reduce the likelihood of pseudoreplication. To determine elemental signatures of the spat collection sites, the larval shell (prodissoconch) section of the shell was ablated twice with side-by-side line transects of 110 μm with 40 μm spot size and 80% intensity. Larval shell transects extended from the umbo toward the outward edge of the larval shell following Strasser et al. (2008). Isotope intensities for replicate burns were averaged and then converted into elemental ratios (X:Ca) for each home or spat/larval shell following Becker et al. (2005).
Data analysis
Linear Discriminate Function Analysis (DFA) was performed on Box-Cox
transformed larval ratios to determine whether distinct spatial signatures could be identified in larval shell geochemistry between sites, as well as between mooring and drifter

![Figure 1.2. Average X:Ca elemental ratios, determined by LA ICP-MS, for larvae exposed to high and low temperature and salinity and ambient [0] , mid [+], and elevated [++] concentrations of: a) Sr, b) Ba, c) Mn, and d) Pb](https://thumb-us.123doks.com/thumbv2/123dok_us/8322623.2206273/42.1188.143.931.113.632/figure-average-elemental-determined-temperature-salinity-elevated-concentrations.webp)


![Table 1.2. Analysis of variance (ANOVA) table summarizing the effects of temperature (T), salinity (S), and Mn/Pb spike ([ ]) on C](https://thumb-us.123doks.com/thumbv2/123dok_us/8322623.2206273/48.918.136.778.184.846/table-analysis-variance-anova-summarizing-effects-temperature-salinity.webp)

