STATE TRAJECTORIES OF SUFFRAGE IN THE UNITED STATES, 1900-1950
Rosemary Russo
A thesis submitted to the faculty of The University of North Carolina at Chapel Hill in partial fulfillment of the requirements for the degree of Master of Arts in the Department
of Sociology.
Chapel Hill 2013
Approved by:
Kenneth Bollen
Kenneth Andrews
ABSTRACT
Rosemary Russo: State Trajectories of Suffrage in the United States, 1900-1950 (Under the direction of Kenneth Bollen)
One of the most important components of a democratic state is the degree to
which the citizenry can freely elect their leaders. Most political systems call for the
universal suffrage of the citizenry, although this is rarely a reality. This paper adds to
the current scholarship on suffrage by providing a new, more comprehensive measure
for suffrage in the United States in the first half of the twentieth century which allows for
the inclusion of extensions that occurred during that time as well as suffrage retractions
such as poll taxes, literacy, felon disenfranchisement, and citizenship. Using this new
measure, this project then provides longitudinal trajectories of each state’s suffrage
expansions, and retractions during the first half of the twentieth century. A preliminary
analysis of these trajectories is then completed in order to empirically test several
theories on suffrage extensions and retractions and some mixed support of these
TABLE OF CONTENTS
LIST OF TABLES ……….…..vi
LIST OF FIGURES ……….. vii
CHAPTER I. INTRODUCTION………...1
Importance of Topic ………....1
Objectives of Research …….……….1
II. LITERATURE REVIEW…..……….5
Response to a Revolutionary Threat ………..…..7
Political Opportunities, Desires, and Competition ………..9
Explanation of Suffrage Retractions ………...13
Current Study………..15
III. DATA AND METHODS………17
Initial Dataset ……….17
Analytical Strategy for Longitudinal Trajectories ………..18
Independent Variables for Longitudinal Trajectories ………...…21
IV. RESULTS………..…23
Descriptive Analysis of Overall State Suffrage Levels……….23
Voter Turnout Rates Using Suffrage Measure ………...25
V. Discussion and Conclusion ………....35
APPENDIX A: U.S. SUFFRAGE Percentages, 1900-1950…….………39
LIST OF TABLES
Table 1: Summary of Statistics of Suffrage Levels in the U.S., 1900-1950 ….... ………24
Table 2: Descriptive Statistics of Variables and Bivariate Correlations…...………..30
LIST OF FIGURES
Figure 1: Trajectories of Suffrage for the 48 States, 1900-1950 ………….….. …….…..24
Figure 2: Select Sates with Different Types of Trajectories…………...…...………..……25
Figure 3: Trajectory of the Average Suffrage Level in the U.S., 1900-1950…...……..…25
Figure 4: Presidential Voter Turnout Rates in the U.S., 1900-1952……….…...……..…26
I. Introduction
Importance of Topic
One of the most important components of a democratic state is the degree to which
the citizenry can freely elect their leaders. Most political systems call for the universal
suffrage of the citizenry, although this is rarely a reality. Generally, nations that utilize
democratic elections have a history of changes to their laws which stipulate who is and
who is not eligible to vote. These transformations of the extent of suffrage not only map
out the changing political power of the minority groups affected by such voting laws,
they also provide an important account of public attitudes and political pressures that
may have contributed to their passage. Therefore, understanding how suffrage
extensions and retractions have been applied historically is important in order to
understand how the nature of democracy has been transformed in relation to changing
social and political factors and can also assist in better foreseeing future challenges to
the democratic ideal of universal suffrage.
Objectives of Research
This paper adds to the current scholarship on suffrage by providing a new, more
comprehensive measure for suffrage in the United States in the first half of the twentieth
century which will allow for inclusion of extensions that occurred during that time as well
as suffrage retractions such as poll taxes, literacy, felon disenfranchisement, and
longitudinal trajectories of each state’s suffrage expansions, and retractions, during the
first half of the twentieth century. Past research on suffrage in the United States has
not included many of the components of this suffrage measure and by adding these
factors a more complete picture of suffrage for each state over the course of this time
period will be presented.
The history of suffrage in the United Sates can be understood as a record of both
extensions and retractions, although the latter issue is not often addressed. Prior to the
1840’s, most states extended the franchise to immigrants who had not yet naturalized
but had declared their intent to do so. This practice continued through the early 1900’s
when a handful of states still allowed noncitizens to vote until the last state, Arkansas,
passed a constitutional amendment in 1926 to ban all noncitizens from voting
(Harper-Ho, 2000). Similarly, after passage of the Fifteenth Amendment to the U.S. Constitution
in 1870, which banned states from using race as criteria for voting laws, many states
passed literacy laws and poll taxes as a strategy to keep African Americans from voting.
These were not all completely removed until the Voting Rights Act of 1965 was passed
(Keyssar, 2000). Finally, passage of the Nineteenth Amendment to the U.S.
Constitution in 1920 banned all states from using gender as a criterion for voting laws
(Keyssar, 2000).
Even at the current time, true universal suffrage does not exist in the U.S. due to
laws which restrict voting to a certain age, require U.S. citizenship, and bar certain
populations from voting according to state laws (such as prisoners and felons, other
institutionalized citizens, and non-citizens). Since each state in the U.S. has always
to the relevant Federal constitutional amendments, unique paths to this current
quasi-universal suffrage have emerged. While the overall trajectory of each state’s suffrage
level has been expansionary, several states expanded the franchise at a much slower
rate due to their enacting of restrictive laws, such as literacy requirements, citizenship
requirements, and poll taxes.
This paper will address the question of how we can best describe the individual state
trajectories of suffrage extensions and retractions in the United States during the first
half of the twentieth century. The nature of how states individually progressed in
expanding (and retracting) the franchise during this time period is an important issue for
several reasons. First of all, while a large amount of research has been done on voting
rights in the U.S., this research tends to focus on specific suffrage movements such as
women’s suffrage, African American suffrage, noncitizen suffrage, and felon
disenfranchisement. Developing and analyzing a measure of overall suffrage for each
state which integrates each of these issues can provide a more complete story about
the way in which each state was able to fulfill the democratic ideal of universal suffrage
and what factors might be associated with faster or slower growth in political power of
those residing in its territory.
Finally, given the contemporary importance of immigration issues in the U.S., the
incorporation of the extension (and later retraction) of voting rights in the U.S. among
noncitizens in the early twentieth century is an important issue to explore. Current
immigration flows (as a percentage of the total population) have recently begun to reach
a level similar to that of the early twentieth century when the last of these noncitizen
restrictions on the amount of immigrants who are eligible for citizenship, while at the
same time the process of becoming a citizen has become much more difficult (Kunnan,
2009). As a result, the percentage of noncitizens will likely continue to increase
ensuring a paralleled increase in the percentage of people residing in this country who
are not able to participate in the democratic process. Since the percentage of
noncitizens in the U.S. is now similar to that of the early twentieth century, it is useful to
understand the paths that led to such voting restrictions and what factors may have
been associated with them. The answers to these questions may shed light on how we
can best approach the problem of underrepresentation for the large amounts of
immigrants not yet able to secure citizenship in the United States.
The purpose of this paper will therefore be to not only provide a more
comprehensive way in which to measure suffrage on a state level but to further show
how combing this measure across time by state can create longitudinal trajectories of
suffrage which can be used for further analysis. The literature review below will help
II. Literature Review
An important application of the subject of suffrage in past scholarly research is its
use in measuring the concept of democracy. For example, Bollen (1998) created a
measure of suffrage as a component to a cross-national data set which included several
longitudinal indicators of liberal democracy from 1950-1990. The suffrage measure was
created using a coding scheme for qualitative data depending on voting laws as well as
quantitative demographic information in order to accurately estimate the percentage of
adults 20 and older that were allowed by law to vote. These suffrage scores were
assigned to each country for each year included in the data set, with a new score being
assigned if relevant laws changed. Paxton and colleagues have recently completed
an international comparative analysis of suffrage which extended the suffrage data to
2000 and compared different trends during the entire time period (Paxton, Bollen, Lee,
Kim 2003). Using the same coding scheme for the measurement of suffrage as Bollen
(1998), they were able to describe broad regional trends in suffrage and explore
international comparisons.
Paxton (2000) used similar suffrage data, specifically data on women’s suffrage,
to illustrate how the inclusion of a disenfranchised group in the measurement of
democracy can have a large effect on how we view the timing of the transition to
democracy and the causes of democratization. This again illustrates why suffrage is
such an important issue to consider. Given that universal suffrage is a central aspect in
measure that accounts for the degree of its presence or absence can drastically change
how we identify if a nation is indeed a democracy. This can then, as Paxton (2000)
shows in her analysis, result in a mischaracterization of our political theories that
attempt to explain or predict democratic formations and transitions.
Another application of suffrage can be found in the calculation of voter turnout
rates. Voter turnout rates are often used to provide information on the process of
electoral participation, specifically the proportion of the eligible electorate that is taking
part in the political process. One key component in determining the voter turnout rate
for any election then is first having an understanding of the eligible electorate which also
requires knowing what the relevant voting laws are as well as demographic information.
A comprehensive suffrage measure would thus be helpful in providing this information,
especially if turnout rates are needed on a state level. Indeed, McDonald and Popkin
(2001) have recently developed new voter turnout rates by U.S. state for the elections
from 1948-2000 using more detailed information on the electorate than Census
estimates of the entire voting age population which is what it is more commonly used.
In their analysis they show that incorporation of more accurate figures regarding the
potential electorate is instrumental in showing that voter turnout is not decreasing as
much as is currently reported, and in fact it is the ineligible voting population that is
increasing which is causing turnout rates to fall. Therefore comprehensive state level
suffrage measures are quite useful in creating more accurate turnout analyses.
Other scholarly research that has been done on the subject of suffrage in
democratic countries often involves the development of theoretical arguments to explain
why those with political power would choose to expand the franchise and thereby
possibly lose some of their power and influence (Przeworski, 2008). These theoretical
arguments can be helpful in considering how to approach an analysis of suffrage trends
and can also assist in developing hypotheses to explain the nature of change and
variation in suffrage trends. These theories on suffrage transitions can be summarized
according to the way in which their explanations for this phenomenon are characterized.
Response to a Revolutionary Threat
A long-standing explanation for suffrage extension that can be traced back to
Britain’s Earl Grey in 1832 (Przeworksi, 2008) and developed formally by Tilly (2000)
and Bendix (2003) illustrates that the expansion of voting rights can be understood as a
strategy of the political elites used in response to fears of a possible revolution by the
masses during periods of popular unrest and strife. Voting rights are therefore
expanded to certain parts of the disenfranchised masses in order to assuage their
frustrations, thereby preventing revolution. The example of suffrage extensions to the
middle classes in Britain in 1832 illustrates this as explained by Przeworksi (2008) and
Acemoglu & Robinson (2000). Earl Grey, the prime minister at the time, explained
when proposing reforms for suffrage extension that he was doing so in order to prevent
revolution, although he did not agree with the ideal of universal suffrage himself
(Acemoglu & Robinson, 2000).
Tilly’s (2000) analysis goes further by considering the casual mechanisms (and
blockages) of democratization in several European countries from 1650 to the present.
diffusion of political power to those excluded from it. The mobilization phase of this
cycle is characterized by a collective uprising of those without political power which
represents a threat to the government authority. The repression phase is the
government response to this uprising, which fails in the scenario of democratization.
Finally, the bargaining phase occurs after the failed government repression as a last
resort by the government to maintain authority in exchange for the extension of some
political rights to those who were originally mobilized (Tilly, 2000). Although most
examples of this process have occurred simultaneously with the formation of
industrialization, Bendix (2003) further asserts that the extension of suffrage is a distinct
process.
Similar to the above view but with more nuance, Acemoglu and Robinson (2000)
argue that the decision by elites to extend suffrage is sometimes, but not always, the
chosen response to a revolutionary threat. They argue that the decision to expand the
franchise depends on the nature of the revolutionary threat and the credibility of the
promises of future redistribution (reduced inequality) by elites in the absence of
extended suffrage. They reason that if the poor are not well organized they only
represent a ‘transitory’ threat and therefore an elite response of promising future
redistributions will not be credible. They argue that this will likely result in attempted,
although likely short-lived, revolution unless the elites extend the franchise. On the
other hand, if it is believed that the masses have the capacity to maintain some form of
permanent resistance, (the threat of revolution is not transitory) there will be a higher
threat of revolution will remain. Suffrage is not granted in these cases and instead
redistribution is granted in response to the revolutionary threat.
An example they provide which illustrates their reasoning is the fact that while the
disenfranchised in nineteenth century Germany were highly organized (socialist party)
the German elites did not extend the franchise, but instead responded with the
development of the welfare state. In contrast, Britain and France did extend the
franchise during this time despite the fact that the lower classes were not as organized
(Acemoglu & Robinson, 2000). Therefore, suffrage extensions from this perspective
can be understood as a strategic decision by elites when faced with demands of
redistribution by the masses.
Political Opportunities, Desires, and Competition
While the aforementioned theories on suffrage extension focus on perceived
threats of revolution, other researchers have developed alternative theoretical
arguments to explain such extensions. Lizzeri and Persico (2004) focus on existing
divisions within the ruling political elite that may create a predisposition towards suffrage
extension. These divisions occur naturally due to the nature of the political system
wherein certain groups in the elite may benefit more with the extension of the franchise.
One example used in their paper is the 1867 Reform Act in Britain wherein the rapid
growth of cities had led to an increased demand for public goods such as roads and
sanitation. This increased demand for public goods in turn caused a majority of those in
political power to support governmental reforms that would address these issues and
that such reforms on public goods were ‘inextricably linked’ to parliamentary reforms
which included the extension of the franchise (Lizzeri & Persico, 2004).
In a similar vein, Ticchi and Vindigni (2006) draw from Machiavelli’s Discourses
and argue that suffrage extension among the masses may also be bestowed by political
elites as a type of payment or promise in return for costly acts and sacrifices needed for
current or future wars (such as the enlistment of military volunteers or women taking the
place of men in factories when they leave for war). This can be understood as distinct
from the aforementioned explanation of a threat of revolution because the threat which
motivates these voting reforms is coming from an outside source instead of the
disenfranchised themselves. Also, Ticchi and Vindigni further point out that oftentimes
the needed military action is also not so much in response to an immediate threat to the
country, but instead used for economic and political gains of the ruling elite. Therefore
gaining the cooperation and support of the masses leads to further benefits and is worth
the relinquishment of some domestic political power that occurs due to the franchise
extending (Ticchi & Vindigni, 2006).
A similar explanation for suffrage extension suggests that certain political elites
may choose to extend the franchise in order to obtain more votes or allies so they may
better pursue their political interests. Llavador and Oxoby (2005) look at how
enfranchisement and economic growth are connected. In their work they looked at
suffrage extensions in eleven countries from 1850 to World War I and found that
industrialization policies would be encouraged if a majority of political elites, who were
experiencing competition and division, extended suffrage to industrial workers. This
capitalists to foster economic growth. An example they use which illustrates this was
the suffrage extension in Germany in 1867 by Bismarck (prime minister of Prussia) who
used a conservative strategy which combined a proposal for extended suffrage with
proposals for other economic changes which were favored by the agricultural workers in
order to capture both liberal and conservative votes. Therefore, suffrage in this case
was used as a way to assist in the political elites’ larger goal of conservative economic
reforms amidst competition and conflict with other ruling political elites.
Also related to partisan motivations, McConnaughy (2005) completed an event
history analysis of voting laws in order to determine what factors were significantly
associated with the extension of suffrage to women in the United States. Her analysis
indicates that these suffrage extensions were the result of partisan politics, and
specifically this occurred through the process of ‘programmatic enfranchisement’. This
partisan process of enfranchisement involved special interest groups (organized groups
working for women’s’ suffrage) developing and maintaining coalitions with other political
party groups in order to influence party politics. This influence led to the incorporation
of women’s suffrage policies amongst other policies that were favored by party
members and therefore had a higher potential of being adopted by the party. Given the
success of this process (as shown by the empirical results of the event history analysis),
McConnaughy concludes that successful suffrage extensions in these cases can be
understood as a state level process which primarily involved the coalitions between
party politics and well-organized interest groups.
Similar to this, Banaszak (1996) contends that the success of women’s suffrage
to being simply the result of economic forces. Using interviews from activists along with
data on suffrage laws and the census, she compares the movements in the United
States and Sweden in order to understand the mechanisms behind the much earlier
success for the U.S. movement along with the extremely late adoption of suffrage rights
for women in Sweden. She concludes that specific movement tactics and value
systems were instrumental in the much earlier state level successes in the U.S. A
further examination of the relationship between women’s suffrage in the U.S. and
political opportunities was presented by McCammon, Campbell, Granberg, Mowery
(2001). After completing an event history analysis of state level suffrage data from
1866-1919, they specifically found that ‘gendered opportunities’ were instrumental in the
success of state level women’s suffrage movements. They define such opportunities as
the result of society’s changing gender relations which paved the way for those with
political power to accept the extension of political power to women.
Another theory which explores this concept of partisan competition was recently
proposed in a paper by Soumyanetra Munshi (2010) wherein she developed the
hypothesis that a higher level of partisan competition can lead to suffrage extensions
while a low level of competition (one party dominates) hinders such extensions.
Competition in this view is defined as a party having an abundance of support from the
electorate. To illustrate this argument Munshi considers the case of women’s suffrage
in the U.S., looking at how competition between Democrats and Republicans in the
Western United States was associated with their early enfranchisement of women, while
states in which one party dominated the political landscape did not extend the franchise
Finally, another recent theoretical work on the explanation of suffrage extensions
focused on women’s suffrage and the impact that the sex ratio of a state has on such
extensions. A paper by Braun and Kvasnicka (2011) examined women’s suffrage
extensions in the United States and argued that the scarcity of women (low ratio of
women to men in the state population) was a major factor in the extension of suffrage.
Their work suggests that vote extension to women was used as a strategy to attract
more women to move to these particular states.
Explanation of Suffrage Retractions
While not many of these theories discuss the disenfranchisement, or retraction of
suffrage, a few scholars have specifically focused on explaining this. Griffin (1997) has
developed a theoretical framework for explaining disenfranchisement of African
Americans during the early twentieth century by showing it as “a rational collective
action motivated by the interests of white Democrats, especially those in lowland
"black-belt" counties, in eradicating electoral opposition and establishing political, economic,
and racial hegemony”. These “black-belt” counties were defined as counties wherein the
majority of the population is African American. This theoretical framework could also
possibly be adapted in order to explain the disenfranchisement laws passed in the late
1800’s and early 1900’s which excluded non-citizen immigrants from voting. Beherens,
Uggen and Manza (2003) have extensively looked at the history, precursors, and
consequences of felon disenfranchisement in the United States. From a statistical
prison population is majority African American, the state is significantly more likely to
enact or extend these laws.
Another scholar, Richard Vallely, considerers the mechanisms behind African
American disenfranchisement in his book, The Two Reconstructions: The Struggle for
Black Enfranchisement (2004). His historical analysis finds that African American
disenfranchisement was the result of a type of “policy diffusion” wherein lawyers and
journalists would travel from states that had succeeded with disenfranchisement to
other states that had yet to enact such legislation and work to further efforts of making
the electorate white only. He further notes that this process was perpetuated by both
Republicans and Democrats in many states.
Finally, a paper written by Monica Varsanyi (2005) details the retraction of voting
rights for noncitizens in the U.S. and also provides an account of contemporary
attempts that have been made to reinstate voting rights for noncitizens. Non-citizen
voting is presented in this article as a case study which is then used to describe how
immigration has shaped boundaries in the United States with respect to citizenship and
voting. By looking at the complete history of the retractions and extensions of suffrage
to noncitizens Varsanyi shows how a process of territorialization occurred from the
1700’s to the mid 1960’s wherein the voting population slowly changed to match those
living in the territory, followed by a period of deterritorialization, wherein continued
immigration and lack of voting rights for non-citizens lead to the voting population no
longer encompassing all those in the territory. This trend towards a growing population
of noncitizens is shown by the Varsanyi to present a type of ‘democratic challenge’
Current Study
This paper adds to the current scholarship on suffrage by providing a new, more
comprehensive measure for suffrage in the United States in the first half of the twentieth
century which will allow for inclusion of extensions that occurred during that time as well
as suffrage retractions such as poll taxes, literacy, felon disenfranchisement, and
citizenship. Using this new measure, this project will also then be able to show
longitudinal trajectories of each state’s suffrage expansions, and retractions, during the
first half of the twentieth century. Past research on suffrage in the United States has
not included many of the components of this suffrage measure and by adding these
factors a more complete picture of suffrage for each state over the course of this time
period will be presented. Also, this new measure will be used to extend the analysis of
McDonald and Popkin (2001) on the state level voter turnout rates in the U.S. to the first
half of the twentieth century.
The second part of this paper will use these suffrage trajectories to perform a
regression analysis in order to test some of the theoretical explanations that have been
proposed for the expansion and contraction of voting rights. One hypothesis that will be
examined in this fashion is the extent to which the economic development level in a
state may be associated with the rate of suffrage extensions. Based on the findings of
Llavador and Oxoby (2005) mentioned earlier, it is hypothesized that economic
development would be positively associated with the extent of suffrage and its growth
rate. Another hypothesis that will be tested is that the sex ratio is positively related to
suffrage extensions as was suggested by the work of Braun and Kvasnicka (2011). The
level of party competition is a major factor in suffrage extensions. Finally, the suffrage
retraction hypothesis of Griffin (1997) and Beherens, et al. (2003) will be tested which
postulates that higher concentrations of African Americans will be related to higher
III. Data & Methods
Initial Dataset
Using a similar method to that of Paxton, et al. (2003) a suffrage percentage
measure, based on the ratio of adults who could vote over the total population of adults,
was calculated for each state during each census year (48 total since Hawaii and
Alaska were not yet admitted to the Union during this time period), beginning with 1900
and ending at 1950. For these data, in order to remain consistent with the Paxton, et
al. (2003) method, the adult population included all people in the state that were 20
years or older. The denominator for each score was therefore the entire state adult
population, as recorded by the US Census Bureau, and the numerator began with this
same number and then deductions were made for each voting restriction according to
the appropriate state voting laws for participating in national elections (such as electing
President or a Congressional representative). Information on these laws for each state
and for each census year were obtained from 2 major sources, A Statistical History of
the American Electorate (Rusk, 2001) and The Right to Vote: The Contested History of
Democracy in the United States (Keyssar, 2000).
Possible deductions included age (all 20 year olds were deducted since every
state required a voter to be at least 21 years of age), women, the illiterate portion of the
population, non-citizens, poll taxes, and felon disenfranchisement. Demographic data
deductions was obtained from an ICPSR dataset (Haines, 2010) which included state
level historical demographic data from the U.S. Census Bureau. Since exact numbers
on those affected by felon disenfranchisement and poll taxes could not be obtained, the
standard deductions used by Paxton, et al. (2003) were used for these laws (.02% for
poll tax and .005% for felon disenfranchisement). This combined dataset, once
complete, thus provided individual longitudinal trajectories of suffrage percentages for
each state from 1900 to 1950. Finally, for the calculation of voter turnout rates for the
time period also required the use of political data, specifically the total number of votes
cast in each state for the presidential elections of 1900, 1912, 1920, 1932, 1940, and
1952 (since no presidential elections were held in the census years of 1910, 1930, or
1950 the nearest elections after each census year were used instead). This voting
data was obtained from another ICPSR dataset which includes state level voting data
from this time period (Burnham & Flanigan, 1992).
Analytical Strategy for Longitudinal Trajectories
Prior exploratory work with these data indicated that the best way to analyze
these longitudinal trajectories was by using a linear growth model that also included a
dummy variable to indicate whether and when a law allowing women’s suffrage was
present in each state. The trajectories were estimated with an OLS regression of the
suffrage percent on year and the dummy variable for the existence of female suffrage in
that year, doing this for each state separately. This created estimates of the intercept of
suffrage, a growth factor (coefficient for the impact of time) for each state, and a
suffrage for each state in each year. The first level of this model is illustrated by the
following equation:
y
it= α
i+ β
1iλ
t+ β
2iD
t+ ε
itwhere α represents the intercept for state i, β1 represents the coefficient for state i
associated with time trend variable λ at time t, β2 represents the coefficient for state i
associated with the dummy variable, Dt , for the presence of a women’s suffrage law at
time t, and ε represents the residual error term for state i at time t. These estimates of
the intercept and growth parameters were then used to create a new data set that
allowed them to each be analyzed as outcome variables.
The second level of the model then enabled theoretically motivated variables to
be tested to see if they had a significant influence on the intercept or growth
parameters. This specified by taking the coefficient estimates obtained in the first level
and treating them as dependent variables in the following equations:
α
i=
Π
α+ Γ
αX
αi +ε
αiβ
1i= Π
β1+ Γ
β1X
β1i +ε
β1iβ
2i= Π
β2+ Γ
β2X
β2i +ε
β2iThe first equation illustrated above is used to predict α, the individual intercept
values for each state i that were obtained from the first level. The Πα term represents
the intercept value for this equation; Xα represents a vector of explanatory variables for
coefficients for these explanatory variables. Finally, the εα term represents the residual
error term of this equation for state i.
The second equation illustrated above is used to predict β1 , the individual time trend
(growth factor) coefficient values for each state i that were obtained from the first level.
The Πβ1 term represents the intercept value for this equation; Xβ1 represents a vector of
explanatory variables for state i, which are used to predict the dependent variable, and
Γβ1 term represents a vector of the estimated coefficients for these explanatory
variables. Finally, the εβ1 term represents the residual error term of this equation for
state i.
The third equation illustrated above is used to predict β2, the individual coefficient
values associated with the dummy variable of the first level equation (Dt, the indication
of the presence of a women’s suffrage law for each state i) which are the dependent
variable observations in this equation. The Πβ2 term represents the intercept value for
this equation; Xβ2 represents a vector of explanatory variables for state i, which are used
to predict the dependent variable, and Γβ2 term represents a vector of the estimated
coefficients for these explanatory variables. Finally, the εβ2 term represents the residual
error term of this equation for state i.
These second level regression results can then be used to help provide some
insight into which factors may predict the starting point of a state’s suffrage measure,
the growth factor, and the impact of women’s suffrage on the overall suffrage measure
and thus allow for the testing of the several hypotheses mentioned earlier on
experience of state level voting rights changes in the United States during the first half
of the twentieth century.
Independent Variables for Longitudinal Trajectories
For the scope of this study, theoretically motivated independent variables were
collected based on data availability. Only one time point, 1900, was used for the
purpose of this study, however further analyses could be completed in the future which
may look at how time varying independent variables impact these trajectories.
The log of the per capita manufacturing output in 1900, obtained from ICPSR
(Haines, 2010), was used as a measure for economic development which is a variable
motivated by the findings of Llavador and Oxoby (2005) mentioned earlier. Specifically,
this measure is the log of the dollar value of the manufacturing output per capita for the
year 1900. It was hypothesized that this variable would be positively associated with
the initial starting point (intercept) of suffrage and the growth rate (slope). A second
variable in the analysis is the proportion of the population in the state that was female in
1900 and was used as a measure for the sex ratio as was suggested by the work of
Braun and Kvasnicka (2011). Based on their work it was hypothesized that this variable
would be negatively related to initial levels of suffrage (intercept), the growth rate
(slope), and that it would be positively related to the impact of women’s suffrage on the
state’s longitudinal trajectory.
A variable measuring political party domination was used to test the hypothesis
suggested by Munshi (2010) which predicted that the level of party competition is a
major factor in suffrage extensions. This variable was obtained using an ICPSR dataset
measure was constructed using the percentage of the presidential vote for the party that
had the highest percentage of votes for that state, thereby giving states with high levels
of party competition smaller scores and states with high levels of party domination
higher scores. It was therefore hypothesized, based on Munshi’s work, that higher
levels of political domination would be negatively associated with the initial trajectory
level (intercept) and the growth factor (slope).
Finally, in order to test the suffrage retraction hypothesis of Griffin (1997) and
Behrens et al. (2003), which postulated that higher concentrations of African Americans
are related to higher suffrage retractions (and thus lower suffrage rates), a variable was
used to indicate the magnitude of ‘black-belt’ counties in a state which is a term used by
Griffin (1997). This is a therefore a measure of the concentration of such counties in a
state (proportion) for the year 1900, and was collected from the US Census report of
that year which has county level racial population data. Given both Griffin’s and
Behrens’ et al., it was predicted that the amount of black-belt counties in a state would
be negatively related to the initial starting point of the suffrage rate (intercept) and the
IV. Results
Descriptive Analysis of Overall State Suffrage Levels
The descriptive statistics for the overall means of the suffrage measure for each
census year is provided in Table 1. For 1900, the first year in the data set, the mean
suffrage is just under one half, 49.2%. Louisiana, the state with the lowest suffrage for
1900 had 28% while Colorado, the highest had 92.1%. This trend changes
considerably by 1920, which can be understood as the result of the passage of the
Nineteenth Amendment requiring all states to allow women to vote (with the exception
of Arkansas, Georgia, Mississippi and South Carolina which did not implement the
women’s suffrage law in time for the 1920 election). Although many states, especially
those in the West, had implemented women’s suffrage laws prior to 1920, about half did
not do so until the Nineteenth Amendment to the U.S. Constitution passed forbidding
states to use gender as a means of disqualifying voters. The complete dataset the
suffrage percentages by year and state can be found in Appendix A.
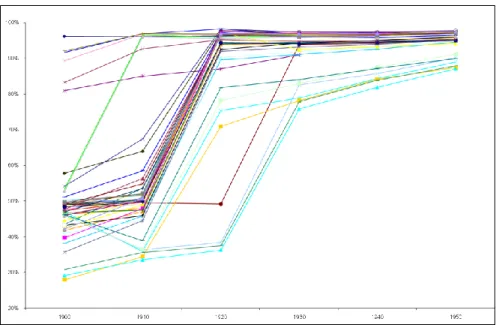
An examination of the individual trajectories shows that in addition to the
minimum and maximum values noted above, there is also quite a bit of variation for the
starting points for many of the states in the analysis as well as the trajectories over the
time period (see Figure 1). This can also be seen by looking at the standard deviations
in Table 1 for the first 3 time points and comparing them to the remaining time points- a
Table 1. Summary Statistics of Suffrage Levels in the U.S., 1900-1950
Year Mean S.D. Min Max
1900 49.2% 0.14 28.0% 92.1%
1910 53.7% 0.16 33.5% 97.0%
1920 89.4% 0.16 36.3% 98.2%
1930 93.2% 0.06 75.8% 97.4%
1940 94.2% 0.04 81.9% 97.4%
1950 95.4% 0.03 87.1% 97.9%
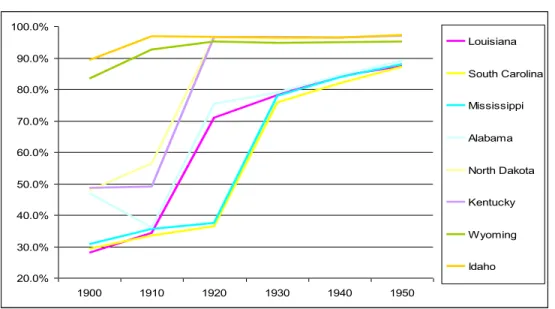
In looking at just a few select states (Figure 2) some regional variation can be
seen in which Southern states, such as Louisiana and Mississippi, have a low starting
point and slower trajectory compared with Western, states such as Idaho and Wyoming,
which start higher and quickly reach an even higher level of suffrage. Therefore the
overall trends are similar across the 48 states in the sample; however the intercepts and
slopes vary quite a bit. Figure 3 below visually illustrates the mean suffrage level over
all states for each time period, showing the average longitudinal trajectory.
20.0% 30.0% 40.0% 50.0% 60.0% 70.0% 80.0% 90.0% 100.0%
1900 1910 1920 1930 1940 1950
Louisiana
South Carolina
Mississippi
Alabama
North Dakota
Kentucky
Wyoming
Idaho
Figure 2. Select States with Different Types of Trajectories
Figure 3. Trajectory of the Average Suffrage Level in the U.S., 1900-1950
Voter Turnout Rates Using Suffrage Measure
As discussed in the above literature review, another important application for
state level suffrage data is in the computation of voter turnout rates. State level voter
turnout measures for the presidential elections were therefore be calculated using the
becomes the denominator for a turnout measure. The numerator for this voter turnout
rate is the number of votes cast in the state for the specified (presidential) election.
McDonald and Popkin (2001) presented a similar method for calculating more exact
figures for voter turnout in elections during the 1948-2000 period. Figures 4 and 5 below
graphically present some of the findings in regards to these voter turnout rates. In
looking at the overall U.S. turnout rate we see that in 1900 turnout was at a high of
around 74% of the eligible electorate. However, contrary to what McDonald and
Popkin (2001) observed for the 1948-2000 time period, as time went on during the first
half of the twentieth century the size of the eligible electorate increased while the
number of votes cast did not rise at the same rate thereby resulting in a decline in the
voter turnout rate. The turnout rate reaches its lowest point in the election in 1920
(52%) when the eligible electorate had just increased substantially due to multiple states
passing women’s suffrage laws.
This downward trend ends however after 1920 wherein we see a slow increase in voter
turnout rates for the subsequent elections, however they fail to return to the highpoint of
74%. Figure 5 below presents state level turnout rates for the same select states that
were examined above in Figure 2. Similar to the examination of suffrage in Figure 2,
we see a regional variation in the longitudinal trajectory of voter turnout rates for the
same time period. Specifically, states in the Southern region of the U.S. (Alabama,
Louisiana, Mississippi, and South Carolina) have much lower turnout rates compared to
those in the West (Idaho and Wyoming) and Midwest (Kentucky and North Dakota) as
well as the average U.S. turnout rate (Figure 4). This may be at least in part related to
voter intimidation tactics that were being used in the South during this time period to
discourage black voters from participating in the political process (Griffin, 1997). In
regards to the directions of the trajectories for these turnout rates there is not a clear
regional distinction with some states having decreasing turnout rates for most of the
period (Kentucky for the entire period) while others decreased for the first few elections
but then increased in subsequent elections similar to the national average.
Analysis of Longitudinal State Suffrage Trajectories
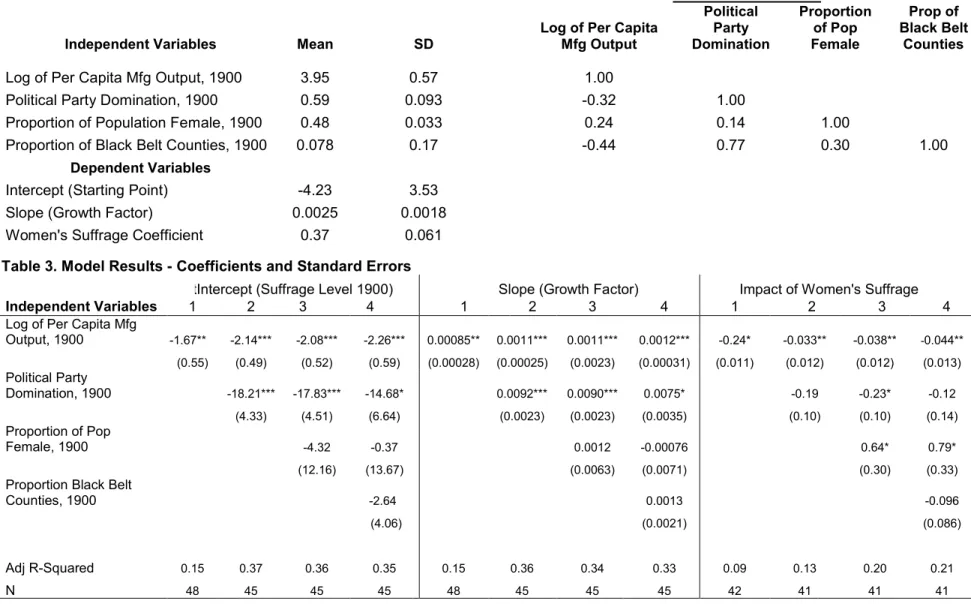
The descriptive statistics and bivariate correlations for the independent variables
used in the analysis of the longitudinal trajectories are below in Table 2. The mean for
the log of per capita manufacturing output, averaged across all states, is 3.95 with a
standard deviation of 0.57. The mean for the proportion of the population that was
female for all states is 0.48 with a standard deviation of 0.033. The mean for political
party domination was 0.59 with a standard deviation of 0.093 indicating that on average,
states did have one political party dominating slightly in the presidential election of
1900. Finally, for the variable of the proportion of black belt counties the mean is 0.078
with a standard deviation of 0.17 indicating that on average states only had around 8%
of counties with a majority African American population in 1900.
In regards to the bivariate correlations for these variables also shown in Table 2,
the log of the per capita manufacturing output has a slight negative correlation with both
the proportion of females in the state’s population (-0.32) and the proportion of black
belt counties in a state (-0.44), while being slightly positively correlated with political
party domination (0.24). Political domination is very slightly positively correlated with
the proportion of the population that is female, and is strongly and positively correlated
with the proportion of black belt counties in a state. This indicates that states which
had higher levels of political domination also had larger numbers of counties with
majority of African Americans. Finally, the proportion of females in the state was found
to have a moderate, positive correlation with black belt counties in the state (0.30).
The descriptive statistics for the estimates of the first stage OLS are also below
estimates of a linear growth model of suffrage on year for each state individually. The
estimates therefore include an intercept (starting point) for each state, a growth factor
(coefficient for the impact of time) for each state, and a coefficient for a dummy variable
that accounts for the presence or absence of women’s suffrage for each state in each
year. The mean intercept is -4.23 with a standard deviation of 3.53. The mean for the
growth factor is 0.0025 with a standard deviation of 0.0018, and the mean coefficient for
the women’s suffrage dummy variable is 0.37 with a standard deviation of 0.061.
The second stage regression model results which examine the impact of the
independent variables on predicting each of the dependent variables are listed in Table
3. For the first model, the independent variable for the log of per capita manufacturing
output was used to predict the intercepts for the state trajectories of suffrage. The
results show the coefficient associated with this variable is -1.67 and it is significant at
the p≤ .01level, showing some initial support for the hypothesis that economic
development is related to suffrage, however the direction of this relationship is the
opposite of what would be expected, higher levels of manufacturing output are related
to lower initial levels of suffrage. In the second model predicting the intercept, the
variable for political party domination is added as an explanatory variable. It is
important to note that the sample size for this model, and all subsequent models that
include the political domination variable, is 45 instead of 48 because 3 states did not
have data for this variable (Arizona, New Mexico, and Oklahoma) due to the fact that
30
Table 2. Descriptive Statistics of Variables and Bivariate Correlations
Bivariate Correlations
Independent Variables Mean SD
Log of Per Capita Mfg Output Political Party Domination Proportion of Pop Female Prop of Black Belt Counties
Log of Per Capita Mfg Output, 1900 3.95 0.57 1.00
Political Party Domination, 1900 0.59 0.093 -0.32 1.00
Proportion of Population Female, 1900 0.48 0.033 0.24 0.14 1.00
Proportion of Black Belt Counties, 1900 0.078 0.17 -0.44 0.77 0.30 1.00
Dependent Variables
Intercept (Starting Point) -4.23 3.53
Slope (Growth Factor) 0.0025 0.0018
Women's Suffrage Coefficient 0.37 0.061
Table 3. Model Results - Coefficients and Standard Errors
IntIntercept (Suffrage Level 1900) Slope (Growth Factor) Impact of Women's Suffrage
Independent Variables 1 2 3 4 1 2 3 4 1 2 3 4
Log of Per Capita Mfg
Output, 1900 -1.67** -2.14*** -2.08*** -2.26*** 0.00085** 0.0011*** 0.0011*** 0.0012*** -0.24* -0.033** -0.038** -0.044** (0.55) (0.49) (0.52) (0.59) (0.00028) (0.00025) (0.0023) (0.00031) (0.011) (0.012) (0.012) (0.013)
Political Party
Domination, 1900 -18.21*** -17.83*** -14.68* 0.0092*** 0.0090*** 0.0075* -0.19 -0.23* -0.12 (4.33) (4.51) (6.64) (0.0023) (0.0023) (0.0035) (0.10) (0.10) (0.14)
Proportion of Pop
Female, 1900 -4.32 -0.37 0.0012 -0.00076 0.64* 0.79*
(12.16) (13.67) (0.0063) (0.0071) (0.30) (0.33)
Proportion Black Belt
Counties, 1900 -2.64 0.0013 -0.096
(4.06) (0.0021) (0.086)
Adj R-Squared 0.15 0.37 0.36 0.35 0.15 0.36 0.34 0.33 0.09 0.13 0.20 0.21
N 48 45 45 45 48 45 45 45 42 41 41 41
In the results for this model, the log of per capita manufacturing output is still found to
significantly predict the intercept (starting level) of suffrage in this model, with a
coefficient of -2.14. The level of political party domination is also found to significantly
predict (at the p≤ .01level) the intercept with a coefficient of -18.21 which also suggests
some initial support for the hypothesis of Munshi (2010) which predicts that higher
levels of political domination would be negatively associated with suffrage.
The third intercept model adds in the explanatory variable of the proportion of the
population that was female in each state which was motivated by the work of Braun and
Kvasnicka (2011). The model results show the coefficient to be -4.32 which fits the
directionality of the hypothesis (that it would be negatively related to initial suffrage
levels), however it was not significant result so there this does not provide sufficient
evidence supporting it in this model. Both the log of per capita manufacturing output
and political dominance however still remained significant in this model. Finally, the
fourth model for the intercept adds in the variable for proportion of ‘black belt’ counties
in each state, again referring to counties that have a majority of African Americans in
the population as described by Griffin (1997). The model results show this variable to
have a coefficient of -2.64 which also fits the directionality of the hypothesis (that the
proportion of black belt counties would be negatively related to the initial suffrage level),
however, like the proportion of the population of women, it was also not a significant
result, indicating there is not sufficient support for this theory in the data as it is
modeled. The adjusted r-squared value for this final model is 0.35 indicating that about
35% of the variance in the estimated intercept values is being explained by these
In looking at the results in the middle column in Table 3, the models predicting
the slope of the longitudinal suffrage trajectories (growth factor) show a very similar
pattern to the first set of models in regards to significance, however the directionality of
these relationships has changed. In the first model which just looks at the log of per
capita manufacturing output with predicting the growth factor the coefficient is 0.00085,
again is significant at the at the p≤ .01 level. This relationship, unlike the intercept
model, is positive indicating that higher levels of manufacturing output are predictive of
higher levels of suffrage growth, which coincides with the hypothesis presented by
Llavador and Oxoby (2005) linking suffrage levels to economic development. In the
second model, political party dominance is added and it is again found to be a
significant predictor of suffrage, this time predicting growth instead of the initial level.
The coefficient for this variable is 0.0092 indicating a positive relationship with suffrage
unlike the previous models where it had a negative relationship to the intercept
dependent variable. The log of per capita manufacturing output also remains
significantly predictive of the growth factor in this model.
In the third model predicting the growth factor, the proportion of the population
that is female is added and again not found to be a significant predictor. The log of the
per capita manufacturing output and the political dominance variables however are still
found to be significant and positively related to the growth factor. Finally, in the fourth
model predicting the growth factor, the proportion of black belt counties is added and is
again not found to be significantly predictive of the dependent variable suggesting there
model is 0.33 indicating that about 33% of the variance in the growth factor values is
being explained by these independent variables.
The last 4 models presented in Table 3 show how the independent variables are
related to the final aspect of the suffrage growth models, the dummy variable for the
impact of women’s suffrage. It is important to note that these models have a smaller
sample size of 42 and 41 due to the fact that the Western states which legalized
women’s suffrage prior to 1900 (Utah, Idaho, Wyoming, and Colorado) did not have
estimates for the impact since women’s suffrage was not enacted during the time period
for these trajectories. Similarly, Arizona and New Mexico also had women’s suffrage
when they joined the Union so there is no factor for this in their trajectories either.
In looking at the results for the first model, we find that similar to the first set of
models predicting the intercept, the log of per capita manufacturing is significant and is
negatively related to the impact of women’s suffrage with a coefficient of -0.24. In the
second model political party domination is added but it is not found to be significantly
predictive of the women’s suffrage impact. The log of the per capita manufacturing
output still remains to be significant in this model. In the third model the proportion of
the population that was female is added to the model and this time it is found to be
significantly related to the impact of women’s suffrage in the growth model and has a
positive relationship with a coefficient of 0.64. This supports the hypothesis of Braun
and Kvasnicka (2011) that the amount of women in a state was related to women’s
suffrage laws. Also in this model the log of the per capita of manufacturing output
remains significant and the political party dominance variable also is now significant with
Finally in the last model the proportion of black belt counties is added as an
explanatory variable however it is not found to be significant. The proportion of women
in the population and log of per capita manufacturing however remain significant in this
model providing some evidence for these theories. The adjusted r-squared value for
this final model is 0.21 indicating that about 21% of the variance in the impact of the
V. Discussion and Conclusion
This paper has created a new measure of suffrage for each state in the U.S. from
1900 to 1950 that may be used in future quantitative analyses concerned with
incorporating the concept of suffrage. One such analysis was also presented to show
how this new measure might be utilized. The two step OLS regression results
incorporated several variables motivated by past research on suffrage extensions and
restrictions in order to examine if these explanations of the mechanisms for changes in
voting rights were related to the observed longitudinal trajectories of suffrage. The
results of this analysis provide mixed support for the theories examined. Llavador and
Oxoby (2005) argue that suffrage extensions are positively related to the level of
economic development in the region. While the variable used to operationalize this
theory (the log of per capita manufacturing output) was consistently significant in all
models, the direction of the relationship was not entirely consistent with what the theory
would predict.
Specifically, the coefficient for this variable in the intercept model was negative,
indicating that higher levels of per capita manufacturing output (logged) predicted lower
levels of initial suffrage in 1900. The theory presented by Llavador and Oxoby (2005)
however would suggest the opposite relationship, that higher levels of per capita
manufacturing output would be related to higher levels of suffrage. One explanation of
this might be that since this theory focuses on the importance of economic development
to the growth factor may be a better test of this theory; in fact when we look at how the
log of per capita manufacturing output relates to the growth factor we do see a
significant positive relationship just as the theory would predict. Also, lower levels of
initial suffrage in 1900 in turn mean there would more opportunity for future suffrage
extensions; therefore it might be the case that there is a certain threshold for economic
development and only once this threshold is reached will higher levels of output result in
higher levels of suffrage.
In regards to the theory of suffrage extensions suggested by Munshi (2010)
which predicted that higher levels of party competition are positively related to suffrage
extensions, and thus party dominance would be negatively related to such extensions,
results from this analysis were also mixed. While political party domination was found
to be significantly related to both the intercept and the slope for the suffrage trajectories,
the direction of the relationship was not as was predicted for both cases. Specifically,
while the findings were consistent with the theory for the intercept models (higher levels
of political domination were associated with lower levels of starting points for suffrage),
for the growth factor models the direction of the relationship was found to be the
opposite of what was initially predicted by the theory. Higher levels of political
domination actually predicted higher growth of suffrage. This again might suggest that
the connection between political dominance and suffrage extensions, while significant,
might be more complex than the simple negative relationship predicted; it may be the
case that states with lower levels of initial suffrage could be impacted differently by
For the variable of the proportion of the population that was female which was
used to test the theory of the sex ratio being related to suffrage extensions, suggested
by Braun and Kvasnicka (2011), this analysis did not show any evidence supporting it
for the intercept models or the growth factor models. The models which examined the
impact of women’s suffrage on the trajectories did show this variable to be significant
however, and it was found to be positively related as was predicted. This does suggest
that having a higher proportion of women in a state was predictive of women’s suffrage
having a larger impact on the overall trajectory of suffrage, although this would be
expected given a state with a larger percentage of women would by definition benefit
more from women’s suffrage being enacted so it is not an incredibly reliable test for this
theory. Finally, in regards to the theoretical explanation for the suffrage retraction
hypothesis of Griffin (1997) and Beherens et al. (2003), which postulated that higher
concentrations of African Americans are related to higher suffrage retractions (and thus
lower suffrage rates), no statistical evidence in this analysis was found.
In conclusion, this preliminary analysis shows some support for several of the
theories reviewed which attempt to provide explanations for the mechanisms behind
suffrage extensions. While certain limitations, such as the lack of time varying
independent variables in the second step regression, may have prevented this analysis
from providing a more complex tests of these theoretical explanations for suffrage, this
work nonetheless does provide an important first step in utilizing this new suffrage
measure to further understand what forces might be at play in the important process of
extending and retracting the right to vote in the United States during the first half of the
created from it can be employed in other analyses of democracy, voting, and inequality
wherein the right to vote is an important component, thus providing a useful contribution
State 1900 1910 1920 1930 1940 1950
Alabama 47.0% 35.6% 75.0% 78.6% 84.9% 88.9%
Arizona - - 59.0% 83.1% 80.6% 87.2%
Arkansas 49.0% 49.4% 49.1% 93.7% 94.1% 95.0%
California 43.5% 45.8% 82.3% 86.0% 87.3% 91.4%
Colorado 91.7% 88.7% 91.7% 93.5% 94.3% 95.7%
Connecticut 38.2% 34.7% 67.7% 71.8% 82.5% 90.2%
Delaware 40.9% 41.6% 84.0% 87.8% 91.2% 93.8%
Florida 49.0% 49.6% 91.7% 92.1% 95.0% 96.1%
Georgia 46.0% 36.2% 38.2% 82.4% 85.7% 90.0%
Idaho 89.4% 90.6% 92.6% 93.6% 94.9% 96.3%
Illinois 47.8% 50.8% 87.1% 89.3% 93.2% 96.0%
Indiana 48.6% 48.7% 95.2% 94.7% 95.8% 96.8%
Iowa 49.4% 48.4% 94.1% 95.0% 96.1% 96.9%
Kansas 50.2% 50.4% 94.0% 95.6% 96.1% 96.9%
Kentucky 48.5% 48.7% 96.1% 96.3% 96.3% 96.8%
Louisiana 28.0% 33.2% 68.8% 77.1% 83.4% 87.0%
Maine 41.8% 41.8% 84.2% 84.1% 89.0% 92.6%
Maryland 46.3% 45.7% 92.3% 93.8% 94.8% 96.1%
Massachusetts 35.7% 33.3% 70.8% 74.9% 85.3% 91.4%
Michigan 45.9% 45.0% 84.6% 84.7% 91.5% 95.5%
Minnesota 46.9% 46.5% 88.5% 92.4% 94.8% 96.4%
Mississippi 30.8% 35.5% 37.4% 77.7% 84.0% 87.8%
Missouri 49.1% 48.9% 95.2% 95.2% 96.0% 97.1%
Montana 57.8% 54.2% 90.8% 92.1% 94.6% 96.3%
Nebraska 49.3% 50.3% 91.9% 94.1% 95.5% 96.7%
Nevada 54.2% 57.7% 86.1% 89.4% 92.5% 95.2%
New Hampshire 43.2% 38.5% 78.7% 81.5% 88.5% 92.9%
New Jersey 43.3% 43.4% 79.7% 89.2% 90.6% 94.7%
New Mexico - - 88.5% 95.0% 93.6% 94.9%
New York 42.4% 38.5% 78.2% 76.7% 84.3% 90.1%
North Carolina 46.2% 36.4% 78.0% 82.8% 87.9% 91.0%
North Dakota 47.7% 49.6% 90.4% 92.1% 94.6% 96.1%
Ohio 47.5% 45.3% 88.9% 91.1% 93.9% 96.3%
Oklahoma - 52.7% 95.4% 95.7% 96.2% 96.9%
Oregon 51.1% 54.5% 90.4% 90.0% 93.1% 95.0%
Pennsylvania 44.5% 41.3% 84.6% 89.3% 92.8% 96.0%
Rhode Island 39.7% 37.0% 78.1% 81.1% 89.0% 93.8%
South Carolina 29.2% 33.4% 36.2% 75.6% 82.2% 86.9%
South Dakota 49.1% 53.5% 92.7% 94.2% 95.5% 96.5%
Tennessee 46.8% 47.2% 94.2% 94.0% 94.3% 94.8%
Texas 48.4% 48.0% 87.9% 93.5% 91.3% 92.4%
Utah 92.1% 85.3% 89.7% 92.1% 94.4% 95.7%
Vermont 46.0% 45.4% 90.3% 88.1% 92.8% 95.1%
Virginia 46.2% 38.4% 81.0% 83.6% 87.5% 89.6%
Washington 52.7% 85.4% 86.3% 88.1% 91.5% 93.8%
West Virginia 49.6% 48.5% 91.9% 93.4% 94.8% 96.3%
Wisconsin 42.2% 44.1% 87.1% 93.0% 94.4% 96.6%
Wyoming 83.3% 80.4% 87.4% 90.9% 92.5% 93.9%
References
Acemoglu, Daron and James Robinson. 2000. “Why Did the West Extend the
Franchise? Democracy, Inequality, and Growth in Historical Perspective”, Quarterly Journal of Economics, 115: 1167-99.
Banaszak, Lee Ann. 1996. Why Movements Succeed or Fail: Opportunity, Culture and the Struggle for Woman Suffrage. Princeton, NJ: Princeton University Press.
Behrens, Angela, Christopher Uggen and Jeff Manza. 2003. "Ballot Manipulation and the "Menace of Negro Domination": Racial Threat and Felon Disenfranchisement in the United States, 1850-2002." American Journal of Sociology 109(3):559-605.
Bendix, Reinhard. 2003. Nation-building & Citizenship: Studies of our Changing Social Order. Transaction Publishers, Rutgers, NJ.
Boli, John and John Meyer. 1980. “Constitutions as Ideology” American Sociological Review, 45:525-7.
Bollen, K.A. 1998. Cross National Indicators of Liberal Democracy, 1950-1990. (NSF Funded Project. ICPSR Study No. 2532.
Bollen, Kenneth. 2001. “Cross-National Indicators of Liberal Democracy, 1950-1990” [Computer file]. 2nd ICPSR version. Chapel Hill, NC: University of North Carolina [producer], 1998. Ann Arbor,MI: Inter-university Consortium for Political and Social Research [distributor].
Brenner, Saul and Nicholas J. Caste. 2003. "Granting the Suffrage to Felons in Prison." Journal of Social Philosophy 34(2):228-243.
Burnham, W. Dean and William Flanigan. 1992. State-Level Presidential Election Data for the United States, 1824-1972 [Computer file]. ICPSR00019-v1. Ann Arboro, MI: Inter-University Consortium for Political and Social Research [distributor].
Caraway, Teri L. 2004. "Inclusion and Democratization: Class, Gender, Race, and the Extension of Suffrage." Comparative Politics 36(4):443-460.
David, Paul T., and William Claggett. 2008. Party Strength in the United States: 1872-1996 [Computer file]. Compiled by Paul T. David, University of Virginia, and William Claggett, Florida State University. ICPSR06895-v1. Ann Arbor, MI: Inter-university Consortium for Political and Social Research [producer], 1998. Ann Arbor, MI: Inter-university Consortium for Political and Social Research [distributor].
Griffin, Larry J. 1997. “Comparative-historical analysis and scientific inference.” Historical Methods 30(1):13-28.
Haines, Michael R., & Inter-university Consortium for Political & Social Research. 2010. Historical, Demographic, Economic, and Social Data: The United States, 1790-2002 [Computer file]. ICPSR02896-v3. Ann Arbor, MI: Inter-university Consortium for Political and Social Research [distributor]. doi:10.3886/ICPSR02896.v3.
Halliday, Terence C. and Bruce G. Carruthers. 2007. “The Recursivity of Law: Global Norm
Making and National Lawmaking in the Globalization of Corporate Insolvency Regimes.” American Journal of Sociology 112 (4): 1135-1202.
Harper-Ho, Virginia. 2000. “Noncitizen Voting Rights: The History, the Law, and Current Prospects for Change.” Law and Inequality 18:271-322.
Jacobson, David. 1997. Rights Across Borders: Immigration and the Decline of Citizenship. Baltimore and London: The John Hopkins University Press.