THREE ESSAYS ON THE EMPLOYMENT EFFECTS OF POLICY DECISIONS
Paul C. Treacy
A dissertation submitted to the faculty at the University of North Carolina at Chapel Hill in partial fulfillment of the requirements of the degree of Doctor of Philosophy in the Department
of Public Policy.
Chapel Hill 2019
ABSTRACT
Paul C. Treacy: THREE ESSAYS ON THE EMPLOYMENT EFFECTS OF POLICY DECISIONS
(Under the direction of Jeremy Moulton and Christine Durrance)
Public policy decisions designed to address a public need frequently have secondary effects, especially on hard-to-predict employment outcomes. In this dissertation, I study three laws or groups of laws and the effects they have on labor-related outcomes.
Economic theory proposes that laws increasing the minimum wage should increase employment discrimination. Employers theoretically have longer queues of job applicants, allowing them to exercise their biases in hiring decisions. In Chapter 1, I exploit the wide variation in state minimum wage rates since 2005 to estimate the effect on discrimination, using 4.8 million allegations from publicly unavailable administrative data provided by the Equal Opportunity Employment Commission. I find overall discrimination allegations do increase with minimum wage changes. Higher rates of discrimination filings are driven by private sector firms; by allegations of firings and promotions; by alleged violations of Title VII of the Civil Rights Act and the Americans with Disabilities Act; and in states where discrimination reporting is already common. Consistent with human capital theory, age discrimination allegations do not statistically significantly increase following minimum wage changes.
new method of estimating labor supply elasticity. Typical measures of labor supply elasticity focus only on workers in existing jobs, a somewhat limited approach that is conditional on the decisions of an employer. Since the labor force includes active job seekers, not just workers, it more purely reflects individuals’ willingness to work. Using 14 million observations from the Bureau of Labor Statistics’ (BLS) Current Population Survey, I estimate an overall elasticity statistically indistinguishable from 0, but a great deal of heterogeneity across different levels of human capital. As predicted by theory, younger workers with lower levels of education drop out of the labor force, perhaps discouraged by new difficulties finding employment. However, I find a positive, statistically significant elasticity among workers with more human capital.
ACKNOWLEDGEMENTS
I was fortunate to have not one but two close advisors during the pursuit of my doctorate, and equally fortunate that they were great at their jobs. A sincere and enthusiastic thank-you to Christine Durrance and Jeremy Moulton (also my Chair), for your generosity of time, candor, and academic and emotional support. When I consider this accomplishment in the future, the two of you will no doubt be top of mind.
Thank you also to committee members, Dan Gitterman, Klara Peter, and John Scott for a wealth of thoughtful guidance, from granular-level suggestions to cruising-altitude, fundamental improvements in my approaches.
Thank you to Pam Jagger and Doug MacKay who extended early and valuable research opportunities to me along with the confidence to publish.
TABLE OF CONTENTS
LIST OF TABLES ... viii
LIST OF FIGURES... x
Chapter 1: Do Employers Discriminate More When Minimum Wages Increase? ... 1
Abstract ... 1
Introduction ... 2
Background ... 5
Literature and theoretical underpinning ... 7
Data ... 13
Variables and Methods... 15
Hypotheses ... 21
Results ... 23
Extensions and robustness checks ... 30
Discussion and Conclusion ... 33
Tables ... 35
Figures ... 45
Chapter 2: Minimum Wages and Willingness to Work: A New Method of Measuring Labor Supply Elasticity ... 48
Abstract ... 48
Introduction ... 49
Data Sources and Variables ... 59
Empirical Strategy ... 62
Results ... 65
Discussion and Conclusion ... 69
Tables ... 71
Figures ... 78
Chapter 3: Does Expanding Medicaid Expand Health Care Employment? The Job Growth Effects of 17 Million New Consumers ... 83
Abstract ... 83
Introduction ... 84
Background ... 87
Literature... 88
Data and Variables ... 93
Empirical Strategy ... 96
Results ... 102
Discussion and Conclusion ... 105
Tables ... 108
Figures ... 115
Appendix ... 118
LIST OF TABLES
Table 1.1. Descriptive Statistics of EEOC Allegations 2006-2015 ... 35 Table 1.2 Minimum Wage Summary ... 37 Table 1.3. Descriptive Statistics for Regression Variables ... 40 Table 1.4. Hypothesis #1 Regression Results: Effects of logged minimum
wages on the logged rate of all allegations (coeff/std error) ... 42 Table 1.5. Hypotheses #2 and #3 Regression Results: Effects of logged
minimum wages on logged rate of allegations, by selected discriminatory
action and sector (coeff/std error) ... 43 Table 1.6. Hypotheses #4 Regression Results: Effects of logged minimum
wages on logged rate of allegations, by statute (coeff/std error) ... 44 Table 1.7. Quantile Regression Results: Effects of logged minimum wages
on the logged rate of all allegations ... 44 Table 2.1. Minimum Wage Summary ... 71 Table 2.2. Descriptive Statistics ... 74 Table 2.3. Effect of Logged Minimum Wage on Probability of Being in the
Labor Force ... 75 Table 2.4. Effects of Minimum Wage on Labor Force Participation, by Age
Group and Sex ... 76 Table 2.5. Effect of Logged Minimum Wage on Logged Minutes Spent
Performing Job Search Activities ... 77 Table 3.1. States, by Expansion Status and Federal Funds Received (2014-2016) ... 108 Table 3.2. Descriptive Statistics for Regression Variables, by Pre-2017
Table 3.3. Regression Results on Employment Rates/100,000, and
Derivation of Triple Difference Estimator ... 112 Table 3.4. Triple-Difference Coefficients Using Other Industries as
Treatment (Employment/100,000)... 113 Table 3.5. OLS Results of Federal Transfers on Health Care Employment
Rates (State Level) ... 113 Table 3.6. Triple-Difference Coefficients for Individual-Level Regressions ... 114 Table A1. Regression Results for Sub-groups: Effects of logged minimum
wages on the logged rate of all allegations ... 118 Table A2. Effects of Logged Minimum Wages on Selected Logged
LIST OF FIGURES
Figure 1.1. Number of Allegations per Filing ... 45
Figure 1.2. Allegation Rates and Totals by Year, All States... 46
Figure 1.3. Average Annual Allegations Rates by State ... 46
Figure 1.4. Average Annual Allegation Rates, Geographic Distribution ... 47
Figure 1.5. Allegation Rates by State-Month ... 47
Figure 2.1. Labor Supply and Demand Curves Following Minimum Wage Increases ... 78
Figure 2.2. Value of Nominal Minimum Wage Changes (2006-2017) ... 79
Figure 2.3. Boxplot Distribution of Minimum Wage Changes (2006-2017) ... 80
Figure 2.4. Variation in Minimum Wages Over Time (Selected States, 2006-2017) ... 81
Figure 2.5. Coefficients of Minimum Wage on Labor Force Participation, by Human Capital ... 82
Figure 2.6. Coefficients of Minimum Wage on Labor Force Participation, by Age and Sex ... 82
Figure 3.1. Population Growth, Relative to 2009 ... 115
Figure 3.2. Total Medicaid Expansion Reimbursements per Capita ($), 2014-2016 ... 115
Figure 3.3. Health Care Employment, Pre-Intervention Trends... 116
CHAPTER 1: DO EMPLOYERS DISCRIMINATE MORE WHEN MINIMUM WAGES INCREASE?
Abstract
In its 53 years, the Equal Employment Opportunity Commission (EEOC) has enforced anti-discrimination laws protecting workers on the basis of race, sex, nationality, age, and disability status, among others. The agency’s rich administrative data, though, has been under-utilized by researchers in the voluminous discrimination literature. In this paper, I use publicly unavailable EEOC data to test a largely unexplored question: whether employers discriminate at higher rates following minimum wage increases, as Stiglitz (1973) and Mincer (1981)
Introduction
Spurred by the Civil Rights movement, the second half of the 20th century was a
productive time for U.S. legislative efforts attempting to eliminate what had been frequent and often transparent employment discrimination. A number of new laws (Civil Rights Act, Age Discrimination in Employment Act, Equal Pay Act, Pregnancy Discrimination Act, and the Americans with Disability Act) prohibited employers from discriminating against employees and applicants based on their race, color, religion, national origin, sex, pregnancy status, age (over 40), or disability, and created the Federal Equal Employment Opportunity Commission to enforce the new requirements. Overtly discriminatory language commonly found in newspaper help wanted ads from before these laws were enacted now seems strikingly distant, explicitly limiting applicants to white or black individuals, men or women (frequently called “girls”), and those within a particular age range. “GIRL., white, 25-40. Lite household duties. Rm, board, sal. Apply eves. after 5” reads one ad placed in the L.A. Times in January 1960 (Darity and Mason, 1998).
characteristics to isolate discriminatory effects in employment, again focusing primarily on race. Broad consensus among causal studies emerged that white/black and male/female gaps narrowed in the decades following enactment of the laws then stalled, even after controlling for measures of human capital. Recent figures published by the Bureau of Labor Statistics (BLS), albeit unadjusted and not causal, support the idea that gaps in employment outcomes among groups remain. BLS reports that the full-year 2017 unemployment rates for blacks (7.5%) was about twice that for whites (3.8%), and the rate for Hispanics was nearly a percentage point higher (5.1%) than that of non-Hispanics (4.2%) (BLS, 2018a). The agency also reports that the 2017 unemployment rate for persons with disabilities was more than twice that of individuals without a disability, 9.2% to 4.2%; 18.7% of persons with disabilities were employed compared to 65.7% of people without (BLS 2018b). And the unadjusted ratio of women’s wages to men’s has
remained between 0.75 and 0.82 since the early 1990s (author’s calculations using BLS tables1).
relationship between minimum wage and discrimination is one contemplated by both Joseph Stiglitz (1973) and Jacob Mincer (1981) who theorized that higher wage floors create a longer queue of applicants for low-skilled jobs which in turn creates openings for more prejudicial bias to enter the hiring process. Neither paper, however, attempted to empirically measure the effect. Discrimination may also be introduced into other employment practices, such as the corollary to Stiglitz’s and Mincer’s proposal, firing workers of certain groups first in response to higher labor costs. My analysis also fills a gap in the extensive minimum wage research: while a number of existing papers estimate how minimum wage increases have differential effects among
likely due to the low precision generated by the infrequency with which hiring discrimination allegations are filed. My analysis also corroborates the findings of other researchers that discrimination is procyclical, with allegations generally rising in times of a strong economy when workers have more confidence in the job market.
Background
The EEOC enters the discrimination process as the agency statutorily authorized to enforce federal laws prohibiting U.S. employers, employment agencies, and unions (which I simplify as “employers” or “firms” below) from discriminating against job applicants and employees on the basis of certain protected classes. Prohibited discrimination includes a wide range of workplace actions such as hiring, firing, promotions, harassment, training, wages, and benefits, among others. Most firms with 15 or more employees are covered by EEOC laws (or 20 employees under the ADEA). The enforcement process begins when individuals who believe they have been subject to discrimination file allegations with the EEOC on-line, in writing via traditional mail, or in person at one of the agency’s 53 field offices. Filing with the EEOC may be initiated, but not completed, by phone, because the signature of the filing party is required. An individual may file multiple allegations at once.
EXAMPLE: a worker may file with the EEOC, alleging that her employer unlawfully paid her less than her male colleagues on the basis of her sex; failed to promote her because she was more than 40 years old; and fired her in retaliation for raising sex
discrimination with management. This would be captured in EEOC administrative data as three allegations (and in my analysis as three observations), each with an action, a basis, and a statute.
Observation #2: Promotion (action); age (basis); ADEA (statute)
Observation #3: Firing (action); retaliation (basis – that is, she was discriminated against not on the basis of a physical or demographic characteristic, but because she pursued corrective action); Title VII of the Civil Rights Act (statute)
Some individuals, though, file dozens of discriminatory allegations at once because third-parties are allowed to file with the EEOC on behalf of any number of workers they represent. Another individual, organization, or agency – like a worker advocate or union representative – may file on behalf of multiple workers alleging various discriminatory actions. Each instance of reported discrimination is represented as an observation in my analysis. A limitation of the EEOC dataset is that when multiple allegations are filed together, the data do not indicate how many individuals are represented. For instance, in the example above, there is no variable to identify whether a single individual filed all three allegations on behalf of herself, or a union representative filed on behalf of three other people. Table 1.1 Panels A-C present frequencies of the EEOC’s statutes, the most common prohibited actions, and the most common bases for employer actions. Figure 1.1 illustrates the number of discriminatory allegations in each filing. About 30% the time, people file just one allegation (assuring that each was made on behalf of a single worker), and two-thirds of the filings contain three or fewer allegations (few enough to suggest, though not guarantee, that each represents a single worker). A further limitation is that individual demographic data is available only for the person who files with the EEOC, not the actual subject of the alleged discrimination.
file with either the EEOC or their local agency. Only Alabama, Arkansas, and Mississippi do not have their own state or local agencies, meaning complainants working at firms in those states may file only with the federal EEOC, which has field offices in all three states, or on-line or via traditional mail. Critical to my analysis, all allegations, regardless of whether they were filed federally or locally, will be reflected in the federal EEOC data. This is because the EEOC and state/local agencies operate under information sharing agreements to avoid duplication of work. If an allegation is covered by both federal and local laws, then the state/local agency will forward them to the EEOC but will process them itself, and vice versa. (For simplicity, the rest of the paper will refer to all allegations as being filed with the EEOC, regardless of their place of origin, unless otherwise noted.)
Allegations must be filed with the EEOC within 180 days of the alleged discriminatory action or within 300 days if filed with a state or local agency. There are several different means in the process through which they may be resolved, such as pre-investigation mediation, post-investigation conciliation, a finding of no reasonable cause, or a lawsuit, among others. The length of time the EEOC takes to conclude depends on the factors of the case and the route pursued. According to the agency website, mediations take an average of 3 months, and investigations 10 months. The methods in my analysis will account for these time-related differences.
Literature and theoretical underpinning
1995; Dovidio et al., 2011; Fleury, 2012). Becker framed his model of discrimination as being borne of taste-based preferences, that is, negative feelings or antipathy causing some employers to experience a disutility from employing members of a certain group. (Here, I set aside Becker’s extended application of his taste-based discrimination model to employees and consumers who feel antipathy towards working with or purchasing products or services from people of another group.) Employer disutility is expressed in the market as a willingness to bear costs to employ members of the preferred over the less-favored group, a cost such as wage differentials for comparable productivity. A second model of discrimination, statistical discrimination, gained prominence after Becker. The fundamental distinction of the statistical model stems from the assumption that firms are rational, profit-maximizing actors not driven by unexplained animus against certain groups. Lower wages or employment are motivated instead by incomplete
information about workers’ hidden skills and productivity levels. In the absence of unambiguous signals, firms imperfectly categorize workers by their group to estimate productivity.
Research since Becker has generally tried to do one of two things: quantify the
differences in outcomes between different groups (primarily focusing only on male/female and white/black gaps, and on disparities in wages and employment), and explain why differences in outcomes exist among groups. The body of literature on employment discrimination is
differential effects of minimum wage laws across demographic groups but stops short of proposing discrimination as a channel.
Theoretical underpinning. That minimum wage increases might result in more discriminatory practices by firms against certain workers is grounded in theory proposed
separately by Stiglitz (1973) and Mincer (1981). The former described a central problem of taste-based discrimination: in a well-functioning market of rational actors, wages paid to equally productive workers of different groups should eventually equalize. Profit-maximizing employers would increase demand for the services of the lower-wage group, bidding up their wages until any differential is eliminated. But Stiglitz also recognized that despite this prediction, wage discrimination stubbornly persisted. He attributed it to various forms of market failure, including the possibility that subjective prejudices are simply too strong to allow wages to freely find equilibrium, suggesting that there is no market pressure for firms to not exercise their prejudices. Most relevant to this analysis, he proposed minimum wage laws as a second source of market failure to explain persistent gaps in equilibrium wages for two groups who exhibit the same productive characteristics. An effective minimum wage “means that the number of applicants for unskilled jobs exceeds the supply, so that the employer can, with no economic cost, indulge in his (discriminatory) preferences.”
a purely rational decision by the firm, due to the fact that higher minimum wages represent a larger wage increase for blacks than for whites.
In order for Stiglitz’s and Mincer’s proposals to be valid, applicant queues would have to increase following a minimum wage increase, which could happen through a number of
channels: 1) most obviously, a drop in employment, making all jobs rarer, 2) reduced turnover, making open jobs rarer, and 3) more workers drawn into the labor force searching for work. Regarding the first channel, employment effects, the literature on minimum wage laws is voluminous, and much of it, indeed, concludes that employment levels are negatively affected (Neumark & Wascher, 2007 and 2017 summarize multiple papers). Some research, though, concludes there is no meaningful change or even a small increase in jobs (a meta-analysis by Doucouliagos & Stanley, 2009; Dube et al., 2010; Allegretto et al., 2011). But even among those papers reporting an average effect of zero job loss, a distribution of employers around that mean will include some who respond as neoclassical economics suggests, by choosing to eliminate certain positions when the cost of labor goes up. Regarding the second channel, turnover, research has found that minimum wage increases do in fact reduce quits, layoffs, or both (Reich et al., 2005; Brochu & Green, 2013; Dube et al., 2016). Importantly for supporting Stiglitz’s and Mincer’s theory, some of the research finds that hiring rates also slow (Brochu & Green, 2013; Dube et al., 2016). Less literature exists studying the minimum wage’s impact on labor force participation. It suggests that teenagers and other workers with low human capital may stop looking for work, reducing applicant queues, but higher minimum wages draw other workers with higher human capital into the labor force (Wessels, 2005; Luna Alpizar, WP; Treacy, WP).
Empirical research on discrimination’s association with minimum wages. To my
both cases, the data used are 25+ years old, and the minimum wage discussions are brief and secondary to each paper’s main intent. First, research by Burkhauser et al., (2000) used 1990-1992 data from the Current Population Survey and the Survey of Income and Program
Participation to conclude that employment effects following minimum wage increases are higher for groups who are more likely to face discrimination. Specifically, their results suggest that the employment elasticity for blacks is four times more negative than the elasticity for whites.
A second paper by Gilman (1965) primarily attempts to isolate the effects of race
discrimination in employment gaps by decomposing out the effects of human capital, occupation, and region. The author only briefly touches on the minimum wage. He notes that in the South, fewer workers are covered by minimum wage laws for a variety of reasons: less state and local legislation, lower unionization rates, and relatively more workers in industries like agriculture that are exempt from the federal minimum wage. Using a 1939 income study, he suggests that, for these reasons, Southern employers can more easily exercise their prejudicial preferences through lower wages compared to employers elsewhere in the country. As a result, Southern firms used hiring and firing significantly less frequently as discriminatory channels, leading to smaller white/non-white employment gaps.
ethnicity. Young black or Hispanic males suffer decreases to hourly wages, weekly earnings, and employment following minimum wage increases, while whites experience an hourly wage increase (with no effect on weekly earnings or employment). Among female teenagers, the hourly wages of whites increase, but there is no significant change in any outcomes among blacks or Hispanics. Allegretto et al. (2011) also look at teenagers, but their results are less pronounced than Neumark and Wascher’s conclusions. They find few white/black or male/female differences in outcomes. Using their preferred specification, white and black teenagers experienced highly significant wage gains (even moreso for blacks), but no significant effects on employment or hours. Hispanic youths were made worse off, though, suffering losses (albeit insignificant) and a highly significant reduction in work hours.
they are able to quantitatively compare results with a slightly older cohort (Periera, 2003; Portugal & Cardosa, 2006). While both papers conclude that older workers experience
significantly better outcomes following a minimum wage increase compared to younger workers, neither looks at ages greater than 35, limiting the applicability to the United States.
Data
This paper draws on extensive data provided to me by the EEOC in January 2018 in response to a special request made to the agency. The data are not publicly available, even, according to the EEOC official who manages public requests for data, by means of a Freedom of Information Act petition. The raw data contains variables capturing information on the party filing the allegations (sex, age, race/ethnicity); the allegations themselves (date of the filing, date of the alleged discrimination); the employer (city, state, and sector); and the statute, action (hiring, firing, wages, etc.), and basis (race, sex, disability status, etc.). The dataset included 4,840,076 allegations of employment discrimination taking place between 2006 and 2015. After dropping observations with critical missing data and those assigned to the state of Alabama in August 2013, a state-month with clear data irregularities, I was left with a sample size of
4,804,273 individual allegations. I use data from BLS’s Local Area and Unemployment Statistics to generate rates of discrimination, dividing the absolute number of EEOC allegations in each state-month by the size of the corresponding labor force, then multiplying by 100,000. Since labor force size includes employed individuals and those actively looking for a job, it most closely captures the population of workers and applicants who might be subject to employment discrimination.
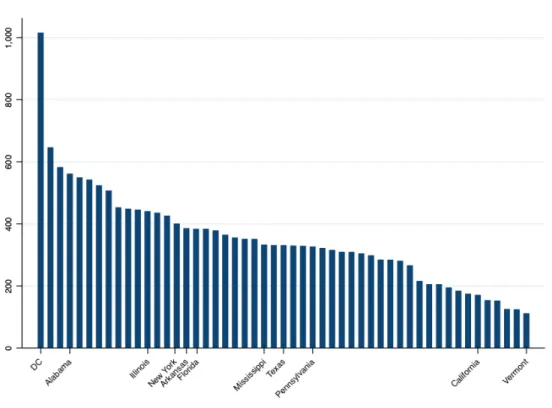
before leveling out (Figure 1.2). Figure 1.3 shows wide heterogeneity across states in their mean annual allegation rates. Employment discrimination allegations in Washington DC are 57% higher than rates in the next state, New Mexico, and 8 times higher than rates in Vermont. DC’s prominence is exaggerated by the area’s unique commuting patterns and the way I calculated allegation rates: the number of jobs in DC (a 2015 annual average of 506,7742) is high in relation
to the number of workers actually living there (388,0053). Figure 1.3 also identifies allegation
rates for the six largest states by 2015 population (CA, TX, FL, NY, IL PA) and the three states without state and local discrimination offices (AL, AR, MS). The map of allegation rates by state in Figure 1.4 does not suggest obvious regional patterns.
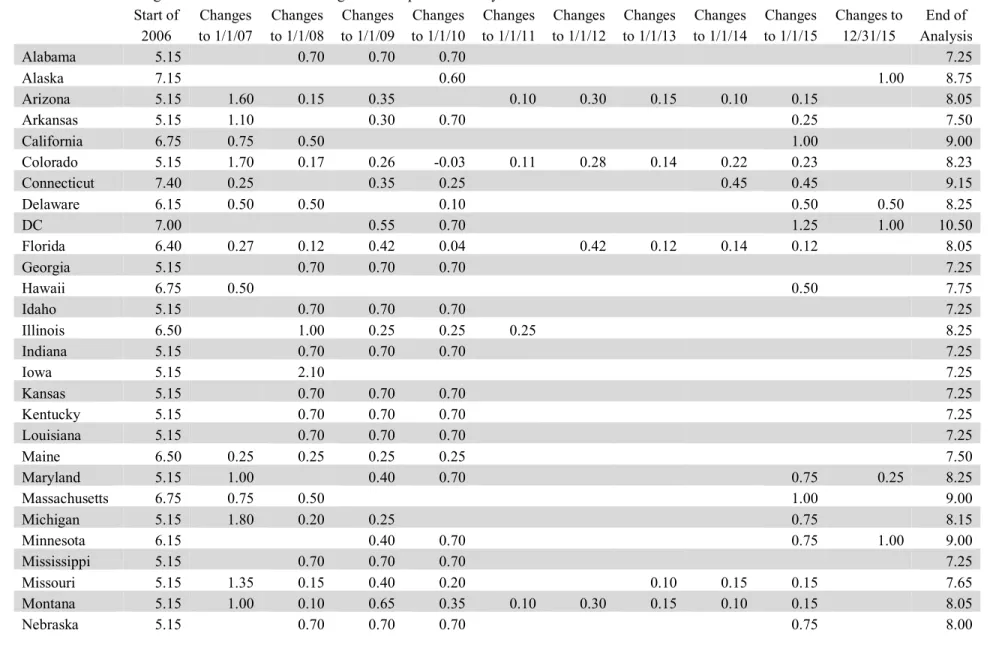
For minimum wage levels, I compiled data from a variety of sources for all 51 states. The U.S. Labor Department makes available historical state minimum wage rates as of the start of each calendar year4. Many changes in wage laws though do not take effect January 1—for
instance, July 24 was the effective date for the last three times the federal government revised the national wage floor in 2007, 2008, and 2009. For my monthly-level analysis, I determined the exact dates of minimum wage changes by researching state statutes and referenda or from online guidance published by state labor departments. Minimum wage levels changed in 231 (3.77%) of the 6,200 state-month units during my period of analysis, about evenly split between those effective in January (114) and those effective later in the year, primarily in July and August (103). When laws took effect after the first of the month, I assigned the minimum wage change to the following month. Many cities and counties increasingly enact their own minimum wages
higher than both federal and state requirements, but I keep my research at the state level because other variables are not granular enough to support a local analysis.
Finally, for my covariates, I rely on publicly available products from the Census Bureau, the Bureau of Economic Analysis, and BLS.
Variables and Methods
Outcome variables. For the primary outcome variable, I calculated overall allegation rates by dividing the total, absolute number of allegations in each state-month by the size of the corresponding labor force, then multiplying by 100,000. My final sample size is 6,119 state-month observations (51 states, 10 years, 12 state-months, and eliminating the questionable data reported in Alabama, August 2013). For the sub-analyses, I created outcome variables in the same way after first restricting the allegations accordingly. For instance, to calculate rates of alleged hiring discrimination, I summed the number of allegations, regardless of the basis, that were attributed to the actions “Hiring,” “Recall,” and “Reinstatement,” then divided by the number of labor force participants and multiplied by 100,000. Figure 1.5 illustrates the
distribution of my primary outcome variable, allegation rates by state-month. I use the natural log of allegation rates in all regressions because of the variable’s skew and to more easily calculate elasticities with respect to minimum wages.
The timing of the allegations in my outcome variables was carefully considered. The EEOC data captures both the date that an allegation was filed and the date the alleged
Alleged versus proven discrimination. My outcome variables are all constructed using allegations of discrimination. While actual discrimination is conceptually my subject, the dataset provided by the EEOC captures allegations, not proven discriminatory acts. A link between the two must be established to validate any conclusions, but to my knowledge, no definitive
quantitative evidence exists, nor does it seem likely to exist given the difficulty of actually proving discrimination and the complexity of the administrative process. But there is certainly evidence suggesting an association. To start, research by Coleman et al. (2008) used survey data to validate reports of wage discrimination among blacks. They found that only 12.5% of black men and 12.68% of black women who reported wage discrimination displayed no evidence of it. Quantifying discrimination from EEOC administrative data is not as conclusive as the findings of Coleman et al. In the data provided to me, 20.39% of allegations are classified as having resulted in an outcome “with merit”, that is, favorable to the worker. Another 10.83% of
allegations were in various legal stages, but classified without information on whether they were concluded or in whose favor. These numbers are roughly consistent with research by Hirsh (2008), who found that the outcome in about one in five claims is favorable to the worker, and by Chan et al. (2005) among whose sample of disability claims, 21% were resolved with merit.
research illustrates multiple ways employers can significantly bend the dispute resolution process in their favor. Firms, particularly repeat offenders, benefit from prior legal experience and
greater resources, allowing them to interact more strategically and skillfully with the process. Most complainants, on the other hand, file discrimination allegations rarely and reluctantly. Also, apart from the worker’s own statement, the employer holds or controls most of the evidence related to the allegations (personnel files, pay records, and statements from supervisors and other employees), giving them some ability to manage how the information is disclosed to EEOC officials. And employers can influence the outcome of a specific case – regardless of whether the underlying allegations are true – by demonstrating compliance with discrimination laws in general. For instance, firms use the fact that they established in-house dispute resolution processes or affirmative action departments to help convince EEOC officials that a specific allegation is unfounded.
Importantly, other researchers have concluded that every individual who steps forward with allegations likely represents multiple others who remain silent. In a sample of 560
unemployed. The potentially low rewards of backpay compared with the costs of filing are a disincentive to pursue discrimination claims, especially for the low-wage workers who are the main focus of this analysis (Donohoe & Seigelman, 1991). To the extent that my analysis
generates a positive effect on discrimination allegations, the result may be conservative given the low rates of reporting.
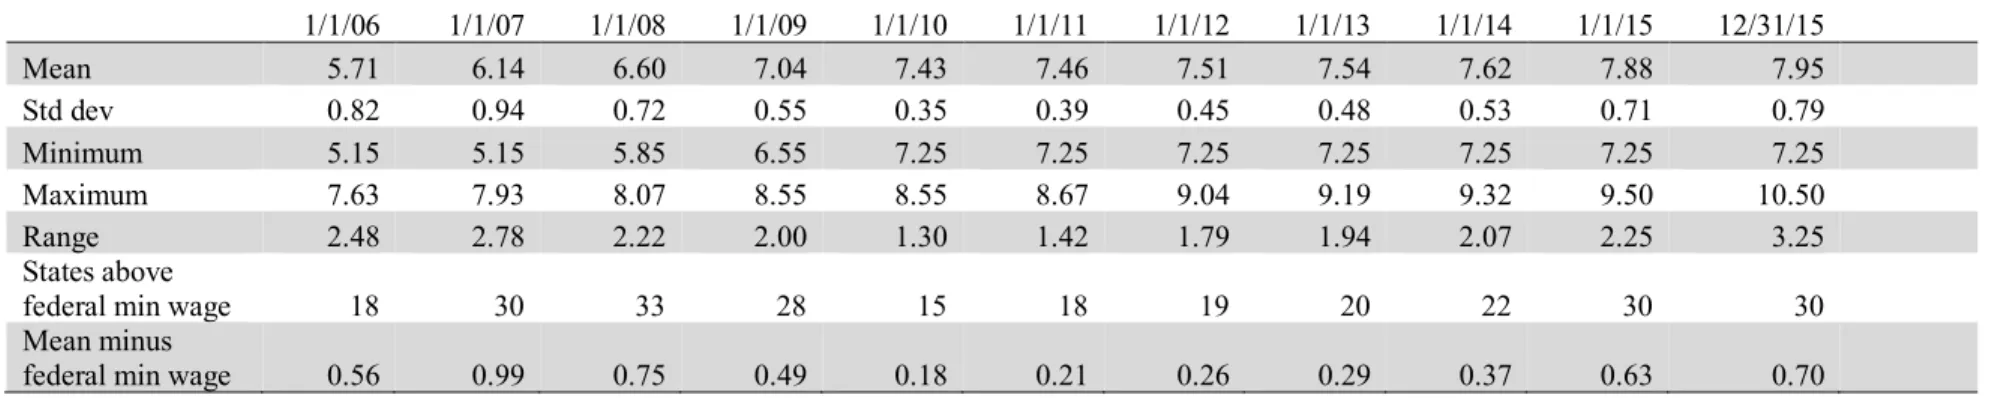
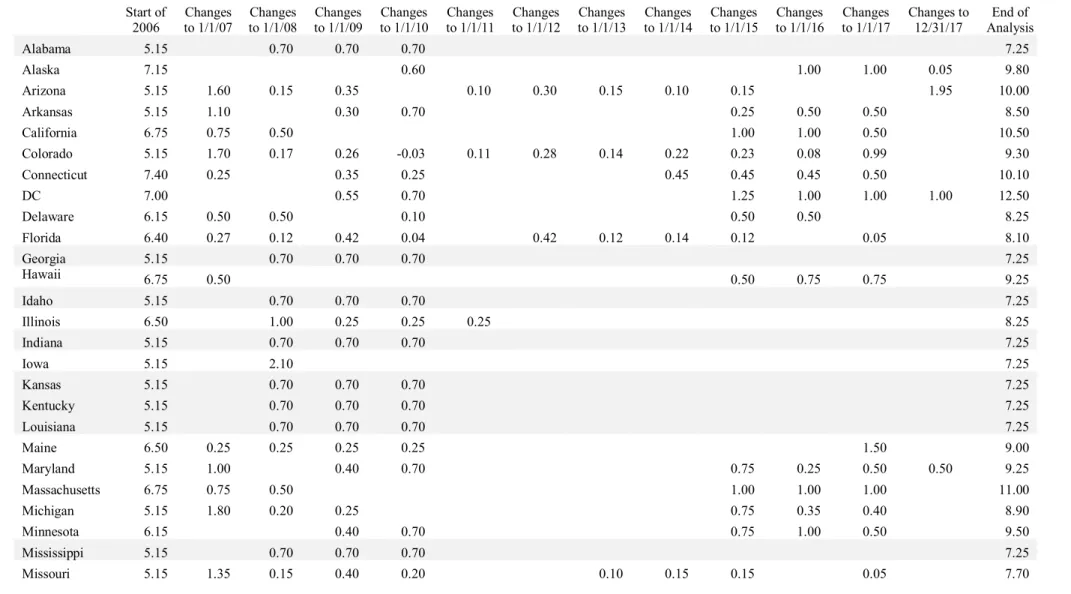
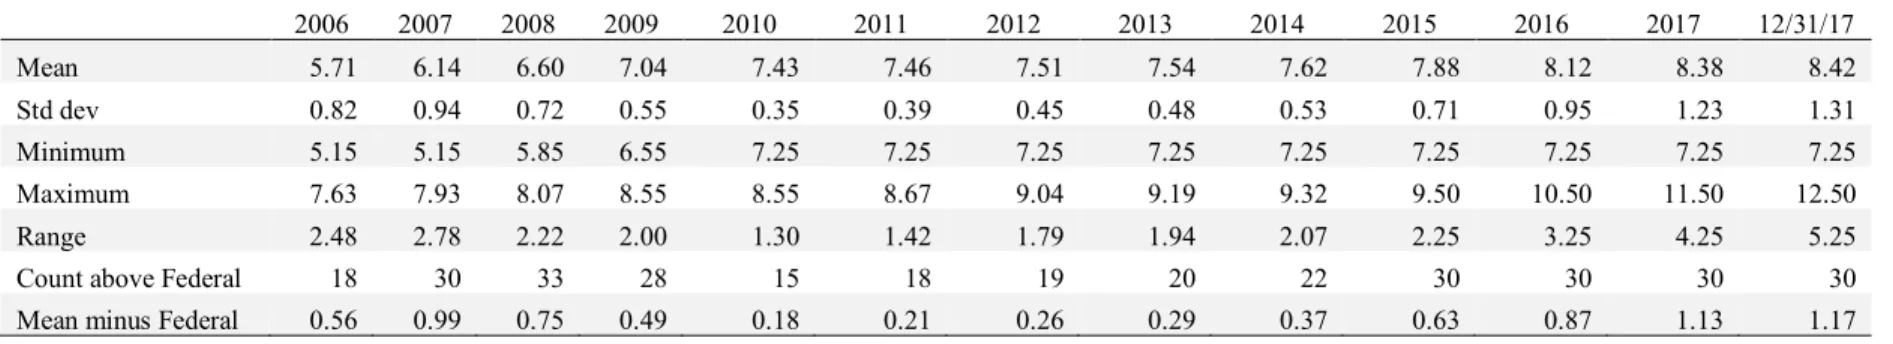
Independent variable of interest. As with my outcome variables, I took the natural log of minimum wage to account for a rightward skew and to provide a straight-forward calculation of the elasticity. I use nominal, not real, minimum wage rates to prevent my model from picking up effects of the constant, small changes from inflation adjustments. Table 1.2 Panel A presents the dollar changes in state minimum wages each year 2006-2015, with annual descriptive statistics in Panel B. The high levels of variation among states during most of this period offer a richer source of identification, and the graphs in Panel C visually illustrate how dispersion changed over time. All measures of variation (standard deviation, range, number of states with minimum wages higher than the federal rate, and the difference between the highest rate and the mean) among the states were wide in the years leading up to 2007 when Congress raised the federal minimum wage for the first time in nearly a decade. In early 2007, 30 states had legislated their own, higher wage floors, and the mean of all 51 states was almost a dollar above the federal rate. After narrowing in the wake of the 2007-2009 federal increases, minimum wage variation started widening again. By 2015, the end of the analysis, all measures of dispersion were near or above all-time peaks. Sixteen states went the entire 10-year period without raising their state minimum wage levels higher than federal requirements.
Previous researchers have linked the macro-level business cycle to both minimum wage changes and to employment discrimination, proposing that discrimination reports are procyclical because workers feel freer to pursue action against their employers in a tight labor market (Donohoe & Siegelman, 1991; Reich, 2009; Baskaya & Rubinstein, 2011; Biddle & Hamermesh, 2013). To operationalize the business cycle, other studies commonly include the unemployment rate (Sabia, 2007; Addison et al., 2009; Allegretto et al., 2011). Instead, I use nominal gross state product (GSP) per capita because using any unemployment measure would introduce endogeneity into my particular analysis, given that all of my outcome variables are divided by labor force size, which is a component of the unemployment rate.5 The Bureau of Economic Analysis publishes
GSP figures quarterly, and state population is estimated annually by the Census Bureau using American Community Survey (ACS) results. I calculated the three midpoints between each annual population figure in order to capture quarterly population.
Additionally, I control for the rate of workers represented by unions, another potential confounding effect. There are two channels through which higher unionization representation may decrease discrimination or, at least, discrimination claims: organized labor actively advocates for the fair treatment of their workers and offers worker a separate channel to report allegations instead of filing with the EEOC. In analyses where I find higher unionization representation, lower rates of discrimination allegations will be expected. I also control for the proportions of whites, Hispanics, and females. All four of these variables were reported on a yearly basis. I converted each into state-month values by calculating the midpoints between the annual data points.
5 A number of existing minimum wage studies operationalize the business cycle by using a measure of wage growth
Descriptive statistics for all variables in my regressions are found in Table 1.3 Panel A. Panel B lists, in descending order, the average monthly allegation rate for all states.
Methods. My period of analysis extends from January 2006 to December 2015, a 120-month period with a complete macro-economic business cycle as well as a high level of variation in minimum wage levels. I use a difference-in-differences model exploiting within-state variation in minimum wage changes. Early, landmark research by Neumark and Wascher (1992) into the employment effects of minimum wages created a template for many subsequent studies by including state fixed effects to account for unmeasured state-specific economic conditions and year fixed effects to account for common macroeconomic trends corresponding to such things as business cycles or cohort size. Accordingly, I start with the most parsimonious model, a
traditional difference-in-differences set-up, with dummy variables for the state and year, plus a fixed effect for calendar month to control for seasonal variation.
ln($%,') = * + ,ln-./%,'0 + 1%+ 23+ 4 + 5%,' , (1)
where Ys,m is the rate of all discrimination allegations indexed to state s and month m (month-of-analysis from 1-120); MWs,m represents the nominal value of the minimum wage; gs is a state fixed effect; tt is a year fixed effect; w are dummies for calendar months; and e s,m is the residual. The coefficient b expresses the effect of minimum wage rates on discrimination. Standard errors are clustered at the state level to address the issue of serial correlation and avoid standard error downward bias (Bertrand et al., 2004). In sub-analyses to examine the effect of the minimum wage on different sectors, statutes, bases, and actions, the outcome variable differs, but always represents the rate of reported discrimination per 100,000 labor force participants.
higher minimum wage laws compared to those that do not. Since the period of analysis is 10 years, it is possible that these effects follow different paths, compromising my estimates. To help solve this, I add the macroeconomic and demographic covariates to the Neumark and Wascher (1992) model.
ln($%,') = * + ,ln-./%,'0 + 78%,'+ 1%+ 23+ 4 + 5%,' , (2) where Zs,m represents the suite of state-month controls (GSP per capita, union representation rates, and the proportions of white, Hispanic, and female).
Identification of minimum wage effects remains problematic if spatial heterogeneity remains after controlling for observables. A number of recent papers have solved for this by adding to the Neumark and Wascher (1992) model a state-time trend to allow unmeasurable conditions to vary across states (Addison et al., 2009; Dube at al., 2010; Allegretto et al., 2011). Accordingly, my third and fourth specifications add to Equations #1 and #2 by including a state time trend (f s,m) using the month of the period of analysis (1-120).
ln($%,') = * + ,ln-./%,'0 + 1%+ 23+ 4 + 9%,'+ 5%,' , (3) ln($%,') = * + ,ln-./%,'0 + 78%,'+ 1%+ 23+ 4 + 9%,'+ 5%,' , (4) Hypotheses
The dataset lends itself to exploring what kinds of employment discrimination and which sub-groups are most sensitive to minimum wage increases. My first analysis, however, is to aggregate all 4,802,273 individual allegations and test whether the elasticity of discrimination allegations overall with respect to the minimum wage is statistically significant.
Hypothesis #1: hall allegations > 0
(herein, “hiring”). A corollary to their theory is to restrict the data to the 1,560,859 allegations claiming illegal firings or layoffs. If employers may express their prejudicial tastes in choosing new workers to fill open positions, they may exercise the same biases when selecting current workers to terminate.
Hypothesis #2: hhiring > 0, hfiring > 0
Next, I compare the elasticities of private versus public sector employers. Rates of union representation are far lower on average among private sector employers (7.4%) than public (39%) allowing them more freedom to discriminate. BLS also reports lower median weekly earnings in the private sector versus the public sector, even among workers not represented by unions ($765 and $878), suggesting that private employers employ more low-wage workers for whom minimum wages hikes are binding. Both facts support a hypothesis that private firms are more responsive to minimum wage rates and will have higher elasticities. I also expect the private sector coefficient on GSP to be positive, which is consistent with existing research, but attenuated in the public sector where employers are less immediately exposed to business conditions. And since the rates of organized labor in the public sector are high, I expect its coefficient on union representation to be statistically significant and negative.
Hypothesis #3: hprivate > hpublic
Next, stratifying by statute provides an opportunity to create a falsification test using age discrimination allegations. The ADEA establishes a single threshold for age discrimination: employers may not discriminate against individuals aged 40 and older. Becker (1962) articulated how human capital in general, including years of experience, influences the wage distribution. Lacking a measure of years of experience, researchers have commonly proxied with the
have higher levels of human capital and are less like to be affected by minimum wage increases. BLS data support this: in 2015, the average weekly earnings of full-time workers between 16 and 35 was $668, and that of workers between 44 and 64 was $924. I hypothesize therefore that the elasticity of age discrimination allegations is equal to zero.
Hypothesis #4: hADEA = 0
Finally, the EEOC data is rich enough to probe whether other subgroups by basis or action are also unexpectedly affected by minimum wages. I will also analyze other prominent subgroups without any theoretically based expectations of results.
Results
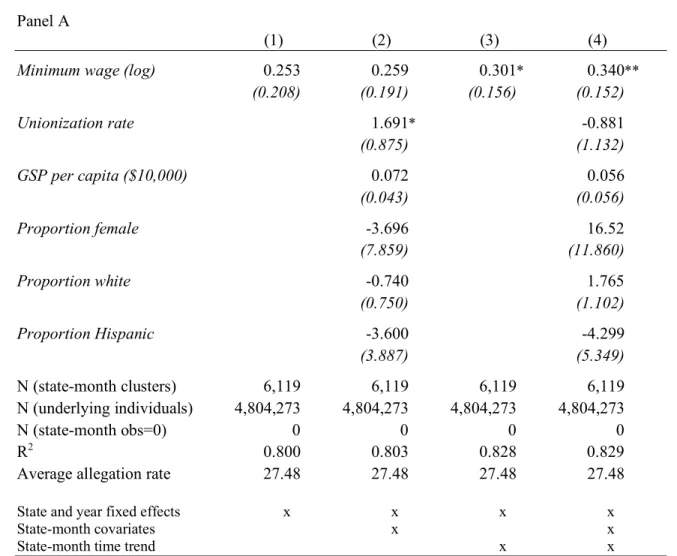
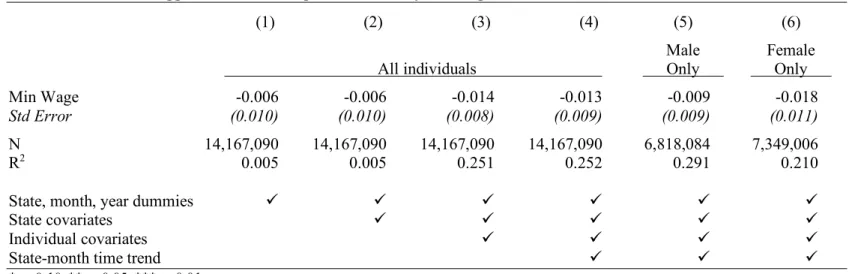
Hypothesis #1: Discrimination allegations in general increase with the minimum wage. Results for the minimum wage variable and other covariates in support of Hypothesis #1 are presented in Table 1.4 Panel A. In this and all other regression tables, I also report the number of underlying individual allegations of discrimination that were collapsed into the 6,119 state-month observations, the number of state-state-months with no allegations6, and the average number of
allegations per state-month. In this first case, which considers all categories of alleged
discrimination, there were no state-month observations without allegations (Vermont had the 11 lowest month totals, between 4 and 11 allegations). The coefficients on minimum wage are all positive but take noticeable jumps when time trends are included (about 20% higher from column #1 to #3, and about 40% higher from #2 to #4). The addition of state-specific linear time
6 The problem of undefined values of outcome variables occurs in a number of these sub-analyses in which the
trends also produces notable improvements in precision and makes the effects statistically significant. The elasticity from equation #4 indicates that a 1% increase in the minimum wage is associated with a small (0.34%) but significant increase in the rate of all allegations per month. Interpreting the elasticity with a mere 1% increase in the minimum wage is not entirely
meaningful since, apart from small, automatic inflation adjustments, minimum wage changes are generally much larger. The last three federal rate hikes, for instance, were between 10.7% and 13.6%. A more realistic 10% increase is associated with a 3.4% monthly increase in the rate of discrimination allegations. This may be a conservative estimate given that existing research suggests a substantive number of discriminatory actions go unreported. Since I construct variables using the dates that the alleged discrimination occur and not the date on which individuals file with the EEOC, my results are not biased by delays in reporting. The union representation rate is, counterintuitively, positive and moderately significant without time trends, but then switches to its expected negative sign with time trends included although was not statistically significant. There is limited support to corroborate the work of previous researchers who found discrimination is pro-cyclical: the effect GSP per capita is positive, although
insignificant.
is predicted to result in about 60 more individual allegations in Pennsylvania (the 5th most
populous state in 2017), 17 more in Oklahoma (28th), and 6 in Maine (42nd). A hypothetical state
with an average labor force participation and allegation rate would see a monthly increase of about 28 allegations.
Results demonstrate that introducing time trends to specifications adds precision to my estimates. Allowing for this spatial heterogeneity is also consistent with the strategies followed by more recent researchers (Addison et al,. 2009; Dube et al,. 2010; Allegretto et al., 2011). Therefore, I use Equation #4 for all subsequent regressions on subgroups as well as for the robustness checks and extensions below.
Hypothesis #2: Allegations of hiring and firing discrimination increase with the minimum
wage. Table 1.5 column 2 shows that the elasticity on hiring discrimination is positive but statistically insignificant, failing to offer support for one of the key motivators of this analysis. Three potential explanations come to mind. First, the coefficient may be artificially low if rejected applicants report hiring discrimination far less frequently than it happens. Applicants, after all, have far less exposure to management and its attitudes than actual employees, rendering them less able to recognize discriminatory intent. Rejected applicants are also likely to be
Mincer’s assumption that applicant queues grow longer with minimum wage increases is flawed during my period of analysis, especially if some of the newer research, showing that higher minimum wages have no effect on employment, is true. Among the other variables, the positive coefficient on union representation seems at first counter-intuitive. Though it is statistically insignificant, this anomaly is consistent with a labor market condition specific to this outcome variable: unions may not have the predicted negative effect on hiring discrimination since applicants, unlike actual employees, are not represented by unions.
In contrast, column 3 shows that the effect of minimum wages on firing discrimination allegations is positive, similar in magnitude to the effect on overall allegations, and statistically significant. In these data, the corollary of Stiglitz’s and Mincer’s hypothesis is stronger than their actual hypothesis that higher minimum wages create longer hiring queues upon which employers may impose their prejudicial tastes. Results in column #3 suggest that, for the employers who do cut staff following a minimum wage hike, their prejudices may strongly influence the decision of which existing workers to fire. While not all firms may shed jobs after a minimum wage
increase, among those that do, these results suggest that the first workers to be let go are from protected classes. It is also important to note that the number of individual discrimination allegations in firing is nearly 10 times greater than in hiring and produced a far smaller standard error. The statistically significant increase in firing discrimination, therefore, compared to hiring discrimination, may be in part attributable to precision. Finally, the direction of the coefficients on unions (negative) and GSP (positive) are as expected, although neither is statistically
significant.
number of unemployed individuals, which is arguably a more appropriate population for applicants. The approach is not perfect, though, because it assumes that individuals subject to hiring discrimination come from the ranks of the unemployed, which is not always true – workers may apply for and be rejected from jobs while they are already employed or while they are officially reported as outside the labor force. Consistent with my original analysis on hiring allegations, this method did not yield statistically significant results.
Hypothesis #3: Private sector employers respond more to minimum wage increases than
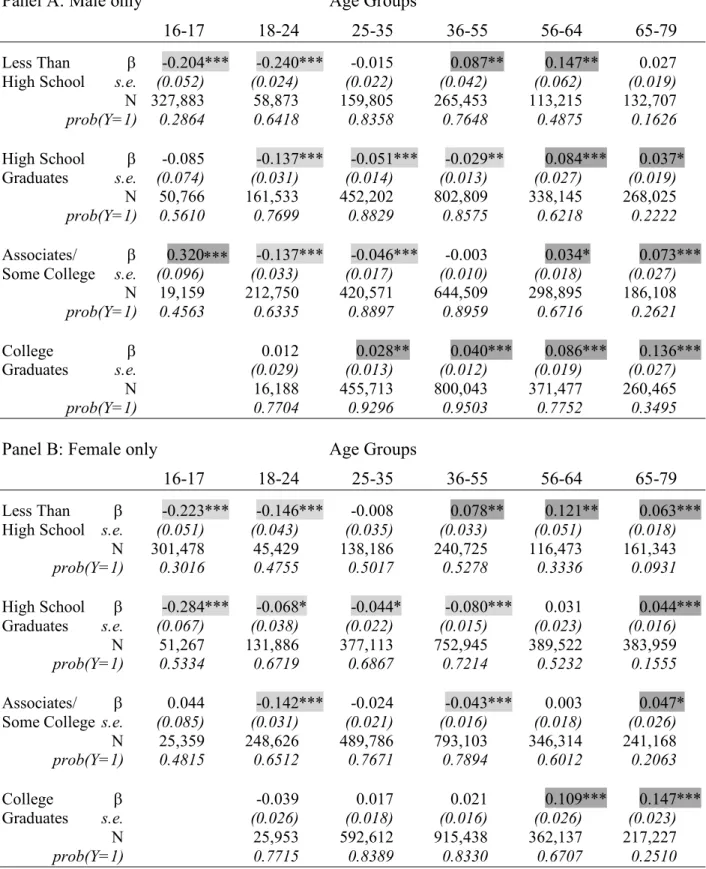
Hypothesis #4: Allegations of age discrimination attributed to the ADEA will respond
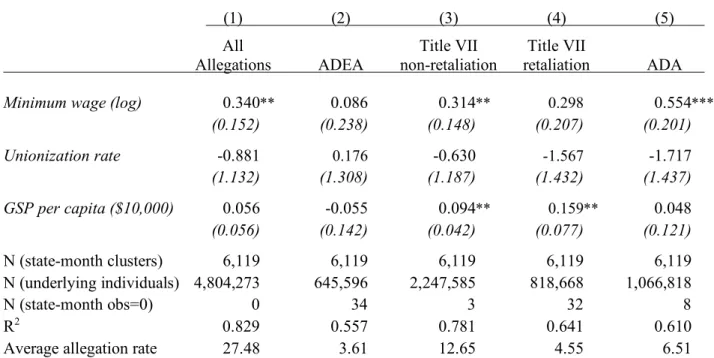
less to minimum wage increases compared to bases covered in other statutes. Results in Table 1.6, columns 2-5 reveal that there are substantial differences among the three major statutes. First, the minimum wage coefficient on the ADEA (age discrimination) serves as a successful falsification test. Not only is the effect insignificant, but the coefficient is closer to 0 than any other regression. Among Title VII allegations, more than a quarter (818,668) were attributed to the basis of retaliation, that is, employers allegedly fired, disciplined, or took other action against workers not due to demographic groups but because the workers had previously complained or participated in an investigation. Since the number was so substantial, I stratified the Title VII allegations by retaliation versus all other bases (race, color, religion, sex, national origin, and pregnancy). Elasticities are approximately the same size but not significant among retaliation allegations, where there effects are estimated with far less precision (average allegation rates are more than 2.5 times greater for non-retaliation).
Last among statutes, minimum wage changes trigger a dramatic increase in discrimination allegations attributed to the ADA. The elasticity is the second largest in magnitude, and the highest in significance across all outcome variables. Possible channels for this effect could be driven by workers with disabilities if this sub-group is more aware of their rights or more likely to exercise those rights relative to other protected classes. Alternatively, the effect might be driven by employers. To the extent that some firms pay for workplace features to accommodate their employees’ disabilities, an extra increase in labor cost required by a
Disability-specific discrimination literature creates subgroups of disabilities carrying different levels of stigma stratified over two perceived dimensions: whether they are under a person’s control and whether they are likely to improve over time (Corrigan et al., 1988; Chan et al., 2005). For instance, visual impairment, being perceived as less controllable and less likely to improve, carries a lower stigma than substance abuse which scores higher on both dimensions. An interesting sub-question would be whether disability stigma, as measured by these factors, influence discrimination rates. But the disability literature has categorized relatively few conditions into these dimensions, and those conditions do not appear frequently enough in my data to produce a valid analysis. Only about 40% of the ADA allegations are attributable to a specific disability – most of the others are categorized in a number of “Other” buckets. Another interesting sub-question would be whether minimum wages affect people with physical
disabilities at different rates than those with mental or emotional conditions. The same drawbacks in these particular data, however, would prevent that analysis as well.
Other Subgroups. Appendix Table A1 presents regression results probing the allegation rates of prominent subgroups. Among these results, only reports of promotion allegations
national origin) are roughly in the range of the elasticity for all allegations but have much lower numbers of underlying individual allegations. It is possible that some of the effects on these other outcomes are genuine but their significance may be suppressed by the higher – sometimes much higher – standard errors.
Extensions and robustness checks
Results to this point demonstrate that the strength of the minimum wage effect is not uniform across sub-groups, but overall is driven by reports of illegal firing/layoffs; allegations in the private sector; and allegations attributed to Title VII and the ADA. Another interesting inquiry would be to explore whether effects vary by the existing rates of discrimination
allegations. It is plausible that new allegations are more likely triggered in areas where they are already common. For example, actual employment discrimination may be concentrated in certain states and certain times (independent of business conditions or union prominence) because of factors like industry mix. Alternatively, higher rates of reporting may be related to specific cultural conditions in a state-time such as local awareness of rights or acceptance of exercising those rights. To test for heterogeneous effects across the distribution of allegation rates, I ran quantile regressions to estimate changes at the 10th, 25th, 50th, 75th, and 90th percentiles (Table
1.7). An unambiguous pattern emerges: at increasingly higher rates of discrimination allegations, the magnitude of the response unambiguously increases. F-tests comparing the differences between the 90th and 10th percentiles and between the 75th and 25th percentiles are highly
As a robustness check, I dropped two outlier states, DC and New Mexico, to confirm that results were not driven by unusual conditions in my outcomes or policy variables. Allegation rates in commuter-magnet DC are artificially high because the city supports 30% more jobs than it has workers. And minimum wages in New Mexico suffer from a substantial amount of noise. The New Mexico cities of Albuquerque, Las Cruces, and Santa Fe, and the counties of Bernalillo and Santa Fe, where minimum wage rates are higher than the federal and state laws, comprise almost 45% of the state’s population, and two of these laws have been on the books for more than 10 years. While a number of states have different minimum wages in certain cities or counties, only in New Mexico is the scope of these laws wide enough, and the history of them long enough, to be removed from the analysis. After dropping these two jurisdictions, my sample size falls to 5,879. For the five outcome variables in Tables 5 and 6 which produce a statistically significant minimum wage effect, the coefficients remained largely unchanged, and there were small reductions to statistical significance.
As a second check on the insignificant result on hiring allegations, I changed the level of my analysis and aggregated the data at the state-year instead of state-month level, leaving 510 observations. The objective was to increase precision of my outcome variables and lower the standard errors, particularly in the sub-analyses in which lower numbers of individual allegations had been collapsed into the 6,119 state-month units. This improvement comes at the cost,
value of $7.05 used in my regressions.) I retained annual versions of the covariates plus the state and year fixed effects, added a state-year time trend, and ran the regression on hiring allegations plus the four outcome variables that had effects significant at the 0.05 level and beyond:
ln($%,3) = * + ,ln-./%,30 + :;<,=+ 1%+ 23+ 9%,3+ 5%,3 (5) Results are presented in Appendix Table A2 and show some, though not perfect, consistency with the original, state-month results. The effect of the minimum wage on hiring allegation rates remain insignificant. Coefficients on all allegations and for private sector firms change little in magnitude but lose their significance. The coefficients on firing discrimination and on the ADA lose some significance but remain strong in magnitude. A number of other specifications were tried to test different methods of accounting for mid-year minimum wage changes, with no marked change in results. The higher level of aggregation likely fails to compensate for the loss of monthly precision in minimum wage changes.
Discussion and Conclusion
While the existing body of literature on the effects of minimum wage increases is vast, it has primarily focused on just two outcomes, employment levels and earnings, leaving many other questions unaddressed. As states and, increasingly, localities pass their own minimum wage laws in the face of inaction at the federal level, this oversight in the research becomes a drawback for policy makers. In this paper, I build on the work of Stigler and Mincer, explore a novel question, and apply a different method that takes advantage of a large, privileged
administrative dataset.
My findings suggest that policy makers should not necessarily stop pursuing new
minimum wage laws, but that they should be aware of and prepared for unintended consequences overlooked in the current literature. My evidence indicates that a 10% increase in the minimum wage leads to about 27 additional monthly allegations of employment discrimination in a typical state. That estimate though may be conservative, as multiple researchers have shown that a high proportion of people fail to report their experiences and that employers are in a favorable position to have influence over EEOC administrative outcomes. Further, the low rates of EEOC findings decided in favor of workers are misleading because of firms’ ability to bend the
agency’s administrative process in their favor.
My analysis was not able to unambiguously confirm that the theory by Stiglitz and Mincer is the precise channel through which minimum wages affect employer discrimination. And that leaves a gap for researchers, to attempt to better understand and establish the channel(s) behind this relationship. A plausible explanation is that employers may have simmering
analysis, higher wage requirements may present firms an excuse, of sorts, to take adverse actions they had already been considering, then attribute their decisions to circumstances outside their control, such as changes in the laws.
My analysis suggests that effects are driven by firms in the private sector, where workers are less protected by unions and significantly exposed to the business cycle; by allegations of illegal firings and layoffs; by actions taken against individuals with disabilities and workers protected by Title VII; and in states and months where discrimination reporting is already common. Policy makers in a variety of institutions can prepare for this in a number of ways. Departments of labor at state and local levels can supplement their minimum wage
Tables
Table 1.1. Descriptive Statistics of EEOC Allegations 2006-2015
Panel A. Profile of allegations by statute
Title VII, Civil Rights Act 3,066,253
(63.82%)
Americans With Disabilities Act 1,066,818
(22.21%)
Age Discrimination in Employment Act 645,596
(13.44%)
Equal Pay Act 21,233
(0.44%) Genetic Information in Non-discrimination Act 4,354 (0.09%)
Undetermined 19
(0.00%)
Total 4,804,273
Panel B. Profile of allegations by basis
Retaliation 1,139,437
(23.72%)
Disabilities (all categories) 944,341
(19.66%)
Race (all categories) 875,447
(18.22%)
Sex (female) 538,248
(11.20%)
Age 513,390
(10.69%)
National Origin (all) 327,127
(6.81%)
Religion (all) 100,145
(2.08%)
Other 366,138
(7.62%)
Table 1.1 (continued). Descriptive Statistics of EEOC Allegations, 2006-2015
Panel C. Profile of allegations by employment action
Firing/Layoff 1,560,859
(32.49%)
Harassment (sexual and other) 767,887
(15.98%)
Terms & Conditions 680,115
(14.16%)
Discipline 340,268
(7.08%) Reasonable Accommodation (for a disability) 208,263 (4.33%)
Wages/Benefits 198,650
(4.13%)
Hiring/Recall/Reinstatement 167,963
(3.50%)
Other 880,268
(18.32%)
Table 1.2 Minimum Wage Summary
Panel A. Annual change in each state's minimum wage over the period of analysis
Start of Changes Changes Changes Changes Changes Changes Changes Changes Changes Changes to End of
2006 to 1/1/07 to 1/1/08 to 1/1/09 to 1/1/10 to 1/1/11 to 1/1/12 to 1/1/13 to 1/1/14 to 1/1/15 12/31/15 Analysis
Alabama 5.15 0.70 0.70 0.70 7.25
Alaska 7.15 0.60 1.00 8.75
Arizona 5.15 1.60 0.15 0.35 0.10 0.30 0.15 0.10 0.15 8.05
Arkansas 5.15 1.10 0.30 0.70 0.25 7.50
California 6.75 0.75 0.50 1.00 9.00
Colorado 5.15 1.70 0.17 0.26 -0.03 0.11 0.28 0.14 0.22 0.23 8.23
Connecticut 7.40 0.25 0.35 0.25 0.45 0.45 9.15
Delaware 6.15 0.50 0.50 0.10 0.50 0.50 8.25
DC 7.00 0.55 0.70 1.25 1.00 10.50
Florida 6.40 0.27 0.12 0.42 0.04 0.42 0.12 0.14 0.12 8.05
Georgia 5.15 0.70 0.70 0.70 7.25
Hawaii 6.75 0.50 0.50 7.75
Idaho 5.15 0.70 0.70 0.70 7.25
Illinois 6.50 1.00 0.25 0.25 0.25 8.25
Indiana 5.15 0.70 0.70 0.70 7.25
Iowa 5.15 2.10 7.25
Kansas 5.15 0.70 0.70 0.70 7.25
Kentucky 5.15 0.70 0.70 0.70 7.25
Louisiana 5.15 0.70 0.70 0.70 7.25
Maine 6.50 0.25 0.25 0.25 0.25 7.50
Maryland 5.15 1.00 0.40 0.70 0.75 0.25 8.25
Massachusetts 6.75 0.75 0.50 1.00 9.00
Michigan 5.15 1.80 0.20 0.25 0.75 8.15
Minnesota 6.15 0.40 0.70 0.75 1.00 9.00
Mississippi 5.15 0.70 0.70 0.70 7.25
Missouri 5.15 1.35 0.15 0.40 0.20 0.10 0.15 0.15 7.65
Montana 5.15 1.00 0.10 0.65 0.35 0.10 0.30 0.15 0.10 0.15 8.05
Nevada 5.15 1.00 0.18 0.52 0.70 0.70 8.25
New Hamp 5.15 1.35 0.75 7.25
New Jersey 6.15 1.00 0.10 1.00 0.13 8.38
New Mexico 5.15 1.35 1.00 7.50
New York 6.75 0.40 0.10 0.75 0.75 8.75
North Carolina 5.15 1.00 0.40 0.70 7.25
North Dakota 5.15 0.70 0.70 0.70 7.25
Ohio 5.15 1.70 0.15 0.30 0.10 0.30 0.15 0.10 0.15 8.10
Oklahoma 5.15 0.70 0.70 0.70 7.25
Oregon 7.50 0.30 0.15 0.45 0.10 0.30 0.15 0.15 0.15 9.25
Pennsylvania 5.15 1.10 0.90 0.10 7.25
Rhode Island 6.75 0.65 0.35 0.25 1.00 9.00
South Carolina 5.15 0.70 0.70 0.70 7.25
South Dakota 5.15 0.70 0.70 0.70 1.25 8.50
Tennessee 5.15 0.70 0.70 0.70 7.25
Texas 5.15 0.70 0.70 0.70 7.25
Utah 5.15 0.70 0.70 0.70 7.25
Vermont 7.25 0.28 0.15 0.38 0.09 0.31 0.14 0.13 0.42 9.15
Virginia 5.15 0.70 0.70 0.70 7.25
Washington 7.63 0.30 0.14 0.48 0.12 0.37 0.15 0.13 0.15 9.47
West Virginia 5.15 0.70 0.70 0.70 0.75 8.00
Wisconsin 5.70 0.80 0.05 0.70 7.25
Wyoming 5.15 0.70 0.70 0.70 7.25
Table 1.2 (continued). Minimum Wage Summary
Panel B. Summary statistics by year
1/1/06 1/1/07 1/1/08 1/1/09 1/1/10 1/1/11 1/1/12 1/1/13 1/1/14 1/1/15 12/31/15
Mean 5.71 6.14 6.60 7.04 7.43 7.46 7.51 7.54 7.62 7.88 7.95
Std dev 0.82 0.94 0.72 0.55 0.35 0.39 0.45 0.48 0.53 0.71 0.79
Minimum 5.15 5.15 5.85 6.55 7.25 7.25 7.25 7.25 7.25 7.25 7.25
Maximum 7.63 7.93 8.07 8.55 8.55 8.67 9.04 9.19 9.32 9.50 10.50
Range 2.48 2.78 2.22 2.00 1.30 1.42 1.79 1.94 2.07 2.25 3.25
States above
federal min wage 18 30 33 28 15 18 19 20 22 30 30
Mean minus
federal min wage 0.56 0.99 0.75 0.49 0.18 0.21 0.26 0.29 0.37 0.63 0.70
Panel C. Measures of Minimum Wage Variation, January 2005-December 2015
Table 1.3. Descriptive Statistics for Regression Variables
Panel A.
Variable Mean Standard deviation Minimum Maximum
Outcomes (state-month allegation rates per 100,000)
All 27.48 14.44 1.13 181.75
Hiring 1.00 0.76 0 12.98
Firing 8.88 4.21 0 44.53
Private sector 22.23 11.89 0.84 178.85
Public sector 4.41 3.72 0 56.47
Age Discrim. in Employment Act 3.61 3.00 0 160.19
Title VII (non-retaliation allegations) 12.65 7.21 0 74.51
Title VII (retaliation allegations) 4.55 2.80 0 27.54
Americans with Disabilities Act 6.51 4.03 0 49.22
Minimum wage ($) 7.15 0.88 5.15 10.50
GSP/capita ($) 51,115 19,562 28,845 181,876
Proportion represented by union 0.121 0.054 0.028 0.272
Proportion female 0.507 0.008 0.531 0.477
Proportion white 0.772 0.136 0.246 0.963
Proportion Hispanic 0.105 0.987 0.008 0.480
Observations
6,119
Panel B. Average monthly allegation rates by state (per 100,000 labor force participants)
State Mean deviation Minimum Maximum Standard
Washington, DC 80.09 19.34 43.36 151.03
New Mexico 51.24 12.65 25.55 98.96
Delaware 44.34 10.71 17.90 92.80
Alabama 41.10 10.25 18.08 84.72
Iowa 43.64 7.49 26.84 64.16
Nebraska 42.18 11.55 25.27 94.62
Tennessee 41.37 7.34 26.03 67.50
Nevada 39.70 8.44 21.96 60.65
Indiana 35.54 5.77 21.75 49.52
Kansas 35.08 16.67 16.39 181.75
Colorado 34.83 11.20 14.44 116.92
Illinois 34.61 6.22 22.87 83.54
Arkansas 34.23 9.10 18.73 66.97
Connecticut 33.42 5.26 20.69 47.36
Florida 29.98 5.48 16.20 50.67
Missouri 29.78 5.32 17.40 40.37
Maryland 29.35 6.51 14.58 49.31
Oklahoma 28.18 7.30 9.45 45.24
Alaska 28.07 9.90 6.85 58.29
Georgia 27.80 4.72 13.80 42.69
Pennsylvania 27.77 3.99 18.38 37.20
Mean State 27.48 14.44 1.13 181.75
Ohio 25.95 3.04 18.36 37.38
South Carolina 25.89 4.28 17.04 38.79
Texas 25.79 4.51 14.38 44.95
Oregon 25.76 7.56 12.80 50.60
Utah 25.68 8.44 6.48 45.26
Mississippi 25.66 7.06 12.42 49.64
North Carolina 25.33 4.86 12.77 34.40
Maine 25.10 13.96 5.12 75.79
Massachusetts 24.97 3.61 16.05 36.21
Wisconsin 24.09 3.28 16.53 32.79
Hawaii 23.71 5.73 12.99 53.34
Rhode Island 23.59 9.47 8.01 61.04
Wyoming 22.54 10.16 5.00 53.14
Louisiana 22.06 5.15 9.92 34.17
Virginia 21.99 3.83 12.23 31.78
Minnesota 21.16 4.21 12.18 33.95
Michigan 16.97 2.69 9.95 22.66
Washington 15.99 2.98 9.06 24.05
Kentucky 15.94 3.33 9.34 33.06
North Dakota 14.86 7.69 3.27 39.39
Montana 14.31 4.52 5.86 25.59
Idaho 13.80 3.61 4.09 25.33
California 13.56 2.46 7.64 18.76
West Virginia 12.26 3.79 4.02 23.69
New Jersey 12.07 1.94 7.08 17.77
South Dakota 9.80 4.61 2.72 39.21
New Hampshire 9.73 3.22 3.36 19.91
Table 1.4. Hypothesis #1 Regression Results: Effects of logged minimum wages on the logged rate of all allegations (coeff/std error)
Panel A
(1) (2) (3) (4)
Minimum wage (log) 0.253 0.259 0.301* 0.340**
(0.208) (0.191) (0.156) (0.152)
Unionization rate 1.691* -0.881
(0.875) (1.132)
GSP per capita ($10,000) 0.072 0.056
(0.043) (0.056)
Proportion female -3.696 16.52
(7.859) (11.860)
Proportion white -0.740 1.765
(0.750) (1.102)
Proportion Hispanic -3.600 -4.299
(3.887) (5.349)
N (state-month clusters) 6,119 6,119 6,119 6,119
N (underlying individuals) 4,804,273 4,804,273 4,804,273 4,804,273
N (state-month obs=0) 0 0 0 0
R2 0.800 0.803 0.828 0.829
Average allegation rate 27.48 27.48 27.48 27.48
State and year fixed effects x x x x
State-month covariates x x
State-month time trend x x
Note: rate is logged and measured per 100,000 labor force participants. Fixed effects and time trend not reported. *p<0.10, **p<0.05, ***p<0.01.
Panel B. Mean labor force participants, mean monthly allegations, and predicted increase in
allegations (at elasticity of 0.340 and 10% minimum wage increase) for selected states and a hypothetical state with mean allegation rate and labor force size
Mean State Pennsylvania Oklahoma Maine
Mean allegation rate (per 100,000) 27.48 27.77 28.18 25.10
Predicted new allegation rate (per 100,000) 28.42 28.72 29.14 25.96
Mean labor force 3,026,054 6,399,366 1,772,729 698,241
Predicted increase in individual
Table 1.5. Hypotheses #2 and #3 Regression Results: Effects of logged minimum wages on logged rate of allegations, by selected discriminatory action and sector (coeff/std error)
(1) (2) (3) (4) (5)
Actions Sector
All
allegations Hiring Firing Private Public
Minimum wage (log) 0.340** 0.151 0.316** 0.323** 0.220
(0.152) (0.359) (0.132) (0.152) (0.338)
Unionization rate -0.881 1.197 -1.017 -0.712 -3.373*
(1.132) (2.326) (0.944) (1.096) (1.926)
GSP per capita ($10,000) 0.056 0.064 0.022 0.045 0.131
(0.056) (0.117) (0.035) (0.042) (0.207)
N (state-month clusters) 6,119 6,119 6,119 6,119 6,119
N (underlying individuals) 4,804,273 167,963 1,560,859 3,830,154 726,657
N (state-month obs=0) 0 217 1 0 79
R2 0.829 0.306 0.794 0.841 0.457
Average allegation rate 27.48 1.00 8.88 22.23 4.41