Melissa A. Denby. A Descriptive Study of IT Spending at Library and Information Science Programs. A Master’s Paper for the M.S. in I.S degree. April, 2016. 49 pages. Advisor: Aaron Brubaker
This study examines and compares how decentralized IT departments serving Library and Information Science (ILS) programs operate. An online survey was sent to 47
American Library Association (ALA) accredited ILS IT departments in the United States. Survey questions focused on demographics, budget, and current and future operations of the IT departments, along with perceptions of the respondents. Two programs emerged within the survey, those with an internal IT department within the ILS school and those with a hybrid mix of an internal IT department and support from central IT. The hybrid IT respondents were more macro focused and served several colleges within the
university. The internal IT respondents served larger populations, had more employees and student workers, and higher budgets in comparison to the hybrid IT respondents. Both groups had similar revenue sources and spending trends. Priorities and day-to-day operations differed among all respondents as each department had unique IT solutions.
Headings:
Information Technology
Information Technology – Economic aspects
Information Technology – Research
Information Technology – Management
Universities & Colleges
A DESCRIPTIVE STUDY OF IT SPENDING
AT LIBRARY AND INFORMATION SCIENCE PROGRAMS
by
Melissa A. Denby
A Master’s paper submitted to the faculty of the School of Information and Library Science of the University of North Carolina at Chapel Hill
in partial fulfillment of the requirements for the degree of Master of Science in
Information Science.
Chapel Hill, North Carolina
April 2016
Approved by
TABLE OF CONTENTS
LIST OF FIGURES ... 2
INTRODUCTION ... 3
LITERATURE REVIEW ... 5
METHODOLOGY ... 8
DATA COLLECTION ... 8
DATA ANALYSIS ... 9
RESULTS ... 10
DISCUSSION AND FUTURE RESEARCH ... 34
CONCLUSION ... 37
BIBLIOGRAPHY ... 39
APPENDIX A: SURVEY QUESTIONS ... 43
LIST OF FIGURES
Figure 1: Number of internal and hybrid IT departments ... 11
Figure 2: Current FTEs compared to future expectations ... 12
Figure 3: Current student employees compared to future expectations ... 14
Figure 4: Hybrid IT department employees compared to budget ... 17
Figure 5: Internal IT department employees compared to budget ... 17
Figure 6: Internal IT department budget allocations ... 18
Figure 7: Hybrid IT department budget allocations ... 19
Figure 8: Top five priorities in the next five years ... 21
Figure 9: Hybrid IT department: Top five priorities in the next five years ... 22
Figure 10: Internal IT department: Top five priorities in the next five years ... 23
Figure 11: Hybrid IT department time spent on instructional and research computing ....27
Figure 12: Internal IT department time spent on instructional and research computing ...28
Figure 13: Hybrid IT department perception of support ...29
Figure 14: Internal IT department perception of support ...29
INTRODUCTION
The value and impact of Information technology (IT) in Library and Information
Science (ILS) programs is difficult to measure with regard to their contributions within
their program and the university. This may be in part because the technology is primarily
used to speed up and improve current processes not eliminate them. Many ILS IT
departments are decentralized, or grouped within a larger college containing multiple
programs, further adding to the challenge of measuring their contribution. Though many
research studies have been conducted on IT in higher education, few have focused on
decentralized IT departments, their budgets, operations, or understanding their priorities.
In investigating decentralized IT departments in higher education, trends and differences
may be discovered that could inform future best practices.
IT influences almost every aspect of a college campus, from the facilities
operations to student and faculty email. It provides efficient processes for faculty and
staff, helps connect with prospective students and alumni, enables libraries to provide
services, and aids in research projects (Nunziata, 2014). Typically, 5 to 6 percent of an
institution’s operating budget goes to IT, which is an average of $906 for each student,
faculty, and staff according to a 2014 survey from Educause (Gartner, 2003 and Mendez,
2015). Central IT accounts for 75 percent of the total IT expenditure with the remaining
25 percent being spent by decentralized and academic administrative units (Gartner,
2003). Measuring the impact IT makes with these funds, especially for the decentralized
appear to reduce costs (Mendez, 2015). However, it is important to understand how funds
are used within decentralized IT departments to learn what areas are priorities and
what challenges they face. Do they have similar budget expenditures, priorities, and
challenges?
Expenses made locally in the IT departments budgets provide benefits outside
their department in other areas such as operations savings and service improvements
throughout the university (Mendez, 2015). Meanwhile, IT in higher education continues
to face budget cuts and decreased funding each year. Despite these cuts, expectations and
demand for new technology in classrooms, facilities, and libraries have put pressure on
universities and their IT departments (Gartner, 2003). CIOs and IT Directors are faced
with the difficult challenge of keeping costs down while still meeting the technology
needs of the universities (Mendez, 2015). For decentralized IT departments, these budget
cuts are particularly hard, and decisions about which priorities to focus on and what
services must be outsourced, shared, or reduced must be made. However, it is unclear
whether all decentralized IT departments are facing budget cuts or whether they are
making the same decisions regarding their budgets.
In addition to maintaining and updating the technological infrastructure, IT
service providers must demonstrate their value and contribution. As Green noted, “A key
responsibility of and challenge of IT leaders is to manage expectations and to
communicate the effectiveness of IT investments.” (Green, 2015). University leaders
should feel confident that they are spending their IT budget effectively and strategically.
However, only 64 percent of IT staff viewed IT investment used to support library
for information systems and instruction, 55 percent for student services, and 53 percent
for academic support services (Leadership Board for CIO’s in Higher Education 2012).
IT spending should align with the “institutional and departmental strategic plans”
(2014 Core Data Survey Highlights 2014). More money does not always mean a higher
impact. IT needs to spend strategically for the greatest return on investment—to
essentially work smarter, not harder. The first step is to evaluate and assess their current
investments because “Without a commitment to evaluating investments in innovation, we
can’t know what works.” (Gartner, 2003). Unfortunately, less than 30 percent of public
and research universities currently assess their performance in identified IT priority areas,
according to a 2014 survey (Green, 2015). IT budgets and practices should be compared
between peers to both evaluate and compare against each other, as well as learn from
other departments practices (The EDUCAUSE Core Data Service Trends Almanac,
2014).
To this end, I propose surveying and comparing ILS IT departments from
universities throughout the United States. In comparing the budget expenditures,
operations, and priorities of ILS IT departments a better understanding may be gained
and this knowledge used for future decisions and research.
LITERATURE REVIEW
Numerous research studies have been done to identify the top issues and priorities
for IT in higher education. One of the biggest issues is budget, “as more than 60% of
institutions report their institutional budgets decreasing or staying the same” (Leadership
IT department’s impact and effectiveness. Some strategies have suggested stretching the
IT budget by increasing fees, selling services, collaborating with other institutions, using
more open source resources, and/or simply cutting certain services. However, “…cuts in
IT should not be across the board — they should align with institutional and departmental
strategic plans.” (Leadership Board for CIO’s in Higher Education 2012).
One article suggested developing funding models “that sustain core service,
support innovation, and facilitate growth” (Dunlap, 2015). It is a delicate balance to both
support innovation, be responsive to users, and maintain current technologies when the
majority of IT budgets are fixed costs. Funding for maintenance and renewing existing
technologies are competing with funding for new technologies like the cloud and mobile
development. A 2004 ECAR Research study found that 69 percent of public institutions
(of those that responded to the study) lacked sufficient funds to keep up with maintenance
for current IT.
The majority of research studies focus on centralized IT departments, making it
challenging to interpret this information for decentralized IT departments, such as those
found in The University of North Carolina at Chapel Hill ILS program. ILS IT
departments contain attributes of both IT departments and academic libraries and face
challenges that of both. Decentralized doctoral level institutions have a harder time
managing their total IT spending and note it as a serious problem (EDUCAUSE Center
for Applied Research 2004). From an academic library perspective, The Association of
College and Research Libraries (ACRL) listed the number one trend affecting academic
With so much concern over budget, choices must be made each year about which
priorities receive funding and what to ignore. This can be a daunting task since spending
on IT affects teaching, learning, and research on campus (Miller, 2009). According to a
2015 survey by EDUCASE, the top ten priorities in higher education are:
1. Hiring and Retaining Qualified Staff
2. Optimizing the Use of Technology
3. Developing IT Funding Models
4. Improving Student Outcomes
5. Demonstrating the Business Value of IT
6. Increasing the Capacity for Managing Change
7. Providing User Support
8. Developing Security Policies for Mobile and Cloud
9. Developing an Enterprise IT Architecture
10. Balancing Agility, Openness, and Security
Another source characterized the top priorities as instruction, staffing, and user support
(Green, 2015). However, there is a lack of information about whether these priorities
align with decentralized IT departments or ILS programs. It may be that the institutional
or departmental vision of ILS programs differs from that of a centralized IT department
that serves the entire university.
Since there is a lack of information about decentralized IT departments
concerning budget expenditures and trends to meet the IT needs of students, faculty, and
staff, as well as the vision and priorities of their ILS program, this is an area that should
departments to better understand their operations and learn from their perceptions.
(Standards for libraries in higher education 2011).
METHODOLOGY
This study seeks to understand how IT resources and budgets are used in Library
and Information Science programs in higher education within the United States. This
study solicited the perceptions of ILS IT departments on their current demographics,
operations, and priorities. To gather this information, an online survey was created and
sent to the person(s) who provide IT support for the ILS program. Checkbox, percentage
totaling, and simple yes/no questions provided quantitative information about
demographics, resources, and department budgets. Open-ended questions with comment
boxes and text boxes allowed the respondents to further explain their repsonse(s). The
following sections describe the methods used to design, conduct, implement and analyze
the data collected by this survey.
DATA COLLECTION
A list of 46 universities with accredited Library and Information Science (ILS)
programs in the United States was used from the American Library Association (ALA)
website. The names of the IT provider(s) was gathered by exploring ILS websites, and in
the majority of cases, contacting the ILS program or university IT department by phone.
The survey was created using the Qualtrics online survey tool and the questions
were reviewed by Aaron Brubaker, SILS Director of IT, Dr. Wildemuth, Dr.
for relevance and applicability. The Institutional Review Board of the University of
North Carolina at Chapel Hill approved the survey and it was sent out on Monday,
February 22nd, 2016. A second iteration of the survey was sent out on February 25th to
those participants who did not respond to the initial survey. The survey consisted of 21
questions and all respondents were de-identified. Of the 46 programs selected, 12
surveys were started and 11 were completed. The sample collected may have a possible
bias based on the role of the IT provider for each university. For example, it is possible
that those ILS programs with a local or internal IT department may have responded more
than those with IT provided by a larger centralized IT department that provides support
for several schools. Another bias may have been introduced through contacting and
speaking on the phone to an IT provider at some universities, which may have elicited a
higher response in comparison to those IT providers not contacted via phone.
The survey (see Appendix A) was divided into four sections. The first section
asked about demographics; whether their IT was provided by a central IT department or a
mix of an internal and central IT department, the number and type of employees, the
number of students served and annual budget. The second section asked about current
and future budget priorities. The third section focused on current and future departmental
resources, priorities and practices and the final section asked the respondents for their
perceptions on the state of their IT department.
DATA ANALYSIS
The email survey was sent out twice in one week, with the second email sent to
responses. The response rate for each question differs and is listed after each question.
Once the survey was closed, all data was exported into a non-coded .csv file along with a
report from Qualtrics. The csv file was examined in Excel and compared to the Qualtrics
report to gather a complete understanding of the data. As a result of examining the data,
two categories of ILS IT departments emerged based on the respondents answers to
question one of the survey: programs with internal IT departments and programs with IT
provided by a hybrid of both central IT and an internal IT department. This allowed the
similarities and differences to be analyzed by categories and by overall answers of the
respondents. A second reading of the data provided a snapshot for each ILS IT
department and was the basis for the discussion section of this paper. The qualitative data
was labeled and grouped by each respondent’s answer. The final comments at the end of
the survey have been used as a measure for satisfaction and suggested improvements of
this survey.
RESULTS
This section presents the results of the survey in the following sections:
demographics, budget, current and future operations, and perceptions.
DEMOGRAPHIC DATA
Question one through six asked the respondents to identify their IT department as
an internal IT department or a hybrid mix of both central IT and an internal IT
demographics are then compared based on the type of IT department they identified as
their ILS program as operating.
Question 1: Is information technology (IT) for your university’s Library and
Information Science program provided by an internal IT department or a hybrid of central
IT and an internal IT department? (11 responses)
Of the 11 respondents, six responded “Internal IT department” while five
responded “Hybrid of a central and an internal IT department”.
Type of IT Department Number of Responses Internal IT Department 6
Hybrid IT Department 5
Figure 1: Number of internal and hybrid IT departments
The purpose of this question was to divide the participants into two categories to
explore the similarities and differences between ILS programs that have an internal IT
department and those programs with a hybrid mix of both central IT and an internal IT
department.
Question 2: How many FTEs (full-time equivalents) are currently employed in
your IT department? (11 responses)
Overall, six internal and five hybrid IT departments responded and their answers
varied widely from zero to eight. However, when internal IT departments were compared
to hybrid IT departments, internal IT departments employed more full-time staff. The
number of full-time employees may indicate the size of the ILS program and can be later
compared to other demographic questions.
In interpreting the responses of the different IT departments, it may be easier for
program. Hybrid IT employees may split their time between places as evidenced by one
hybrid IT department employing 0.5 employees. In other cases, several employees in a
hybrid department may share the duty for serving the ILS department, as suggested by
the response of one hybrid IT department with seven full-time employees to support their
ILS program.
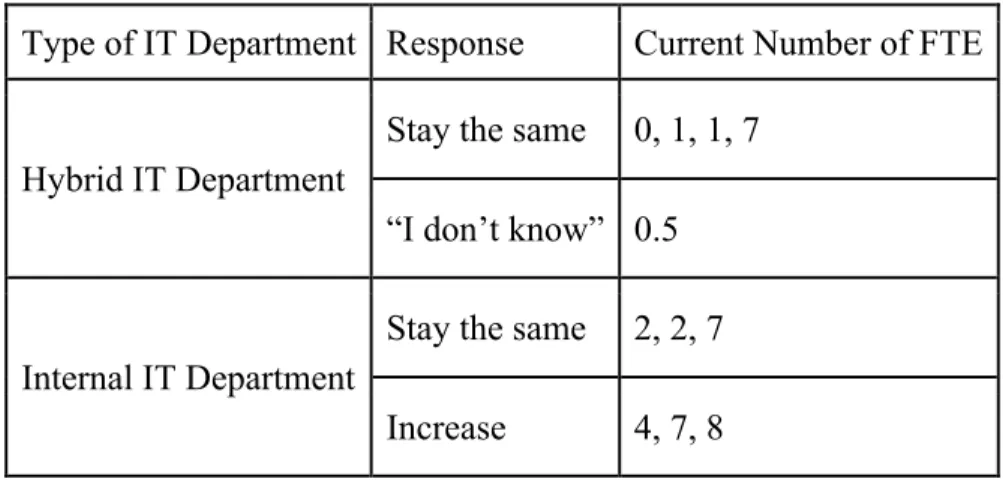
Question 3: Do you expect your full-time IT employees to increase, decrease, or
stay the same? (11 responses)
Type of IT Department Response Current Number of FTE
Hybrid IT Department
Stay the same 0, 1, 1, 7
“I don’t know” 0.5
Internal IT Department
Stay the same 2, 2, 7
Increase 4, 7, 8
Figure 2. Current FTEs compared to future expectations
Overall, three responded “Increase”, seven responded “Stay the same”, and one
responded “I don’t know”. In comparing the two groups, four hybrid IT departments
responded “Stay the same”, and one responded “I don’t know”. Three internal IT
departments responded “Stay the same”, while three responded “Increase”.
There does not seem to be a correlation between current number of full-time
employees and whether there will be an increase or “Stay the same”. However, only the
internal IT departments responded with the expectation that full-time employees will
challenging to estimate the amount of time a full-time employee will be devoting to
supporting the ILS department.
Question 4: How many student employees are currently employed in your IT
department? (11 responses)
Answers ranged widely from 0 to 15 student employees. Two hybrid IT
departments currently employee zero students, one responded that they employee 1.5
students, another has ten student employees, and one responded “I don’t know”. Three
internal IT respondents had lower numbers of student employees, with one responding
one student employee, another answering two, and the third responding four. The other
three internal IT departments reported having nine, ten, and 15 students employees.
The discrepancy between the internal and hybrid responses once again may be
due to the ease of counting internal student workers. The hybrid responses, “0”, “1.5”,
and “I don’t know” may be due to how challenging it is to quantify the number of
students with a large department that serves several programs within a larger college.
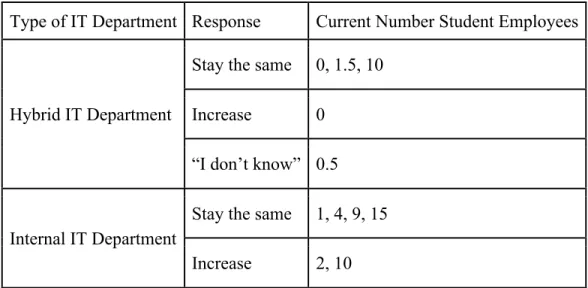
Question 5: Do you expect your student IT employees to increase, decrease, or
stay the same in the next year? (11 responses)
Of the eleven respondents, seven expect to keep the same number of student
employees next year. Three responded “Increase” and one hybrid IT department
responded “I don’t know”. The hybrid departments had three participants respond “Stay
the same”, and one responded “Increase”. Of the internal respondents, four responded,
Type of IT Department Response Current Number Student Employees
Hybrid IT Department
Stay the same 0, 1.5, 10
Increase 0
“I don’t know” 0.5
Internal IT Department
Stay the same 1, 4, 9, 15
Increase 2, 10
Figure 3. Current student employees compared to future expectations
It is interesting to compare the current number of student employees with the
future expectations of the IT department. By employing more or less student employees
may indicate whether the IT department’s budget is growing or shrinking and affecting
their ability to pay for more employees. Though if student workers are increasing and
full-time employees are decreasing, the it may be an indicator that the department and
budget is shrinking. However, only one respondent answered that they expected full-time
employees to decrease and their student employees are not expected to change.
One of the hybrid respondent that replied “Stay the same”, currently has no
student workers. One responded “I don’t know” and has 0.5 student employees.
Interestingly, the other two hybrid responses, ten and 1.5, may be due to the respondents
counting student employees in their IT department differently. There may be ten students
that work serving multiple departments including ILS, while the other respondent may
have counted the time students spent supporting ILS. The two internal IT departments
(1200, 1100). However, they differ in the number of student employees that they
currently employ (two and ten respectively).
Question 6: Approximately, how many students, faculty, and staff are served by
your IT department? (10 responses)
Responses ranged from 0 to 1200 students, faculty, and staff served. The five
hybrid IT departments responded and reported serving 0, 60, 180, 250, and 500 students
faculty, and staff. The five internal IT departments served larger populations with
respondents reporting 370, 500, 750, 1100, and 1200 students, faculty, and staff.
The hybrid participant that answered zero, also answered zero for the number of
faculty and students employed and appears to be an online school. The higher number of
students, faculty, and staff suggest a larger ILS program and may be why there is an
internal IT department.
BUDGET DATA
This section asked the IT departments questions about their current budget, how it
has changed over time, and their expectations for their future budget. Questions also
requested infrastructure on revenue sources and current expenditures to discover if there
were trends among IT departments.
Question 7: What is your annual budget for your IT department? (7 responses)
This question did not have many responses from either hybrid or internal IT
departments. Of the four hybrid departments that responded, two reported their budget as
zero. The other two hybrid respondents answered “varies” and the other responded that
responded had higher budgets in comparison to the hybrid IT departments. One reported
a budget of $600,000, another reported $225,000, and the third respondent reported an
annual budget of $175,000.
Perhaps this information is difficult to find or in the case of hybrid departments; it
may be challenging to parse out funds for a specific department. This may be the case for
one of the hybrid IT departments that responded zero for this question and has 0.5
full-time staff with 1.5 student employees. The other respondent that answered zero is a
hybrid IT department that supports the online ILS school.
Question 8: Has your IT budget increased, decreased, or stayed the same in the
past year? (10 responses)
Overall, four participants responded that their budgets “Stayed the same” in the
past year. Two said their budgets “Increased” while three responded their budgets
“Decreased”. Of the hybrid IT departments, three answered “Stay the same”, one
“Decreased” and one “Increased”. Confusingly, the program that answered their budget
“varies” expects it to “stay the same” next year. For the internal IT departments, one
responded “Stay the same”, two responded “Decreased”, one responded “Increased” and
finally one responded “I don’t know”.
The purpose of this question was to find if there was trend in budgets increasing,
staying the same, or decreasing among ILS IT departments. However, there does not
seem to be a trend based on these respondents. Additionally, of those IT departments that
reported a decrease, or increase in budget, it was investigated whether the number of
Population Size FTEs Student Employees Budget Budget Change 60 1 – Stay the same 0 – Increase $60,000 Increased 500 7 –Stay the same 10 – Stay the same NA Decreased
Figure 4: Hybrid IT departments employees compared to budget
The hybrid IT department that serves a population of 60, with one full-time
employee, and no student workers with a $60,000 budget has seen a budget increase. It
also expects to keep the same number of FTEs, while adding a student employee. The
hybrid IT department that has seen a decrease in budget does not expect to change the
number of FTEs or students it currently employees.
Population Size FTEs Student Employees Budget Budget Change 1100 7 – Increase 2 – Increase $225,000 Increased 1200 2 –Stay the Same 10 – Increase $600,000 Decreased 370 2 –Stay the Same 4 –Stay the Same $175,000 Decreased
Figure 5: Internal IT departments employees compared to budget
The internal IT departments IT department that responded “Increase”, serves a
population of 1100, with seven FTEs, two student employees, and a budget of $225,000.
With the budget increase, it expects to add more FTEs and student employees in the
future. One of the internal IT departments that reported “Decrease” currently has a budget
of $600,000 with a population of 1200, two FTEs, and ten student employees. It does not
expect to change the number of FTEs and plans to increase the number of student
employees. The other internal IT department that responded “Decrease” reported a
budget of $175,000 and supports a population of 370 with two full-time staff and four
student workers. Despite the budget decrease, this department does not expect to change
Question 9: How much of your budget is allocated to the following. Please
provide your best estimate as a percentage below. ( 11 responses)
This question was more complicated for the participants and though it received 11
responses many indicated zero in every category. Four of the six internal IT departments
answered and only one hybrid IT department. Of those that responded “Personnel” was
ranked highest, followed by “Hardware”, “Services”, “Software”, and “Other”. Notable
responses in for the hybrid departments are a frustrated sounding “Doesn’t work that
way” response while one internal respondent entered zero in each category and
commented “Combination”. The online hybrid IT department indicated zero in each
category.
Personnel Hardware Software Services Overview of IT Department
40% 25% 18% 17% Population:1200,
Student Workers: 10 –Increase FTEs: 2 –Stay the Same Budget: $600,000 –Decreased
0% 50% 20% 30% Population:1100
Student Workers: 2 –Increase FTEs: 7 –Stay the Same Budget: $225,000 –Increased
60% 20% 10% 10% Population: 370
Student Workers: 4 –Stay the Same FTEs: 2 –Stay the Same Budget: $175,000 –Decreased
0% 0% 0% 0% Population: 500
Student Workers: 15 –Stay the Same FTEs: 7 –Stay the Same Budget: 0 –Stay the Same
Personnel Hardware Software Services Overview of IT Department
65% 20% 10% 5% Population: 60
Student Workers: 0 –Increase FTEs: 1 –Stay the Same Budget: $60,000 –Increased
Figure 7. Hybrid IT department budget allocations
Question 10: Please indicate the main sources of revenue for your IT budget as an
approximate percentage. (7 responses)
Overall, three hybrid IT departments and four internal IT departments responded
to this question. One hybrid respondent listed “100%” of their revenue as coming from
“Operating Appropriation to Central IT”, which seems unlikely based on answers to
question one. In reviewing this respondent’s previous answers, they have provided the
minimum amount of information for every question making it difficult to discern a full
picture of their IT department. “Operating Appropriation to Central IT from Institutional
Budget” was listed as 90 percent on one programs revenue with 10 percent from “Internal
Grants”. Another hybrid IT program reported 20 percent of their revenue from
“Operating Appropriation to Central IT from Institutional Budget” and 80 percent from
“Program Operating budget and internal grants”.
Of the internal IT departments, two responded that 100 percent of their revenue
came from “Other” sources, one from “Online Tuition” and the other from “Lab Fees,
College Budget, Grants”. Of the other two that answered, one responded that 95 percent
of their revenue came from “Direct state allocation for general operating costs” with 5
percent from “Student Technology Fees”. Another responded that 60 percent of their
revenue came from “Student Technology Fees”, 20 percent from “External Grants,
operating costs”. Interestingly, no respondent listed “Chargebacks”, “Resale of
Services”, or “Direct state allocation for specific technology expenditures” as a source of
revenue.
CURRENT AND FUTURE OPERATIONS DATA
This section explores the current operational infrastructure and priorities of each
IT department as well as asks about future priorities within each ILS IT department to
compare and contrast their practices.
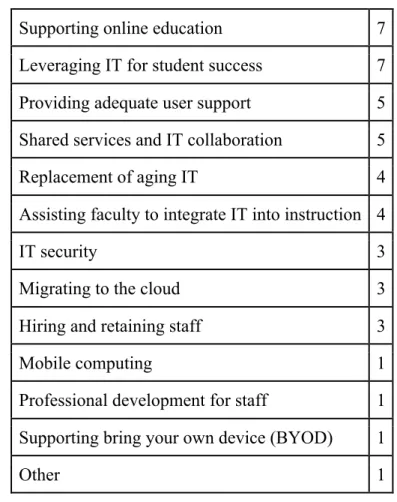
Question 11: What are your top five IT priorities in the next five years?
(11 responses)
Overall, “Supporting online education” and “Leveraging IT for student success”
were selected seven times, followed by “Providing adequate user support” and “Shared
services and IT collaboration” with five selections. “Assisting faculty to integrate IT into
instruction” and “Replacement of aging IT” were both selected four times, while “Hiring
and retaining staff”, “IT Security”, and “Migrating to the Cloud” were each selected three
times. “Mobile computing”, “Professional development for staff” and “Supporting bring
your own device (BYOD)” rated low for both internal and hybrid IT departments and
Supporting online education 7
Leveraging IT for student success 7
Providing adequate user support 5
Shared services and IT collaboration 5
Replacement of aging IT 4
Assisting faculty to integrate IT into instruction 4
IT security 3
Migrating to the cloud 3
Hiring and retaining staff 3
Mobile computing 1
Professional development for staff 1
Supporting bring your own device (BYOD) 1
Other 1
Figure 8: Top five priorities in the next five years
As the chart below indicates, the top priority for hybrid IT departments was
“Leveraging IT for student success”, followed by “Supporting online education” and
“Replacement of aging IT”. The respondent that selected “Other” did not list any
priorities in the text box provided. One hybrid respondent only selected “Supporting
Leveraging IT for student success 4
Supporting online education 3
Replacement of aging IT 3
Hiring and retaining staff 2
Providing adequate user support 2
Mobile computing 1
Supporting bring your own device (BYOD) 1
IT security 1
Shared services and IT collaboration 1
Professional development for staff 1
Shared services and IT collaboration 1
Other 1
Migrating to the cloud 0
Figure 9. Hybrid IT Departments: Top five priorities for in the next five years
As a hybrid department supporting multiple departments or colleges within the
university it makes sense that the focus would be on higher level services. “Assisting
faculty to integrate IT into instruction”, “Professional staff development” and “Shared
services and IT collaboration” as more granular goals are lower priorities for this group.
“IT Security” was also listed as a lower priority and may be the responsibility of Central
IT for these universities.
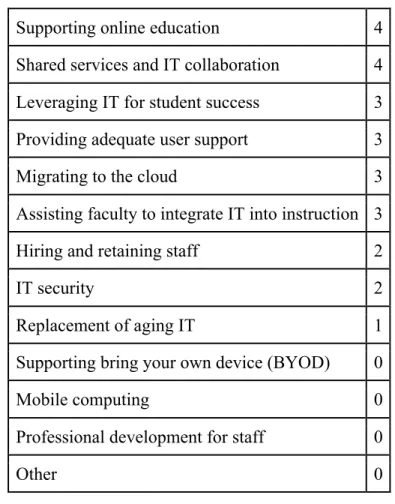
The top priorities for the internal IT departments are “Supporting online
education” and “Shared services and IT collaboration”. However, this may be skewed
somewhat from one ILS program operating completely online. “Professional
listed “Migrating to the cloud” as a priority, though none of the hybrid IT departments
listed it a priority.
Supporting online education 4
Shared services and IT collaboration 4
Leveraging IT for student success 3
Providing adequate user support 3
Migrating to the cloud 3
Assisting faculty to integrate IT into instruction 3
Hiring and retaining staff 2
IT security 2
Replacement of aging IT 1
Supporting bring your own device (BYOD) 0
Mobile computing 0
Professional development for staff 0
Other 0
Figure 10. Internal IT Departments: Top five priorities in the next five years
Other priorities such as “Assisting faculty to integrate IT into instruction” and
“Providing adequate user support” along with the focus on IT collaboration and shared
services suggest that internal IT departments are focused on supporting their population’s
IT needs over some of the more global priorities that the hybrid IT respondents’ chose.
Question 12: What is your fastest growing IT budget item in the next three years?
(8 responses)
Of the eight responses, two answered, “Hardware and/or software maintenance”
“Staff compensation” as their fastest growing budget item. One answered “Contract
services and software development”, one selected “Other” and wrote “Cloud Services” in
the text box. “Network equipment” and “Staff training” were not selected by either
internal or hybrid IT departments.
Both internal and hybrid IT departments selected the same items, with the
exception of “Contract services and software development”, which was selected by a
hybrid IT department. “Cloud Services” was selected by an internal IT department, who
also listed it as a priority in the previous question.
Regardless of whether budgets decrease, or priorities among IT departments
differ, maintaining the current hardware and/or software as well as updating aging
hardware/software will remain an important task.
Question 13: Do you outsource any IT functions? Please select all that apply.
(10 responses)
Overall, five internal and five hybrid IT departments responded. Three outsourced
“Email”, two responded “No, we do not outsource any IT functions”, and one outsourced
“Help Desk/System Administration”. The majority responded “Other” and filled in the
functions that their department outsourced. No participant outsourced “IT Support”,
“Security”, or “Training”.
Of internal IT departments one responded “No, we do not outsource any IT
functions”, two responded “Email”, one responded “Other”. “Other” listed “Some web
development” in the text box. One of the participants selected both “Email” and “Other”,
Three hybrid IT departments selected “Other”, one of which further clarified by
answering “All our IT support is provided by the university IT and eLearning
departments. Our program has no internal IT staff at all.” The second respondent that
answered “Other” simply stated “We collaborate with Central IT”, while the third
answered “Blackboard collaborate (part of campus license), printer service”.
Aside from “Email” which was listed three times by internal IT departments,
there are no trends in the functions that are outsourced by either internal or hybrid IT
departments. Each seems to rely on central IT for various functions, perhaps based on the
skill set of its employees or services that are licensed to central IT.
Question 14: What hosting services do you use? Are they internal or external to
the university? (8 responses)
Five internal and three hybrid IT departments responded with majority using both
internal and external services. No two respondents listed the same hosting service with
the exception of Microsoft Office 365. Only two respondents use internal servers
exclusively. Each IT department had a unique blend of internal and external web hosting
services.
Of the hybrid IT departments, only three responded, one of which use internal and
two that use both internal and external hosting services. The services that are used
internally are “ShareStream, course level virtual servers”. The respondents that answered
both said, “Varies; both”, and “Internal: email and classroom capture. External LMS for
online courses, web conferencing”.
The internal IT departments varied in their answers, with only one responding
externally, “The central IT unit on campus runs the virtualization infrastructure for our
virtual servers. These are internal to the University. Starting this year the University will
be moving to Microsoft-hosted email and personal storage options with Office 365
(external).” One respondent reported using LAMP servers internally and Hosted
Wordpress externally. Another internal IT department participant that responded that they
used both internal and external hosting services, internally they used remote desktop
services web hosting and fileservers, while externally they used Microsoft Office 365
email and VPN. The final respondent used several services both internally and externally,
“cloud virtual machines, servers; high performance computing; AWS; Azure; several
Web hosting services”.
Question 15: This question was a series of three short “Yes” or “No” questions
about the level of support provided within each IT department for classrooms, computers
and mobile devices.
15a. Do you equip and support your own classrooms? (11 responses)
Overall, nine responded “Yes” and two responded “No”. The two participants that
responded “No” were hybrid IT departments.
15b. Do you support multiple platforms for computers? (11 responses)
All responded “Yes” for this question.
15c. Do you support multiple platforms for mobile devices? (11 responses)
All responded “Yes” for this question.
That hybrid IT departments do not equip or support classrooms is consistent with
their responses in the demographic section. Hybrid IT departments were more globally
All respondents currently support multiple platforms and devices, perhaps
because faculty, staff, and students are increasingly using a variety of platforms in
computers and mobile devices.
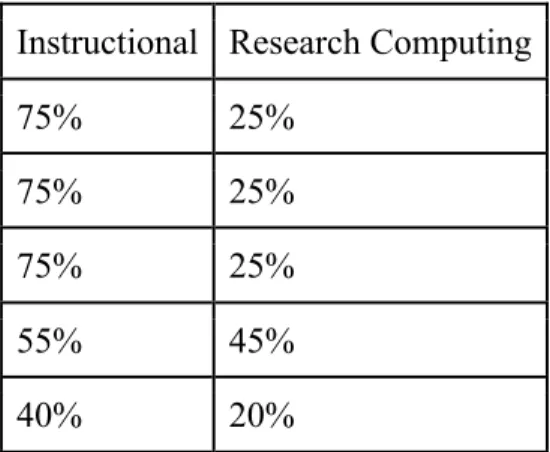
Question 16: How much time do you spend supporting instructional computing
and research computing? Please list an approximate percentage. (9 responses)
Four hybrid and five internal IT departments responded to this question. All
respondents, both internal and hybrid, had a mix of instructional and research computing,
with instructional computing occupying the majority of the time. A couple of respondents
made mathematical errors that added their percentages to either more or less than 100%.
One hybrid respondent spends “100%” of their time on instructional computing
and another spends “95%” on instructional and only “5%” on research computing. The
other two respondents spent “75%” on instructional computing and “40%” on research
computing, and “65%” on instructional computing and “5%” on research computing.
Instructional Research Computing
100% 0%
95% 5%
75% 40%
65% 35%
Figure 11. Hybrid IT department time spent on instructional and research computing
Of the internal respondents, three spent “75%” of their time on instructional
computing and “45%” on research computing. The other spent “40%” on instructional
computing and “20%” on research computing.
Instructional Research Computing
75% 25%
75% 25%
75% 25%
55% 45%
40% 20%
Figure 12. Internal IT department time spent on instructional and research computing (as a percentage)
Hybrid IT departments spent somewhat less time on research computing in
comparison to the internal IT departments, though the internal IT departments had more
of a consensus on how their time was spent. This information is also consistent with the
demographic date from the first section of questions, the internal IT departments are more
locally or granularly focused on user support while the hybrid IT departments globally
support the needs of the ILS programs.
PERCEPTIONS DATA
This section asks the respondents perceptions and opinions concerning the how
their IT department operates, and how funds would best be spent. The final two questions
ask the participants if they would be open to a phone interview and allowed the
respondents to add any comments about the survey.
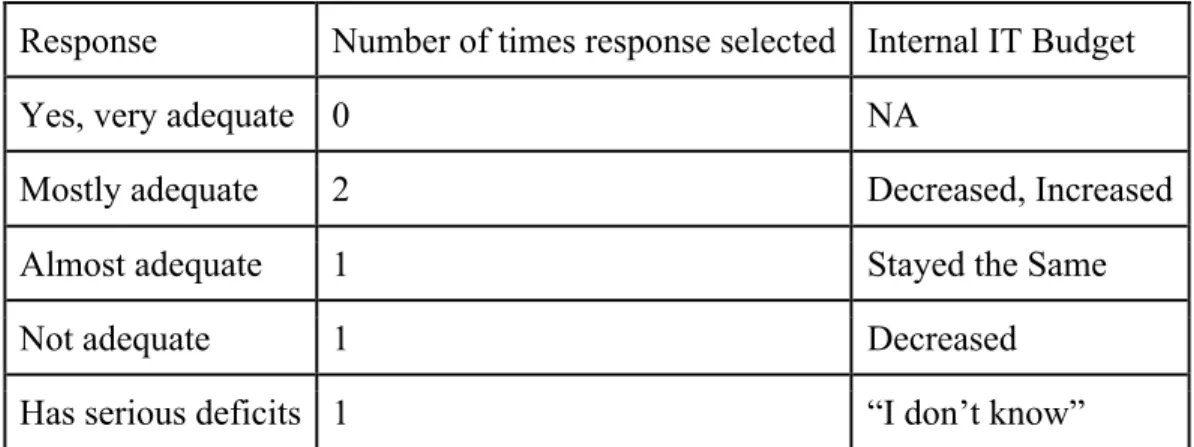
Question 17: Do you feel that investment in IT services in your department is
Overall, five each of internal and hybrid IT departments responded to this
question. One hybrid each selected “Yes, very adequate”, “Mostly adequate”, and
“Almost adequate”. Two responded “Not adequate” and no hybrid IT departments
responded “Has serious deficits”. For the internal IT departments, none responded “Yes,
very adequate”, two responded “Mostly adequate”, and one each selected “Almost
adequate”, “Not adequate”, and “Has serious deficits”.
Response Number of times response selected Hybrid IT Budget
Yes, very adequate 1 Decreased
Mostly adequate 1 Stayed the Same
Almost adequate 1 Increased
Not adequate 2 Stayed the Same
Has serious deficits 0 NA
Figure 13. Hybrid IT department perception of support
Response Number of times response selected Internal IT Budget
Yes, very adequate 0 NA
Mostly adequate 2 Decreased, Increased
Almost adequate 1 Stayed the Same
Not adequate 1 Decreased
Has serious deficits 1 “I don’t know”
Figure 14. Internal IT department perception of support
In comparing the responses of the departments with how their budgets changed,
no trends emerge for either the internal or hybrid IT respondents. It would make sense for
adequate”. Though it may be in the case of “Stayed the Same” that the budget has been
consistent and recourses have continued to be “Almost adequate”, “Mostly adequate” or
“Not adequate”. One hybrid IT department with a budget decrease responded that their
resources are very adequate, while another that saw an increase in budget still feels it is
only “Almost adequate”. Two internal IT departments felt that resources were “Mostly
adequate” though one had a decrease and one an increase in budget. The reasons behind
why the respondents selected their answers is explored in the next question.
Question 18: Would you like to discuss your choice? (7 responses)
Three hybrid IT departments and four internal IT departments chose to comment
further on their answer in question 18. Only one of the hybrid IT respondents that
selected “Not adequate” chose to comment further saying, “We have no departmental
control or access to IT services except what we can fund from our general operating
budget. All dedicated IT and online learning support at this university is centralized. We
are too small to support a full time departmental IT person. Faculty explore and solve
their own IT teaching and research challenges. We don't have any labs - we are 100%
online.”
One hybrid IT department responded “Almost Adequate” and commented, “We
could always use more funding, however our director works very hard to ensure that
everyone has the tools they need to succeed. I cannot think of instances where faculty
wanted to use technology in the classroom for a specific purpose and were not able to
because of lack of funding.” The hybrid department respondent that said “Mostly
adequate” commented, “We generally get what we need if we are persistent and political
The one internal IT respondent that selected “Not adequate” wrote, “We have a
very small IT staff (2) and have exhausted most ways of streamlining systems and
reducing costs. As our budget continues to decrease it will impact the types of support we
can provide and the software we make available. We will strive to protect spending on
academic and student systems, but there will be an impact for the School as a whole,
including extending the replacement life cycles of equipment and reducing the number
and types of software licenses purchased. Classroom technology upgrades will occur at a
slower rate. More time will likely be spend on triaging day-to-day problems and less time
on proactive action, strategic planning and focusing on providing higher value to the
School.”
The two “Mostly adequate” internal respondents said, “Have had a excellent
budget in funding prior to the Fall 2015 semester. Budget cuts have hit our school and
campus very hard this year and we have been cutting back substantially. It is unclear
what budget we will have next year, but we are holding off on hardware purchases and
hiring additional staff [likely] until Fall 2017.” And the other responded, “There is,
always demand for more and better everything, and we can't do everything.”
Finally the one internal IT department that reported a “Has serious deficits”
commented, “We are currently understaffed and need more diversity in what our staff
knows. We have recently lost multiple administrators, leaving a gap in some of our
services.”
The respondents that felt resources were less than adequate focused on three
concerns: lack of funding or decreased budgets, lack staffing, and lack of classroom
literature review and affect the IT department from hiring more staff, providing adequate
classroom support, or other priorities reported in question 11, such as replacing and
maintaining hardware and/or software.
Question 19: Where would you invest additional unrestricted IT funds to most
benefit your school or program? (6 responses).
This was an open-ended question with four internal IT departments and two
hybrid department responding. Staffing was mentioned three times, hardware two times,
and training and user support were mentioned once.
The two hybrid IT departments responded training and “Hardware/software”
specifically licensed services. Of the four internal IT departments, one mentioned
hardware, two staffing, one user support and “custom applications development.”
Type of IT Department Investment
Hybrid Hardware/software
Hardware/software
Internal
Hardware Staffing Staffing
User support
“custom applications development”
Figure 15: Investment in IT services
The answers to this question are once again aligned with the priorities from
question 11 as well as the areas that were lacking support in question 18. In addition, this
also aligns with the overall focus of each internal and hybrid IT group. Hybrid IT
departments are, as noted earlier, more globally focused in their support and as such
internal IT departments are more concerned with supporting the students, faculty, and
staff and listed those items as priorities in question 11. This further shows that user
support is important for internal IT departments.
Question 20: Would you be open to a short phone interview if further information
is needed? (11 responses)
Five respondents answered “Yes” while six declined a short phone interview. No
phone interviews were not conducted as part of this survey, since relevant information
was gathered during phone conversations with the IT departments while searching for
participants to email the online survey .
Question 21: If you have any comments about this survey, please enter them here
and click Submit to complete the survey. (3 responses)
Only three respondents, two hybrid and one internal department, had comments
about the survey. One hybrid respondent attempted to be helpful, “Will you be sharing
results with respondents? I'm not sure who all you contacted but if you'd like to contact
others in our department that can answer budget and other questions better I'd be happy to
provide their contact info.” This respondent felt that investment was very adequate and
focused its resources on “Instructional” services however, as the respondent noted, did
not have information about their budget.
The hybrid department that commented that their school has “...no internal IT
staff at all” responded that investment in the IT department is “Not adequate”. They
further commented, “This survey does not reflect the reality of the situation at smaller
circumstances. As such I don’t think the survey will collect an accurate picture of the IT
support situation across all accredited MLIS programs.”
Only one internal department that responded “Mostly adequate” to describe the
level of investment in their department and felt that, “There is always demand for more
and better everything, and we can't do everything. “Another respondent commented,
“The survey was very clear but at the same time was very constraining. There was no
opportunity to provide additional info. that might be important on each question. For
example, you asked about staffing and I only could enter a number. But I couldn’t say
that we have another 3 non-IT unit staff that support our online education program, or on
the budget question what is included in my specific budget vs. what IT related things are
funded from other budgets or units in the school. So this is not complete if you want to
make comparisons between different institutions.”
DISCUSSION AND FUTURE RESEARCH
This section discusses some of the important findings of this survey as well as the
challenges of interpreting the results. It also proposes future research into better
understanding IT departments in higher education.
The online survey results show that, of those participants that responded, the
internal IT department respondents served larger populations, employed more full-time
staff and student workers, and had higher budgets in comparison to the hybrid IT
department respondents. Larger ILS programs with more resources, students, and
faculty/staff justified having an internal IT department devoted to the priorities and
The online survey divided the ILS IT departments into internal and hybrid IT
departments, however all IT departments relied on central IT in some form. Those
respondents that identified their department as a hybrid differed from each other in that
some were IT departments that supported multiple programs within a larger college in the
university, while others were small ILS IT departments with full-time employees that
provided a narrow group of services with heavy support from central IT. Perhaps this
question could have been expanded to further understand the structure of each ILS IT
department.
Many of the respondents found it challenging to report on budget questions,
which may have been due to the survey respondent not having access that information. In
the case of the hybrid respondents they had the challenge of separating the ILS program
budget from other programs. Hybrid IT departments also had difficulty when responding
to questions about staff and population for the same reason. In addition, most programs
had not seen a decrease in their budget, though the sample size was quite small. A larger
response rate may have found a different result.
Otherwise, both groups of departments were similar in their revenue sources, as
well as their current and future spending trends. Purchasing and maintaining hardware
and software was important to both groups, as well as user support, and staffing.
Decreased budget did not negatively affect priorities or staffing with the exception of one
program that expected to reduce the number of FTEs. A more thorough group of
questions could have focused on whether hardware and/or software, staffing, or other
CHALLENGES
One of the biggest challenges, due to the small sample size, was interpreting the
data from the two groups, internal and hybrid IT departments. Due to the small sample
size, it was difficult not to view the data as 11 different narratives, one for each ILS IT
department that responded. For example, an online school, a struggling internal IT
department whose budget had been cut recently, and a hybrid IT department that did not
have access to budget information were some of the stories that developed as the data
was read by school instead of by type of IT department.
Another challenge caused by the small sample size was identifying trends in each
group. As the current result show, with respect to operations, each ILS IT department has
a unique way of structuring their operations. Perhaps with a larger sample, it would have
provided a more accurate picture of each type of IT department and trends would have
emerged. Though each ILS IT department should operate in the best structure for their
program, it made it more challenging to compare the IT departments.
FUTURE RESEARCH
Future research into decentralized IT departments in higher education should
focus on an ILS IT department within one school instead of multiple ILS IT departments
at multiple schools. This would provide a better peer to peer comparison and reveal how
the ILS IT department could better function within the university as a whole. This may
reveal opportunities and gaps within the university for IT departments to function more
CONCLUSION
This study examined the operations, budgets, and perceptions of decentralized
ILS IT departments in the United States using an online survey. With higher education IT
budgets continuing to be cut, while the demand for technology increases, understanding
how budget affects the decisions of IT departments is important. Decentralized IT
departments face an even greater challenge to meet the needs of their customers since
their budgets are a small portion of the central IT budget.
ILS IT departments were surveyed to provide a peer to peer comparison between
decentralized IT departments. The results were divided into two types of IT departments:
internal IT departments and those programs with a hybrid of both internal and central IT
support. Overall, the internal IT departments served larger populations, had more
full-time employees and student workers, with higher budgets when compared to the hybrid
IT departments. Both types of ILS IT departments had similar revenue sources, mainly
from grants and funds from central IT. Similarly, both internal and hybrid shared the
priorities of maintaining and purchasing hardware and/or software, though staffing and
classroom support were more important to the internal IT departments. These priorities
were further highlighted by the respondents answers to their fastest growing budget item,
and where they would spend unrestricted funds. Overall, hybrid IT departments were
more globally focused in their efforts to provide support, while internal IT departments
were focused more granularly on user support within their ILS program.
Despite the similarities and differences in budget and priorities, budget did not
appear to negatively impact either IT department, with the exception of one hybrid
However, future research, with a larger sample size, may reveal a reduction in services
and resources due to a budget decrease. In addition, focusing on one school with multiple
decentralized IT departments may provide a more complete picture of operations within
the university as well as help the ILS IT department find future resources and best
BIBLIOGRAPHY
Ajami, Racha, Al-Qirim, Nabeel (2013). IT Governance in Higher Education Institutions
in Abu Dhabi, UAE. International Journal of IT/Business Alignment and
Governance (IJITBAG) 4:2. Retrieved from
http://www.irma-international.org/article/governance-higher-education-institutions-abu/101913/
Dunlap-Kahren, Anne (2015). Top Education Trends Driving K-20 Technology Spending
in 2015. Retrieved from
http://www.erepublic.com/blog/Top-Education-Trends-Driving-K-20-Technology-Spending-in-2015.html
EDUCAUSE Center for Applied Research (2010). IT Funding and Cost Management in
Higher Education ECAR Research Study 4, 2010. Retrieved from
https://net.educause.edu/ir/library/pdf/ers1004/rs/ers10042.pdf
EDUCAUSE Center for Applied Research (2004). IT Funding in Higher Education
ECAR Research Study 7, 2004. Retrieved from
https://net.educause.edu/ir/library/pdf/ers0407/rs/ers04076.pdf
Gartner (2015, April). Gartner Says Worldwide IT Spending to Decline 1.3 Percent in
2015 [Press Release]. Retrieved from
http://www.gartner.com/newsroom/id/3025217
Gartner, Inc. (2003). IT Spending: How Do You Stack Up? Winning Asset Management
Strategies. Retrieved from
http://www.gartner.com/research/attributes/attr_47450_115.pdf
Grajek, Susan and the 2014-2015 EDUCAUSE IT Issues Panel. (2015, January) Top 10
IT Issues, 2015: Inflection Point. EducaseReview. Volume 50 (1). Retrieved from
http://er.educause.edu/articles/2015/1/top-10-it-issues-2015-inflection-point
Green, Kenneth C. (2015, September) Beginning the Fourth Decade of the “IT
Revolution” in Higher Education: Plus Ca Change. EducaseReview. Volume 50
(5). Retrieved from
http://er.educause.edu/articles/2015/8/beginning-the-fourth-decade-of-the-it-revolution-in-higher-education
IDC (2015, May). U.S. Higher Education Institutions Expected to Spend $6.6 billion on
IT In 2015, According to IDC Government Insights [Press Release]. Retrieved
from https://www.idc.com/getdoc.jsp?containerId=prUS25608415
Leadership Board for CIO’s in Higher Education (2012). Information Technology in
Summary. Retrieved from
https://www.uc.edu/content/dam/uc/ucit/docs/general/LBCIO_Press.pdf
Lepore, Patrick J. (2011, June). Using Technology Dollars Wisely. EducauseReivew.
Retrieved from
http://er.educause.edu/articles/2011/6/using-technology-dollars-wisely
Mendez, Angel L. (2015) Need IT with That? How One Board Effectively Oversees
Technology. Trusteeship Magazine Volume 23 (7) Retrieved from
http://agb.org/trusteeship/2015/special-issue/need-it-with-that-how-one-board-effectively-oversees-technology
Miller, Fred (2009, July) Rationalizing IT Rationing: 10 Ways to Cut the IT Budget (and
What Not to Cut). EducaseReview. Retrieved from
http://er.educause.edu/articles/2009/7/rationalizing-it-rationing-10-ways-to-cut-the-it-budget-and-what-not-to-cut
Nunziata, Susan (2014, June) Top 10 Governance, Risk, Compliances Tech Spending
Priorities. InformationWeek. Retrieved from
http://www.informationweek.com/strategic-cio/it-strategy/top-10-governance-risk-compliance-tech-spending-priorities/a/d-id/1278645
Rosenblatt, Susan (1999, August). Information Technology Investments in Research
Libraries. Educom Review 34:4. Retrieved from
https://net.educause.edu/ir/library/html/erm/erm99/erm9947.html
Standards for libraries in higher education. (2011) Retrieved from
http://www.ala.org/acrl/sites/ala.org.acrl/files/content/standards/slhe.pdf
The EDUCAUSE Core Data Service Trends Almanac (2014). Retrieved from
http://net.educause.edu/ir/library/pdf/cdat1407.pdf
Varughese, Julie A. (2005, December) Smart IT SPENDING Strategies. University
Business. Retrieved from
http://www.universitybusiness.com/article/smart-it-spending-strategies
2014 Core Data Survey Highlights (2014). Retrieved from
APPENDIX A: SURVEY QUESTIONS
Demographic Data
1. Is information technology (IT) for your university’s Library and Information Science program provided by a central IT department or does it have its own IT department?
§ IT Department within the Library and Information Science (SILS) School
§ A hybrid of Central IT and an IT department within SILS
2. How many FTEs (full-time equivalents) are currently employed in your IT department?
3. Do you expect your full-time IT employees to increase, decrease, or stay the same in the next year?
§ Increase
§ Decrease
§ Stay the same
§ I don't know
4. How many student employees are currently employed in your IT department?
5. Do you expect your student IT employees to increase, decrease, or stay the same in the next year?
§ Increase
§ Decrease
§ Stay the same
§ I don't know
Budget Data
7. What is your annual budget within your IT department?
8. Has your IT budget increased, decreased, or stayed in the same the past year?
§ Increase
§ Decrease
§ Stay the same
§ I don't know
9. How much of your budget is allocated to the following. Please provide your best estimate as a percentage below:
§ Personnel
§ Hardware
§ Software
§ Services
§ Other
§ Total
10. Please indicate the main sources of revenue for your IT budget as an approximate percentage:
§ Operating appropriation to central IT organization form the institutional budget
§ Student technology fees
§ External grants, contracts, and partnerships
§ Direct state allocation for specific technology expenditures
§ Direct state allocation for general operating costs
§ Resale of services to other campus units (chargebacks)
§ Resale of services to external entities
§ Other
Current and Future Operations Data
11. What are your top five IT priorities in the next three years?
§ Assisting faculty to integrate IT into instruction
§ Supporting online education
§ Leveraging IT for student success
§ Hiring and retaining staff
§ Professional development for staff
§ Providing adequate user support
§ Mobile computing
§ Supporting bring your own device (BYOD)
§ IT security
§ Migrating to the cloud
§ Shared services and IT collaboration
§ Replacement of aging IT
§ Other
§ Total
12. What is your fastest growing IT budget item in the next three years?
§ Network equipment
§ Hardware and software maintenance
§ Hardware and software purchases
§ Staff compensation
§ Contract services and software development
§ Staff training
§ Other
13. Do you outsource any IT functions? Please select all that apply.
§ No, we do not outsource any IT functions
§ Help Desk/Systems Administration
§ IT Support
§ Security
§ Training
§ Other
15a. Do you equip and support your own classrooms? Y/N 15b. Do you support multiple platforms for computers? Y/N 15c. Do you support multiple platforms for mobile devices? Y/N
16. How much support do you provide for instructional and research computing? Please list a percentage.
§ Instructional Computing
§ Research Computing
§ Total
Perceptions Data
17. Do you feel that investment in IT services in your department is adequate to meet the expected day-to-day activities and expectations?
§ Yes, very adequate
§ Mostly adequate
§ Almost adequate
§ Not adequate
§ Has serious deficits
18. Would you like to discuss your choice?
19. Where would you invest additional unrestricted IT funds to most benefit your school or program?
APPENDIX B: TEXT OF THE EMAIL SOLICITING STUDY
PARTICIPANTS
${m://FirstName}${m://LastName},
You are invited to participate in a research project studying the IT departments that provide services for Library and Information Science programs. This online survey should take about 15 minutes to complete. Participation is voluntary, and responses will be kept confidential and names of participants and their universities will not be used.
You have the option to not respond to any questions that you choose. Participation or nonparticipation will not impact your relationship with the University of North Carolina Chapel Hill. Submission of the survey will be interpreted as your informed consent to participate and that you affirm that you are at least 18 years of age.
If you have any questions about the research, please contact the Principal Investigator, Melissa Denby, via email [email protected] . If you have any questions regarding your rights as a research subject, contact the University of North Carolina Chapel Hill Institutional Review Board (IRB) at 919-966-3113.
Please print or save a copy of this page for your records.
By clicking on the link(s) below to access the survey you acknowledge that you have read the above information and agree to participate in this research project.
Follow this link to the Survey: ${l://SurveyLink?d=Take the Survey}
Or copy and paste the URL below into your internet browser: ${l://SurveyURL}