AN ANALYSIS OF THE ADOPTION OF WORLD WIDE WEB COMMON GATEWAY INTERFACE (CGI) TECHNOLOGY WITHIN HIGHER EDUCATION
ENVIRONMENTS
by Dawn Sanks
A Master’s paper submitted to the faculty of the School of Information and Library Science of the University of North
Carolina at Chapel Hill in partial fulfillment of the requirements for the degree of Master of Science in
Information Science.
Chapel Hill, North Carolina November, 2000
Approved by:
i
paper for the M.S. in I.S. degree. November, 2000. 96 pages. Advisor: Barbara Wildemuth.
This study draws on prior research of the adoption of Web technologies to
examine the adoption of a World Wide Web technology, specifically Common
Gateway Interface (CGI) technologies, by institutions of higher education. Both
quantitative and qualitative measures were gathered through use of online and
paper surveys of college and university study abroad offices. The goal of this
study was to investigate the determining factors in the decision making process
for adoption or rejection of CGI technologies and to describe how early adopters
implemented the technology. The results showed that institution size was not
related to the adoption of CGI technologies; however, study abroad population
size did prove to have a strong relationship with the adoption of this technology.
Headings: Internet
ii
I would like to thank my advisor, Dr. Barbara Wildemuth, for her support and
guidance through the entire research process, especially her assistance in
helping me understand the statistical analysis of my data.
I would also like to thank two very special people, Eileen McSherry and Michelle
Sanks, who helped facilitate the survey, assisted in the editorial process and
TABLE OF CONTENTS
TITLE PAGE
Introduction………..…..… 4
Background………... 5
Definition of Common Gateway Interface (CGI) Technologies………... 5
Prior Research of Adoption of World Wide Web Technologies…...…... 6
The Innovation-Decision Process………...….…………... 8
Adopter Categories……….……... 9
Research Topic………... 10
Methods……….………... 13
Population Definition………...……... 13
Sample Selection and Procedures………...…... 14
Survey Instrument………... 17
Operational Variables Collected Via The Survey Instrument…………... 19
Statistical Analysis………... 22
Results……….. 23
Descriptive Results……….... 23
Relationship Analysis – How Size Influences CGI Adoption…………... 25
Analysis of the Factors Contributing to the Adoption of CGI……….. 27
Analysis of the Factors Contributing to the Rejection of CGI...…...…... 29
Analysis of Implementation Solutions Used By Early Adopters…..…... 31
Perceived Obstacles & Disadvantages of Adopting CGI Technologies… 36 Discussion……….…..……... 38
Response to the Factors Listed for Adoption vs. Rejection of CGI Technologies………..
40
The Implementation Solutions Used By Early Adopters…………...…... 42
Conclusion………... 44
What To Consider When Making the Adoption Decision……….... 44
Summary………..…... 46
Placement In The Timeline For The Adoption Of CGI Technologies….... 47
Considerations for further research………..…... 49
Reference List…...………...……... 52
Appendices………... 55
Appendix A - Detailed Description of the CGI Protocol.………... 55
Appendix B - Office Titles Chosen from NAFSA Directory………. 56
Appendix C - Copy of the Paper Survey.………...………... 58
Appendix D - Cover Letter to the Survey.………...……….. 61
Appendix E - Proposal sent to the IRB Office.………...………….. 63
Appendix F - Screen Dumps of the Online Version of the Survey.……... 67
Appendix G - Survey Variables Modified for Data Analysis……..………. 76
Appendix H - Perceived Advantages……….. 77
Appendix I - Detailed Summary of the Rejection Reasons……….... 81
Appendix J - Completed Tables showing Implementation Solutions….... 84
Appendix K - Perceived Obstacles……….…… 87
Appendix L - Perceived Disadvantages……….……… 90
INTRODUCTION
The World Wide Web has grown exponentially since its creation in 1990, with
estimates of millions of users across the world. Although it is difficult to track the
exact number of users accessing the Web, its immense growth and popularity
can be inferred through other statistics, such as the growth in number of Web
servers. 130 Web servers were running on the Internet in June, 1993 escalating
to 21,166,912 by September, 2000 (Hobbes Zakon, 2000). Furthermore, each of
those Web servers may host one or multiple Web sites. These statistics
demonstrate the expansive growth of this new technology. Such growth is
indicative of the Web’s popularity, which has impacted how organizations
function and accomplish their work. Organizations experience the demand of
having a Web presence, whether that pressure comes from individuals within that
organization, their competitors, their clients or the media. The popularity of the
Web compels many organizations to decide whether to adopt or reject the new
technologies of the Internet. With the emergence of this new and popular
technology, researchers have been provided with a fresh and exciting subject
matter to investigate. Over the past decade, investigators have studied many
aspects of the Word Wide Web, including studies pertaining to the adoption of
World Wide Web technologies.
BACKGROUND
The following paper investigates aspects of the adoption of a particular World
Wide Web technology, that of Common Gateway Interface (CGI) technology. It
draws from prior research on how businesses adopt new technologies and from
the Diffusion of Innovation theory developed by Everett Rogers(1995). Previous
research on how institutions adopt new technologies reference six major
characteristics that consistently influence technology adoption. This study
focused on the most important of those six factors, that of institution size and
how it related to the adoption of CGI technologies. Additional descriptive data
pertaining to the participants of this study was gathered based on Roger’s
diffusion theory, which provides a framework for the innovation-decision process
and adopter categories.
Definition of Common Gateway Interface (CGI) Technologies
Early development of the World Wide Web was based on the concept of a host
server situated in one location delivering static text documents written in Hyper
Text Markup Language (HTML) to a client computer located elsewhere using the
Hyper Text Transfer Protocol (HTTP). The HTML standard did not include any
mechanism for the Web server to call upon a database query program that could
deliver output executed in real-time nor did it allow for genuine interactivity
between the client and server. Since the majority of first generation Web servers
protocol developed as a de-facto standard in order to deliver dynamic
information.
As the World Wide Web evolves, so do CGI technologies. Now CGI scripts or
programs can be written in any language and run on any platform, so long as the
CGI program is compatible with the server platform. What distinguishes them as
a CGI program/script is that the gateways interface external applications with
information servers, such as Web servers, in order to execute in real-time and
produce dynamically generated output of information. The most common
function of a gateway is to handle an HTML FORM request often interacting with
a server side database. A more detailed description of how the CGI protocol is
used to communicate between Web Forms and a CGI program/script residing on
the server is described in Appendix A. (Gilbert, 1997; Morton, 1998; NCSA
HTTPD, 1998; Richmond, 2000)
Prior Research on Adoption of World Wide Web Technologies According to their research of leading information systems journals and
conferences from the past 15 years, Goode and Stevens outline six
characteristics that consistently influence technology adoption within businesses
(2000). Those characteristics are 1) size, 2) age, 3) type of industry, 4)
information technology support, 5) information technology (IT) budget, and 6) IT
experience. It would follow that these characteristics might also be influential
institutions of higher education. Since the population definition for this survey is
fairly homogeneous, the “Type of Industry” characteristic is inconsequential. The
other factors however may influence the adoption of CGI technologies within
study abroad offices. Since size has been held to be the most important
characteristic in the analysis of business technology adoption (Goode & Stevens,
2000), this study focused its quantitative analysis on how size influenced the
adoption of CGI technology. It was thought that institution size, study abroad
population size and possibly the ratio of institution size to study abroad
population size would be related to the decision to adopt CGI technologies. Data
referring to age, IT support and budget was also gathered in a more subjective
manner via qualitative questions.
Quite a bit of research has been conducted on the adoption of the World Wide
Web within organizations and businesses. However, very little research was
found regarding to the adoption of CGI technologies. Given the infancy of CGI
technologies, research on the adoption of this technology is important and of high
interest.
The model for this research was developed from the diffusion of innovation
theoretical framework developed by Everett Rogers(2000), a leading
researcher/theorist in aspects of the adoption of computer technologies since the
1960’s. The diffusion of innovation theoretical framework has been applied to a
innovations are adopted by a particular social group. Rogers offers researchers
studying the phenomenon of the adoption of new technologies the following
dimensions: 1) the innovation-development process; 2) the innovation-decision
process; 3) the attributes of innovations that contribute to the rate of adoption; 4)
the adopter categories; 5) the differentiation between the innovation process of
organizations and 6) individuals and the consequences of innovation. This study
relies on Rogers’ specifications of the innovation-decision process and refers to
the adopter categories to help structure the research.
The Innovation-Decision Process
Rogers explains that the innovation-decision process is the progression that an
individual (or other decision-making unit) goes through when they are faced with
a new technology – from their first knowledge of the new technology, to forming
an attitude toward the technology, to a decision to adopt or reject it, to
implementation and then to a confirmation of their decision. According to
Rogers, there are five stages to the innovation-decision process. The first stage
is called the knowledge stage. This is when the individual learns that this new
technology exists. At this stage, the individual wants to know how the innovation
works and why it works and how it functions. Rogers calls the second stage
persuasion. This is the stage where the individual forms a favorable or
unfavorable attitude toward the technology. This is where the individual seeks
information to find out the advantages and disadvantages of the new technology
a choice is made to either adopt or reject the technology. The fourth stage is the
implementation stage, where the technology is put into use. Finally, the
confirmation stage occurs when the individual evaluates their decision. This is
the stage where the original decision to adopt or reject the technology may be
reversed. Those that adopted may choose to discontinue use if they are not
satisfied with the technology or if another improved technology comes along to
take its place and those that initially rejected the technology may decide to adopt
it later when circumstances change.
Adopter Categories
Rogers defines adopter categories as a classification system describing
individuals based on their degree of innovativeness. Innovativeness is the
relative speed with which an individual will adopt a new technology relative to
other individuals in a group. He describes five adopter categories 1) innovators,
2) early adopters, 3) early majority, 4) late majority, and 5) laggards. The
innovators are able to cope with higher levels of uncertainty about an innovation
compared to other adopter categories. Since they are the first to adopt a new
idea, they are not able to base their decisions on feedback from previous
adopters. These categories are based on the amount of time that it takes a
particular group to adopt a new technology. When the number of individuals who
are adopting a new technology are plotted on a graph to show the frequency of
adoption over time, the distribution usually looks like an S-Shaped curve. Most
the curve is dependent upon the rate of adoption. If there is rapid adoption of the
innovation, there will be a steep slope and if the rate of adoption occurs more
slowly, then the slope will be more gradual.
Research Topic
The goal of this study was to investigate the most prevalent reasons why
organizations adopt or reject a new Web technology and what could be learned
from the early adopters and those that rejected the technology. Specifically, the
study focused on the adoption of Common Gateway Interface (CGI) technologies
by institutions o f higher education. US university and college study abroad
offices were surveyed to assess their decision to adopt or reject the processing
of student applications through electronic media on the World Wide Web in place
of the traditional method of processing paper applications.
Understanding why a university/college department decides to adopt or reject the
new technology of World Wide Web forms and CGI technologies to electronically
automate their student application process is a very important and timely topic.
Accumulating and analyzing this data will help other university departments and
possibly other organizations make more informed decisions about the adoption of
CGI technologies. More specifically, this research hopes to provide guidance to
those working in study abroad offices who have not considered adoption of this
technology, so that they may gain insight regarding the important factors in the
understanding of the factors that both impede and support the implementation
process when an organization adopts Web forms and CGI technologies.
The manner in which organizations have used the World Wide Web as a
communication tool has evolved over the past decade and continues to change
at a very rapid pace. It is important to take a close look at how the technology is
evolving and how it is affecting organizations. The first Web sites served mostly
static pages of information presented to the end-user. However, new
technologies and programming/scripting languages have been created to render
the Web more dynamic in nature, allowing the user to interact with the
organization in an exchange of information. Many organizations utilize Common
Gateway Interface (CGI) technologies in order to create a more interactive
environment on their Web pages. Implementation of CGI technologies is still
very new and therefore provides an emerging area for study.
Drawing from prior research of the adoption of World Wide Web technologies
and from Roger’s diffusion theory, the following research questions were
developed:
1) Institution size is stated throughout the literature as being one of the most
significant characteristics that is consistently related to technology adoption
within businesses. Based on this stipulation, is institution size related to the
2) What are the determining factors in the decision-making process for adoption
and rejection of CGI technologies?
METHODS
Both a paper and an online survey were used to gather quantitative and
qualitative data regarding the adoption of CGI technologies from study abroad
professionals across the United States. Approximately 444 study abroad offices
were contacted using the combined survey methods and 212 usable responses
were received, generating a response rate of 48%. Details of this study’s
methods are described below.
Population Definition
Two criteria defined the organizations included in this study. First, the
organization had to be an institution of higher education, either a college or
university. The second criterion narrowed the scope of the survey population. A
subpopulation of higher education institutions was chosen, that of the study
abroad office. A study abroad office was defined as a person or an entire
department that focused part or all of their time on advising students and
processing the paperwork that was necessary for a student to study at another
institution outside the U.S. for a period of time. Study abroad offices were
chosen because they have a common function; most of them process
applications for students who wish to participate in an overseas study program.
That function is traditionally implemented with a paper form, but could be
Sample Selection and Procedures
Most university and college study abroad offices belong to a national professional
organization called the Association of International Educators (NAFSA). The
mission of NAFSA is to 1) set standards, 2) provide education and training for
professionals who are involved with services related to international educational
exchange, 3) provide a forum for discussion of issues and 4) provide a network
for exchanging information in an effort to increase awareness of and support for
international education in higher education, in government, and in the community
(NAFSA). NAFSA has over 8,000 members from each state in the United States
and from over 60 other countries. The majority of those members work at a
university or college as foreign student advisors, admissions officers, study
abroad advisors, directors of international programs, teachers of English as a
second language, administrators of intensive English programs and overseas
educational advisors. Every year, this organization publishes a membership
directory of institutions involved in international educational exchange. The
population chosen for this study consisted of a subgroup of NAFSA, those
institutions of higher education which had an advisor or office dedicated to
sending US students on overseas study programs. Unfortunately, the NAFSA
guide does not list the subgroup affiliation for each address listing, therefore it
was necessary to determine which contacts best fit the definition of an institution
that worked with study abroad students. Participants for this study were chosen
1) if their institution name included the words “college” or “university”.
2) if they listed the words “Study Abroad”, “Overseas Office/Studies”, or
“Program/Education Abroad” anywhere in their contact information.
“Offices of International Education/Programs/Studies” or “Center for
International Studies” were only chosen in the instances that it was very
clear there was a separate office at the same institution dedicated to the
other subgroups of NAFSA, such as foreign student advising, ESL,
international scholars/visiting faculty, etc. It was more cost effective to
make sure to send out surveys to contacts that absolutely fit the definition,
but it should be noted that it is possible that some schools were missed.
The goal was to send a survey to all study abroad offices nationwide listed
in the NAFSA guide, since it was estimated that this would include the
majority of study abroad offices across the country. [refer to Appendix B
for a complete listing of titles chosen for participation]
3) if they listed “Abroad” or “Overseas” within the contact’s title. All 8000
listings were reviewed twice and after a data accuracy check was
completed by two people, it was determined that a complete list of
contacts from the directory had been gathered following the criteria
Paper copies of the survey were mailed out to these 231 contacts from 46 US
states. After a little more than a week had passed, an individualized email
message was sent to each contact to follow up on the mailed survey to ensure
they had received their copy. At that same time, another email was sent to 561
members of a Study Abroad listserve called SECUSSA (Section on US Students
Abroad), a professional organization within NAFSA. That list represented 328
universities. Unfortunately, the address list gathered from the directory of that
listserve had not been maintained adequately and many of the emails were
returned as undeliverable. Approximately 65% of those emails were delivered
successfully (therefore an estimated 213 additional institutions were contacted).
The objective in sending out the email to this study abroad listserve was to
increase the coverage of study abroad offices that were not flagged as study
abroad institutions when scanning contacts in the NAFSA directory. It should be
noted that not all of the people on the SECUSSA listserve actually work in a
study abroad office; some of them are simply interested in the study abroad field.
Also, many people responded saying that they no longer worked in the field. The
SECUSSA listserve contacts were asked to fill out an online version of the survey
or download a copy from a Web site to fill out and mail back to the surveyor.
Those institutions that filled out the survey in response to the SECUSSA listserve
email were scrutinized to make sure they fit the definition of the survey
population. Two weeks later, a follow-up email was sent to both groups of
participants who had not completed a survey form in order to obtain a higher rate
Of the 444 study abroad professionals contacted1, 218 total surveys were
completed. 137 were returned from the 231 mailed paper surveys generating a
59% response rate and 81 were completed of the ~213 successful email surveys
generating a ~38% response rate. 6 of the 218 surveys were rejected2, which
left 212 total for data analysis. Therefore, the combined survey solicitation
methods generated an average 48% response rate.
Survey Instrument
The survey instrument was designed to gather the research variables most
pertinent to the research questions. It was broken down into three distinct
sections. The first section was designed for all survey participants to answer and
was comprised of questions regarding institution size, study abroad population
1After the survey was completed, another comprehensive list of study abroad offices was found published by Open Doors. Open Doors reports 673 institutions sent more than 5 students abroad in ‘95-‘96 and ‘96-’97, which is a
comprehensive listing of all colleges and universities nationwide (98/99 edition). The two methods of collecting survey responses was an attempt to contact as many study abroad offices as possible. When comparing the offices that were contacted for the survey to all the institutions listed in Open Doors, approximately 343 institutions were missed in using the selection definition for the NAFSA directory.
2 Reasons for rejection
• Handwriting illegible (1)
• Survey filled out for the whole university system (1)
• Institution did not process study abroad applications (3)
• For statistical analysis purposes, a record containing an outlier value for
size, whether or not the institution had their own Web site and application
processing questions. The second section was designed to gather information
from those participants that had rejected the implementation of online
applications. The third section targeted those who had adopted the new
technology a nd asked specific questions about the tools they used and their
perceptions about the implementation process. A copy of the survey instrument
appears in Appendix C.
The survey was pilot tested on three researchers who work with CGI
technologies. They reviewed the flow of the survey as well as grammar, spelling,
clarity and comprehensiveness of the technical questions. After changes were
made from their comments, several study abroad professionals provided
feedback on the second draft of the survey, reviewing the content and any
missing questions.
All mailed surveys were accompanied by a personally addressed cover letter on
UNC-CH letterhead that explained the background and importance of the
research [see Appendix D]. The letter also assured participants of their
confidentiality. Included with the survey and cover letter was a return-addressed
stamped envelope. Furthermore, participants received a follow-up individualized
email message informing them that a downloadable copy of the survey and the
were informed of the existence of an online version of the survey [screen dumps
of the survey can be viewed in Appendix F.]
Operational Variables Collected Via The Survey Instrument Characteristics of the Survey Participants
Three variables were defined pertaining to size – institution size, study abroad
population size and the ratio between the study abroad population and institution
size. Institution size refers to the total number of undergraduate students
attending a college or university. Study abroad population size refers to the
study abroad office client base, in other words the number of students served
within a year. Study abroad population size ascertains departmental unit size.
The ratio variable compares the size of the departmental operation compared to
the institution size as a whole.
The three distinct variables describing size were compared to three variables
describing technology adoption: 1) whether or not the study abroad office had
their own Web site [WebSite], 2) the manner that applications were processed at
the time the survey was completed [process] and 3) which offices adopted CGI
technologies versus those that rejected it [adopters]. The difference between the
process variable and the adopter variable is that the process variable determines
which application process had been implemented at the time of the survey. The
adopter variable determines adopters versus non-adopters, where the adopter
as those offices in the midst of implementing online applications. The date that
applications had been (or would be) implemented online was also collected to
determine when the implementation process took (or would take) place
[implementation date]. When analyzing the survey data, it was necessary to
modify some survey variables in order to accomplish data analysis for the
analysis of the variables listed above [see appendix G for details]
Steps in the Innovation-Decision Process
Since this survey focused on gathering information about adopters versus
non-adopters, the five categories of the innovation-decision process were combined
into two distinct groups. The survey participants were asked a series of
questions that categorized them into the knowledge/persuasion stage or the
decision/implementation/confirmation stage. The knowledge/persuasion stage
variable established whether participants had thought about implementing online
applications (or whether they were aware of the technology, yet might not have
made the decision and were in the information gathering stage). The
decision/implementation/confirmation stage variable ascertained whether the
participant had made a decision regarding the technology and if they 1) rejected
it or 2) decided to implement the technology. This study did not go into further
detail of the confirmation stage to find out if a participant that rejected the
technology might revisit their decision and possibly adopt the technology at a
later date or if an adopter might decide to discontinue the implementation of the
reconsiderations were described in some of the responses to the open-ended
questions of the survey. One final variable pertaining to satisfaction was
formulated for the adopters. This confirmation stage variable simply asked a
yes/no question to find out if a participant was satisfied with their decision to
adopt online applications.
Reasons for Rejecting the Technology
The following response options ascertained why a survey participant rejected the
technology. Survey participants checked off as many of these reasons that
applied to their circumstances. They were also allowed to add additional
reasons, which were gathered in the form of an opened ended question.
• Staff members uncomfortable with new technology
• Lack of a computer support person to develop forms
• Lack ongoing technical support to maintain fo rms
• Lack the hardware
• Lack the software
• University policy against implementation
Description of the Implementation Characteristics of the Early Adopters
The following variables were defined to gather descriptive information about the
tools, IT support and IT architecture chosen by early adopters for their
implementation process.
• Type Of Database Used
• Programming Language Used
• Person Who Created the Web Forms
• How Data from Web Forms are delivered
• Person Who Provides the Web Server
• Person/Organization that Provides Computer Support
• Perceived Obstacles
• Perceived Advantages
• Perceived Disadvantages
Statistical Analysis
An independent-samples t-test was used to compare the means of the three size
variables to the three variables pertaining to technology adoption. A one-way
analysis of variation (anova) test was used to compare the means of the three
RESULTS
Descriptive Results
Table 1 displays the survey participants’ answers to the first set of questions of
the survey. A large percentage of study abroad offices currently have their own
Web site, however it is evident that few have already implemented online
applications. At the time of this survey, only 11% had already created an online
version of their application form. However, that number is growing with the
number of participants who are currently in the implementation stage. Almost
30% of the offices reported that they have decided to adopt CGI technologies in
Table 1
Descriptive Results from the 212 Survey Respondents
Survey Questions Total Answered Percent of Total
Does your office have a Web site?
No 19 9.0%
Yes 193 91.0%
How do you process your Study Abroad applications?
Paper 189 89.2%
Online 23 10.8%
Has your office considered implementing online applications where the student types in their information from their computer terminal & the form is submitted to your office? *
No 75 38.3%
Yes, however we decided against implementing online applications
75 38.3%
Yes, we are in the process of
implementing online applications now
46 23.4%
Summary of Adopters vs. Non-Adopters:
Non-Adopters 150 70.8%
Adopters 62 29.2%
Relationship Between Size and CGI Adoption
The subsequent statistics in Table 2 were reported after running an
independent-samples t-test comparing the mean institution size, the mean study abroad
population and the mean ratio variable of those institutions that did have a Web
site compared to those that did not have one. A second test was run to compare
the mean institution size, the mean study abroad population and the mean ratio
variable of those institutions that currently processed paper applications
compared to those that processed some form of online application forms. A third
test was run to compare the mean institution size, the mean study abroad
population and the mean ratio variable of those institutions who had decided to
adopt the CGI technologies compared to those that had not adopted them. Of
the three size variables, institution size and the ratio variable were found to not
be associated with the adoption of a Web site, nor the adoption of CGI
technologies. The study abroad population size proved to be the most
interesting comparison, since it was found to have a statistically significant
Table 2
Relationship Between Size and CGI Adoption Mean (s.d.) for adopters
Mean (s.d.) for
non-adopters t statistic df p
Adoption of a Web site
Institution size n=189 11,057 (11,522) n=18 8,432 (15,018)
-.898 205 .370
Study abroad population size
n=192 327.46 (343.69) n=17 106.29 (82.10)
-6.953 87 .000
Ratio of institution size to study abroad population size
n=188 5.29% (5.60%) n=17 3.42% (4.04%)
-1.345 203 .180
Adoption of online applications
Institution size n=23 12,666 (10,555) n=184 10,599 (12,003)
-.788 205 .432
Study abroad population size
n=22 453.86 (366.79) n=187 292.49 (328.69)
-2.152 207 .033
Ratio of institution size to study abroad population size
n=22 4.60% (2.30%) n=183 5.20% (5.73%)
.780 43 .439
Adoption of CGI technologies
Institution size n=59 12,560 (10,114) n=148 10,138 (12,434)
-1.330 205 .185
Study abroad population size
n=59 452.20 (460.62) n=150 253.33 (251.87)
-3.137 72 .002
Ratio of institution size to study abroad population size
n=57 4.75% (4.84%) n=148 5.28% (5.74%)
The statistics shown in Table 3 were generated from a one-way analysis of
variation (anova) test which analyzed the relationship between the size variables
and the inno vation-decision variable. The innovation-decision variable
determined which stage of the decision-making process the participants were at,
whether they had knowledge of the innovation or not and if they did have
knowledge of the innovation, had they made a decision regarding
implementation. Once again, the only relationship that proved statistically
significant was that with study abroad population size.
Table 3
For those who currently process paper applications, have you thought about implementing online applications?
Mean (s.d.) No Mean (s.d.) Yes, Rejected Mean (s.d.) Currently Implementing f
statistic df p
Institution size n=75 9,363 (11,394) n=73 10,935 (13,450) n=42 12,450 (9,886)
.934 2, 187 .395
Study abroad population size n=75 236.29 (298.47) n=75 270.37 (195.09) n=42 436.43 (489.15)
5.623 2, 189 .004
Ratio of institution size to study abroad population size n=75 4.95% (5.68%) n=73 5.63% (5.83%) n=40 4.71% (5.59%)
.424 2, 185 .655
Analysis of the Factors Contributing to the Adoption of CGI Technologies There are many advantages of using an online application form rather than using
paper forms [refer to Appendix H for a more detailed summary of the perceived
advantages]. One of the most popular reasons given was that it would save
paper, since data is input directly into the database system by the student. Direct
data entry replaces the need for an office staff member to enter information.
Database accuracy was also listed as a big advantage of online applications.
Since a student reviews the information they input into the database system, they
can edit it and correct it right away, reducing data entry errors. Likewise, it was
viewed that if students were responsible for inputting their information in the
database system, the information would be more accurate and current, since
they are able to update their record as their information changes. Another
advantage given was the reduction in paper use, which also translated into
increased office space due to fewer paper files. The efficiency of electronic
storage of student files and archival of data was mentioned as well. Many offices
mentioned that the main advantage was improving the convenience for students.
Online applications made the application process much more accessible and
easier for the students. It saved them time and postage. In addition, it facilitated
more immediate and timely communication. Not only did study abroad offices
implement online applications because of the perceived advantages to students;
they hoped that the new technology would increase the number of applicants as
well. Another advantage mentioned was that online applications improved the
overall application process, because they facilitated easier and speedier access
of applicant information to many different parties in many different locations, such
as faculty selection committees, advisors, overseas counterparts running
programs, etc. One participant explained it this way: “We are also able to feed
aid office, disability services, judicial programs: this eliminates a tail end
data-collection process, and ‘keeps the ball rolli ng’ throughout the admissions cycle”.
Analysis of the Factors Contributing to the Rejection of CGI Technologies It was assumed that the following factors might be some of the major influences
in why a study abroad office would reject the adoption of CGI technology:
inadequate funding, the lack of necessary hardware/software or technical
support, the lack of available computer support services for development and
training, the lack of appropriate computer/networking infrastructure, the type of
university culture and the attitudes toward computer technology. Therefore, the
survey question of why an office rejected online technologies specified the
reasons mentioned above while concurrently allowed for an open-ended
response. Table 4 gives a summary of the reasons checked-off on the survey by
Table 4
Rejection Reasons Based on Survey Results
Reason
Number Answered
Percent of Total
Staff Uncomfortable 16 21.3%
Lack a Computer Support Person 31 41.3%
Lack Ongoing Technical Support 35 46.7%
Lack Hardware 11 14.7%
Lack Software 14 18.7%
University Policy Against It 2 2.7%
Insufficient Funds 24 32%
Note: Percentages add to more than 100%, since respondents were allowed to check off all reasons that apply.
Many other reasons were also given for not adopting the new technology [refer to
Appendix I for a more detailed summary of the rejection reasons]. One of the
most popular reasons given was that the office did not have enough time to
dedicate to implementing an online application, because other priorities took
precedence. It was often mentioned that there was a lack of staffing to take on
such a project. Some offices listed that they simply did not have the “know-how”
or the expertise. Many offices were worried that they would increase their
workload, because they feared that online applications would increase the
number of non-serious applicants who would not follow through with the whole
process. Another common reason was the fear of losing personal contact, thus
sacrificing the relationship between students and study abroad advisors. Such a
was common for offices to reject adoption of online applications if they could not
completely copy the paper process. Many offices stated that they rejected the
technology because they could not implement certain parts of the application
online, such as transcripts, letters of recommendation, signatures, photos, and
the collection of an application fee.
Analysis of The Implementation Solutions Used By Early Adopters
Questions on implementation solutions were answered only by institutions that
had already implemented online applications or were in the process of
implementation. Listed in the tables below is the information they provided
regarding the tools and the information technology support and architecture
chosen for implementation of online application forms. Note that these tables
only show the tools/infrastructure that were actually used; however, many
institutions were still in the planning stages and had not yet decided all of these
factors. Therefore, totals within the tables do not always add up to 100% of the
adopter category. Additionally, answers to the more technical questions may not
be 100% accurate. For example, some survey participants considered their
applications to be online using CGI technologies even though they used a PDF
form or a word document for students to fill out and print and submit. Even
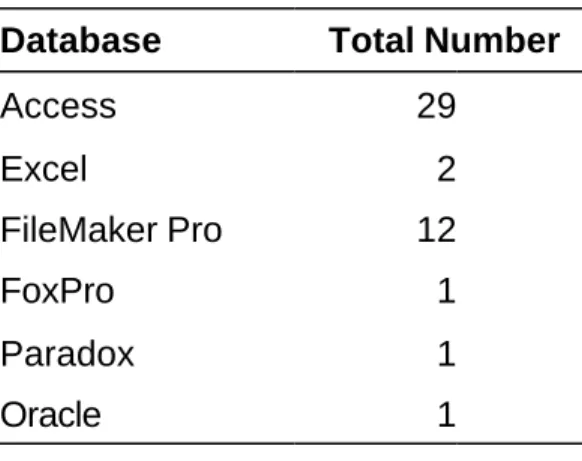
Table 5 provides a detailed summary of the types of database systems each
study abroad office uses as their back end to the online application forms. This
is where the data is stored once it is submitted by the student via the online form.
Table 5
Database Used
Database Total Number
Access 29
Excel 2
FileMaker Pro 12
FoxPro 1
Paradox 1
Oracle 1
Note: This table includes the totals for each database used. Some offices used a combination of databases. [see Appendix J, Table 5b for details]
Table 6 presents a complete summary of the types of programming languages
that each study abroad office uses for their CGI scripts which process the
Table 6
Programming language used for CGI Scripting
Programming Language Total Number
ASP 4
ColdFusion 2
HTML 3
JAVA 1
JavaScript 7
Omniform 1
Perl 2
VB 1
Note: This table includes the totals for each programming lang uage used. Some offices used a combination of languages. [see Appendix J, Table 6b for details]
Three institutions mentioned that they used PDF. PDF can be rendered as a
form to be filled out online and then printed out to send in the mail or attach to an
email. However, since PDF is not a programming/scripting language used for
CGI forms, it was not listed in this table.
Table 7 provides information regarding the person that was hired to write the
code and create and design the pages for the online application form. University
consultants were usually university employees who worked for a computer
support center on campus, while an outside consultant usually referred to an
outside vendor who provided a packaged software solution or a consultant group
Table 7
Who Created your Web Forms?
Programmer Total Number
Outside Consultant 9
Graduate 3
Office Personnel 16
Undergraduate 12
University Consultant 9
Note: This table includes the totals for resources used. Some offices used a combination of these resources. [see Appendix J, Table 7b for details]
Table 8 provides information on the Web server and whether or not the study
abroad office has complete control and ownership of their Web server or if it is
owned and therefore managed by an outside university entity.
Table 8
Do you have your own Web server or
do you use a University provided Web server?
Server Total Number
Own 10
University 38
Table 9 is similar to table 8, yet it refers to the ownership, control and therefore
Table 9
Do you have a computer support person dedicated to your office to support the online applications or do you rely on support from a larger University technical support group?
Support Person Total Number
None 1
Other 1
Outside Consultant 2
Own 20
Statewide Consortium 1
University 24
Students 2
Note: This table includes totals for the resources used. Some offices used a combination of resources. [see Appendix J, Table 9b for details]
Table 10 provides information on how the study abroad office receives their data
from the online application form, whether or not the CGI program is robust
enough to interact directly with the database system, or whether or not they are
in an intermediary stage of receiving the data via email. Information received via
email loses one of the biggest advantages of implementing online applications
and that is duplicate data entry, therefore, it is not as efficient as a direct input
Table 10
In what format do you receive your data?
Data Received Total Number Data inserted directly
into database 21
Email 14
Note: Two institutions mentioned that they received their information in paper format. When using a PDF online form, the form is then printed out and sent in the mail. This was not included in the table, since it represented an intermediary step to a CGI technology.
Table 11 investigates the rate at which institutions have implemented their online
application forms relative to when the survey was conducted in October, 2000.
Table 11
Date of Implementation
Data Received Total Number
Before 10/1/2000 24
After 10/1/2000
(within the next 6-9 months) 11
Note: This table includes the total before and after date. [Appendix J, Table 11b provides a detailed listing of implementation dates]
Perceived Obstacles & Disadvantages of Adopting CGI Technologies The early adopters of CGI technology ran into the following obstacles and found
some disadvantages to adopting CGI technologies [see Appendix K & L for a
more detailed summary of the Perceived Obstacles & Disadvantages]. Some of
the obstacles mentioned were also mentioned as reasons for rejecting CGI
implementing this technology was time and finding someone with adequate
technical skills to implement the forms. Another problem mentioned was making
sure the information was secure. Also, finding enough funding to support the
initial creation of the pages was often difficult, not to mention that it was difficult
to then find someone to give continuing technical support of the project. Some
offices had much resistance from staff members who were not comfortable with
the online technology and preferred the paper forms, so changing the staff’s
mentalities toward e -forms was difficult. It was mentioned that a few extraneous
applications were submitted through this new process. Furthermore, it was noted
that if students do not have reasonable access to computers, then electronic
DISCUSSION
How Size Affected CGI Adoption
When comparing institution size to the adoption of a Web site, the results found
from this study were consistent with prior research of Goode & Stevens. Their
research determined that there was no association between the adoption of the
World Wide Web and business size (2000).
Institution size is usually viewed as one of the major factors in determining
technology adoption (Goode & Stevens, 2000). Many researchers argue that
institution slack, the organization’s capacity to allocate personnel and financial
resources to the use of new technologies, is what facilitates large organizations
to be able to adopt technologies over small organizations (Goode & Stevens,
2000). Large organizations tend to have the ability to develop a technological
infrastructure to better support new technology adoption. Goode and Stevens
argue that adoption of World Wide Web technologies might not be dependent
upon an organization’s capacity to provide and support infrastructure, which is
supported by Jarvenpaa and Ives research, where they found that the World
Wide Web requires little technological support (Goode & Stevens, 2000). Goode
and Stevens also argue that smaller institutions might be more flexible and can
adapt more quickly than larger businesses, which may have existing practices
impeding World Wide Web adoption. Basically, Goode and Stevens summarize
reasons why there is no association, since their research simply looked at
adoption vs. non-adoption in relationship to business size.
The result that institution size is not associated with the current application
process nor the adoption of CGI technologies is very interesting. Adoption of
CGI technologies is a much more costly endeavor, both financially and
technologically than developing a simple Web site. Therefore, it wo uld seem that
the relationship between institution size and the adoption of CGI technologies
would tend to follow that of other technology adoption trends instead of following
the same argument as that of the adoption of the World Wide Web. However,
the results of this survey show that adoption of CGI technologies is not affected
by institution size.
It is intriguing that there is a significant relationship between study abroad
population size and the adoption of a Web site, the current application process,
and the adoption of CGI technologies. The results of the statistical analysis show
that the larger the study abroad populations, the more likely the office will
implement both their own Web site and online application forms. It seems that
institution slack does not influence CGI technology adoption, but that program
size does. One possible explanation for this result is that offices that serve more
students may be able to argue that it is more worth their time and energy to
create online forms than those offices which process fewer applications. It is
allocations to fund new technology compared to smaller offices. This is
especially true if application fees are calculated into the annual operating budget
and more students translates into more money. Yet another conclusion may be
reverse causation. It could also be possible that offices that have adopted CGI
technologies to create online application forms have increased their study abroad
population as a result of the new application process. Investigation into the
exact reasons why study abroad population size is related to the adoption of CGI
technologies should be a topic for subsequent research.
Response to the Factors Listed for Adoption vs. Rejection of CGI Technologies
Review of the reasons given for rejecting CGI technologies demonstrated that
the technology had not been understood adequately. This is evident from many
of the misconceptions of how an online application can be implemented. For
example, some of those who rejected the technology were concerned about the
extra time and effort it would take for the study abroad staff to go into the
database and correct student mistakes or follow up on incomplete applications.
However, the form design should incorporate error checking and checks for
completeness, which would make the manual task obsolete. In addition,
feedback can be given to students about incomplete applications electronically.
Triggers can be set up in the database to send out email messages as reminders
or feedback can be given during the actual online application process. Another
form would allow the students to bypass the office altogether, causing them to
not get the proper program advice or curriculum advising. This fear of losing the
relationship with the student is plausible if the online application form does not
have any parameters incorporated into it regarding program advising. A possible
solution to this issue could be that a student is not able to fill out the form until
they see a study abroad advisor about program/course advice. Once they have
completed this task, the advisor could give them a password to enter into the
electronic system in order to complete the online form. That way, the office still
maintains control of ensuring that a student applies for appropriate programs and
courses, yet both the office and the student benefit from the advantages that an
online form has to offer. Another reason for rejecting the technology altogether
was due to parts of the application that could not be submitted electronically,
such as photos, transcripts or contracts needing student signatures. However,
an office may still benefit from an online application even if they implement just a
part of the information can be rendered electronically. There is the possibility
that many of the recommendation forms that come from within the institution’s
own campus could be rendered electronically and maintained secure by Internet
Protocol (IP) restricted access and password protection. An important aspect of
the decision-making process is to predict the obstacles of implementation and
then investigate if such obstacles can be overcome. It is recommended to have
discussions with other institutions that have implemented online applications or
consult with someone who can give technical advice pertaining to CGI
not really be obstacles after all. There are many advantages to implementing
online applications and it is important to become informed of the major costs and
benefits of implementation before a decision is rendered. If a person making the
decision to adopt or reject the technology has a fairly complete picture of the
benefits and the drawbacks, then they are likely to make a better decision based
on their needs.
The Implementation Solutions Used By Early Adopters
From the statistics gathered, it is clear that Access and FileMaker Pro databases
tend to be the most widely used database platforms used for CGI interfaces. It
has been the author’s experience that both of these database systems are fairly
user friendly for a small department to maintain and manage on their own.
However, it is very important that someone with database design knowledge and
experience has reviewed the initial creation of the database system, since a
poorly designed database can cause major problems. The CGI scripting or
programming languages chosen by the adopters was much more diverse, since
there tend to be many options available. ASP, ColdFusion, JavaScript and Perl
came up as the most popular choices and they are also very common within the
development industry. There are advantages and disadvantages to each
technology. Often the technology that is chosen tends to be determined by the
current software and hardware configuration in use and the knowledge of the
available person who will have the technical skills to implement and support the
support the application was mentioned as one of the most difficult obstacles for
those that adopted this technology, especially since the developer tended to be
office personnel or a graduate or undergraduate student.
CONCLUSION
Suggestions of What To Consider When Making This Adoption Decision It is clear that there are many factors to take into consideration when deciding
whether or not to adopt CGI technologies in order to implement an online form
instead of a paper one. Based on previous experience of implementing many
online forms, including the one for this study and after analyzing the feedback
from this survey, it is the author’s suggestion that the following aspects are taken
into consideration when deciding on electronic implementation of online forms.
1) Gather as much information as possible regarding your available resources.
What type of computer support is currently available? If that support will not
meet the needs for this project, where can additional support be obtained?
Development of the initial Web forms should necessitate a larger investment
of time, money and skilled technical support compared to the subsequent
maintena nce of the application. If the new system is well planned, well
documented and training is offered, a less skilled support staff can take over
the maintenance of the system. Is there flexibility to choose the type of
technology to implement or is a particular database/CGI programming
language necessary due to hardware/software compatibility or
knowledge/skill level of the developer? It is important to gather as much
information as possible from other study abroad offices that have
implemented the technology and from other departments on your campus
2) Conduct a cost-benefit analysis of the project and write down all the
advantages and disadvantages regarding implementation. Identify if the
disadvantages are actual obstacles to implementation or simply perceived
obstacles that can actually be solved.
3) Use a database and/or programming languages that are common and used
throughout the industry. This will facilitate finding subsequent IT personnel
who are familiar with the technology and can readily support and manage
the system.
4) Make sure to require the developer to maintain substantial documentation,
so that the system is not dependent on a particular developer. Provide the
developer with plenty of feedback about the design and make sure
appropriate error checking is incorporated into the system.
5) Involve the staff end -users in the design process. This will create ownership
in the new system and prevents oversights.
6) For security purposes make certain that you have prepared proper backup
and recovery procedures for your systems. Appropriate planning for
disaster recovery is extremely important in protecting your investment. It is
Many disasters can affect your systems, such as:
Loss of key personnel (resignation, illness, death)
Loss of phone/network access
Loss of utilities (water, electricity, heat)
Lightning strike
Flood
Theft of tangible property
Introduction of a virus/worm/Trojan horse
Disk crashes / hardware failure
Data corruption
Bugs in software
Employee sabotage (mistaken or intentional)
Random hackers causing damage
The checklist in Appendix M may be used as a starting point to create your own
security audit.
Summary
The objective of this study was to investigate the various aspects of the adoption
of CGI technologies within institutions of higher education. These aspects
included 1) the determining factors taken into consideration in the
decision-making process for adopters and non-adopters, 2) how early adopters
not adopt. This study sought to provide guidance and give insight to those
institutions that had not yet considered adoption or those who had rejected
implementing CGI technologies. The goal was to provide a better picture of what
factors contribute to the decision-making process, so that they could make
better-informed decisions. Hopefully, more offices will be able to automate their
student application process with this information.
Placement In The Timeline For The Adoption Of CGI Technologies Based on Rogers’ S-Shaped Curve showing the typical rate of technology
adoption, the graphs in Figures 1 and 2 demonstrate that study abroad offices
are in the beginning stages of the adoption process for CGI technologies in
placing their applications online. Therefore, it is important to revisit this topic at
various intervals, since the adoption process is one that occurs over time.
Furthermore, it is important to follow up with the early adopters to investigate the
consequences of their decision and to discover how adoption of online
applications has affected changes within their process. It would be interesting to
investigate the amount of satisfaction based on CGI technology implementation,
Figure 1
Adoption Timeline
Figure 2
S-Shaped Curve Based On Adoption Timeline
Considerations For Further Research
The focus of this research was to gather information about adopter vs.
non-adopter categories, which combines the five steps of the innovation-decision
process into two distinct groups. However, future research could look in more
detail at the five distinct stages of the innovation-decision process. It may also
be worthwhile to study in more detail the characteristics that make up the study
abroad offices that are the innovators / early adopters compared to the other
adopter categories (early majority, late majority, laggards). (Rogers, 1995)
The rate of adoption of technology by members of the social system is
and 5) observability (Rogers, 1995). A technological innovation usually has
some sort of pote ntial benefit for the adopter. Relative advantage refers to the
degree to which the innovation is perceived as advantageous, especially
compared to the current practice or other alternatives. This study investigated
the perceived advantages, disadvantages and obstacles of adopting CGI
technology, which describe the relative advantage of the innovation. The other
determining factors, such as 1) how compatible the new technology is with the
adopter’s current values, 2) how complex or difficult the technology is to
implement, 3) the degree to which the new technology can be tested on a limited
basis and 4) how easily the results of other study abroad offices’ implementations
of the technology can be observed are all areas that were not addressed by this
study and warrant future research.
Future research is also needed to gather more quantitative data regarding the
other four business characteristics. Institution size was the only major
characteristic that was studied on a quantitative basis. The other characteristics
1) type of industry, 2) information technology support, 3) information technology
budget, and 4) information technology experience were only investigated in this
study in a qualitative manner. These variables could be quantified and
researched as well to find out their relative influence on the adoption of CGI
technologies. It is probable that financial support would be an important factor in
Finally, an additional aspect was introduced in reference to this study that
warrants further research. One premise for creating online applications was that
the electronic forms were viewed as advantageous to students. It may be
worthwhile to survey students, who are the end-users of these electronic forms,
to find out if they perceive significant advantages or disadvantages in the shift to
REFERENCE LIST:
Garfinkel, Simson, Spafford, Gene. (1996). Practical UNIX & Internet Security,
2nd Edition. Sebastopol, California: O'Reilly and Associates.
Gilbert, H. (1997). Distributed Applications and the Web on the Homepage for
PC Lube and Tune. [Online]. Available:
http://pclt.cis.yale.edu/pclt/WEBAPP/cgi.htm [Retrieved October 2000].
Goode, Sigi & Kenneth Stevens . (2000). “An analysis of the business
characteristics of adopters and non-adopters of World Wide Web technology.”
Information Technology and Management. Baltzer Science Publishers. (pp.
129-154).
Hadjiefthymiades, Stathes, Drakoulis Martakos & Costas Petrou. (November,
1999). “Stateful relational database gateways for the World Wide Web”. Journal
Hobbes Zakon, Robert. (2000). Hobbes' Internet Timeline v5.2. [Online].
Available: http://www.isoc.org/guest/zakon/Internet/History/HIT.html [Retrieved
October 2000].
Icove, David J., Seger, Karl, VonStorch, William. (1995). Computer Crime: A
Crimefighter's Handbook. Sebastopol, California: O'Reilly and Associates.
Morton, Sanford. (1998). A Tour of HtML Forms and CGI Scripts. In CGI
Resources Homepage. [Online]. Available:
http://www.speakeasy.org/~cgires/cgi-tour.html [Retrieved October 2000].
NAFSA: Association of International Educators. (No Date). This is NAFSA.
[Online]. Available: http://www.nafsa.org/insidenafsa/thisis.html . [Retrieved
October 2000].
NCSA HTTPD. (1998). The Common Gateway Interface. In NCSA HTTPD
Homepage. [Online]. Available: http://hoohoo.ncsa.uiuc.edu/cgi/intro.html
[Retrieved October 2000]
Open Doors Statistics – 98/99 edition reporting on 96/97 Study Abroad statistics.
(No Date). opendoors on the web. [Downloaded Excel Spreadsheet “APP-D-98:
http://www.opendoorsweb.org/datadownload/download9798.htm [Retrieved
October 2000].
Peddemors, A.J.H. & L.O. Hertzberger. (April 1999). “A high performance
distributed database system for enhanced Internet services.” Future Generation
Computer Systems. Volume 15. Issue 3. (pp. 407-415).
Richmond, Alan. (2000). CGI: The Common Gateway Interface for Server-side
Processing. In Web Developer’s Virtual Library Homepage. [Online]. Available:
http://www.stars.com/Seminars/CGI/ [Retrieved October 2000].
Rogers, Everett M. (c1995). Diffusion of innovations / Everett M. Rogers. New
York : Free Press.
SPSS Help Documentation from SPSS Statistical Analysis Software. (2000).
[SPSS Software Package]. Producer: SPSS Inc. Headquarters, 233 S. Wacker
Drive, 11th floor, Chicago, Illinois 60606. Available: http://www.spss.com/ [October 2000].
Thompson, S. H. Teo, Vivien K. G. Lim and Raye Y. C. Lai. (February 1999).
“Intrinsic and extrinsic motivation in Internet usage”. Omega. Volume 27. Issue 1.