Dietary Restraint and Hedonic Drivers of Sugar Sweetened Beverage Consumption By
Lily Jewel Jones
Senior Honors Thesis Department of Nutrition
University of North Carolina at Chapel Hill
March 9, 2018
ABSTRACT
Lily Jewel Jones; Dietary Restraint and Hedonic Drivers of Sugar Sweetened Beverage Consumption
(Under the direction of Kyle Burger)
TABLE OF CONTENTS
LIST OF TABLES ... v
LIST OF FIGURES ... vi
CHAPTER 1: STUDY AIMS AND HYPOTHESES………..……1
CHAPTER 2: INTRODUCTION………3
2.1 Dietary Restraint………....5
2.2 Sugar Sweetened Beverage Consumption..………...6
2.3 Summary..………..7
CHAPTER 3: METHODS……...………9
3.1 Participants……...………..9
3.2 Preparation of Flavored Beverages……...……….9
3.3 Procedure……...………...……….9
3.4 Measures……...………...10
3.3.1 Dietary Restraint……...………10
3.3.2 Beverage Consumption……...………..…10
3.3.3 Hedonic and Internal State Ratings……...………10
3.3.4 Additional Measures……...………..……11
3.3.5 Analysis……...………..…11
CHAPTER 4: RESULTS……...………..…..…12
4.2.1 Dietary Restraint, Beverage Intake and BMI……...……….12
4.2.2 Hedonic Ratings and Dietary Restraint……...……….….13
CHAPTER 5: DISCUSSION……...……….…...…..18
APPENDIX A: DATA TABLES……...……….…….…..20
LIST OF TABLES
LIST OF FIGURES
CHAPTER 1: STUDY AIMS AND HYPOTHISES
Obesity has become a major public health concern in the United States, as over 60% of the population is currently overweight or obese (Wyatt, Winters, & Dubbert, 2006). Theoretically, dietary restraint, the deliberate restriction of caloric intake for the purpose of weight loss or weight maintenance (Herman, 1975), has the potential to reduce the prevalence of obesity. However, many studies have failed to show a
significant association between dietary restraint scales and caloric intake, while high self-reported dietary restraint has been linked to increased BMI (Snoek, van Strien, Janssens, & Engels, 2008; Stice, Sysko, Roberto, & Allison, 2010). Coinciding with the rise of obesity, soft drink consumption has dramatically risen in recent decades (Harnack, Stang, & Story, 1999; Reedy & Krebs-Smith, 2010). Increased sugar sweetened beverage intake has been epidemiologically and experimentally linked to weight gain, as well as poor diet quality and morbidity (Brownell et al., 2009; Malik, Schulze, & Hu, 2006). While the relation between dietary restraint and food consumption is relatively well studied, little is known about the role self-reported restraint plays in influencing sugar sweetened
Aim 1: To test the relationship between self-reported dietary restraint and sugar
sweetened beverage consumption. We hypothesize that dietary restraint will be inversely related to sugar sweetened beverage consumption.
CHAPTER 2: INTRODUCTION
Obesity is one of the most pressing issues currently facing public health in the United States, as more than 1 in 3 American adults are classified as obese (Ogden,
Carroll, Kit, & Flegal, 2014). Out of the top 10 causes of mortality in the United States, 5 are related to obesity, including heart disease, stroke, diabetes, kidney disease and some cancers (Schmitz et al., 2013). Dietary restraint, the deliberate restriction of caloric intake for the purpose of weight loss or weight maintenance (Herman, 1975), has become a widespread method of weight control (Kruger, Galuska, Serdula, & Jones, 2004). However, many studies have failed to show a significant association between dietary restraint scales and caloric intake (Stice et al., 2010). Further, high dietary restraint has been linked to prospective weight gain and eating pathology (Snoek et al., 2008; van Strien, Herman, & Verheijden, 2014). Individuals with high and low reported eating restraint typically do not differ on palatability ratings of food, but there is mixed evidence regarding restrained individuals’ implicit attitudes towards food and how these attitudes may drive consumption (Papies, Stroebe, & Aarts, 2009; Roefs, Herman, MacLeod, Smulders, & Jansen, 2005).
(Harnack et al., 1999; Rosinger, Herrick, Gahche, & Park, 2011). Increased sugar sweetened beverage intake has been epidemiologically and experimentally linked to weight gain, as well as poor diet quality and morbidity (Brownell et al., 2009; Malik et al., 2006). Despite the wealth of research that has accumulated concerning restrained eating, little is known about the relationship between dietary restraint and sugar sweetened beverage consumption.
Lower dietary restraint has been associated with higher levels of sugar sweetened beverage consumption, while consumption of light soft drinks has been associated with higher restraint as well as increased BMI, kg/m2 (Elfhag et al., 2007). Data from the National Diet and Nutrition Survey (NDNS) in the UK showed that higher restrained eating was associated with fewer kilocalories from beverages but not with drink
frequency, again suggesting that restrained eaters may chosen lower-calorie diet drinks over SSBs (Olea López & Johnson, 2016). Restrained eaters may be more likely to consume diet drinks with the intention of caloric restriction; however, in females with eating restraint, substituting sugar sweetened beverages with diet drinks does not reduce total energy intake and may even result in a higher intake during the following day (Lavin, French, & Read, 1997).
result (Coelho, Nederkoorn, & Jansen, 2014; Polivy, Coleman, & Herman, 2005). There is still much to learn about whether dietary restraint influences hedonic ratings of food and beverage, and how these ratings translate to patterns of consumption.
2.1 Dietary Restraint
Dietary restraint is defined as an individual’s intention to consume less than desired. High levels of dietary restraint have been linked to the development of eating disorders (Delinsky & Wilson, 2008; Katherine Schaumberg & Anderson, 2016). Specifically, one longitudinal study found that the relative risk of developing eating disorders for those who diet was 8 times that of those who did not diet (Patton, Johnson-Sabine, Wood, Mann, & Wakeling, 1990). Dietary restraint is also associated with obesity, as high restraint scores have been shown to predict an increase in BMI among women (van Strien et al., 2014). However, high BMI has also been shown to predict restrained eating behavior, rendering the temporality of the relationship unclear (Forrester-Knauss, Perren, & Alsaker, 2012; Snoek et al., 2008).
intake is associated with biological changes that may promote weight regain, such as a slower metabolism, increased ghrelin levels and decreased leptin levels (K. Schaumberg et al., 2016). Finally, a cognitive mechanism that may help to explain the association between dietary restraint and weight gain is perceived deprivation. This concept suggests that restrained eaters may feel deprived when restricting themselves from consuming as much as they desire, but that this restriction may not result in a caloric deficit
(Markowitz, Butryn, & Lowe, 2008). Perceived deprivation has found support in studies that have shown that restrained eaters instructed to “diet as usual” do not lose weight, while those who were to eat as if they were not dieting gained weight (Presnell, Stice, & Tristan, 2008).
There is mixed evidence with regard to how restrained eaters feel about highly palatable food. Studies measuring implicit attitudes have found that individuals with high dietary restraint show stronger implicit preferences for palatable food (Hoefling & Strack, 2008; Houben, Roefs, & Jansen, 2010). In contrast, other studies have shown that while unrestrained eaters evaluate palatable foods more positively than neutral foods, restrained eaters do not (Papies et al., 2009). In addition, some studies found restrained eaters show stronger implicit evaluations of the negative aspects of palatable food, while others found high restraint to correlate with negative explicit but positive implicit attitudes toward these foods (Houben, Roefs, & Jansen, 2012; Papies et al., 2009).
2.2 Sugar Sweetened Beverage Consumption
many calories from SSBs (Long et al., 2015). On a given day, 63% of adults report consuming at least one SSB, contributing an average of 7-13% total daily calories (Bleich, Wang, Wang, & Gortmaker, 2009; Kit, Fakhouri, Park, Nielsen, & Ogden, 2013). Numerous studies have found strong evidence linking SSB intake to weight gain and obesity (Malik et al., 2006). In addition to directly relating to weight gain, there is evidence to suggest that as SSB consumption increases, consumption of more nutritious beverages such as milk and fruit juice decreases (Harnack et al., 1999). For example, in 1991, children age 2-18 consumed 11.7% of their total energy from milk and 6.5% from SSBs, whereas in 2006 only 7.1% of total energy came from milk while 8.5% came from SSBs (Reedy & Krebs-Smith, 2010). It is clear that understanding motivations to
consume SSBs is important for managing the obesity epidemic in the US. 2.3 Summary
As the prevalence of obesity in the US has increased, many individuals have turned to restrained eating as a method of weight control (Santos, Sniehotta, Marques, Carraça, & Teixeira, 2017). However, studies have shown that high levels of dietary restraint may lead to weight gain and disordered eating. SSBs, which have been linked to weight gain and poor diet, now contribute a significant amount to the American diet. Therefore, it is important to understand the ways in which dietary restraint affects SSB consumption. To investigate this relationship, we will assess self-reported dietary restraint using the Dutch Restrained Eating Questionnaire (DRES) and measure SSB consumption through a Food Frequency Questionnaire (FFQ) and ad-libitum intake of a highly rated SSB. We will also study participants’ hedonic ratings of beverages on
CHAPTER 3: METHODS 3.1 Participants
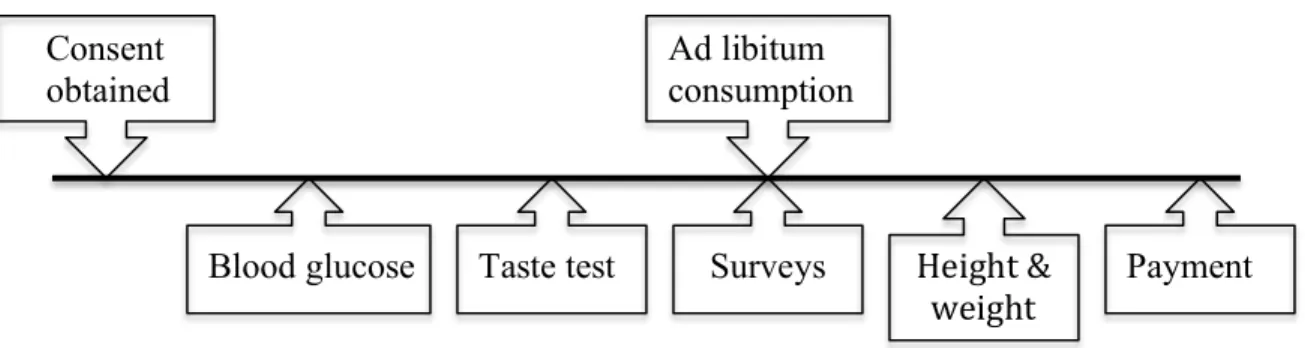
Seventy-eight undergraduate and graduate students (mean ± SD age: 22.4 ± 3.5 y, 25 men and 52 women) from a large, public university in North Carolina were recruited through fliers to participate in a taste test of fruit flavored beverages. Participants had a mean BMI of 23.7 ± 4.0 kg/m2. The sample was 21% Asian, 15% black, 50% white, and 13% mixed race or other. Informed written consent was obtained before data collection; methods were approved by the University of North Carolina at Chapel Hill’s Institutional Review Board.
3.2 Preparation of flavored beverages
A total of 9 beverages were created, with a range of 3 novel flavors made from combining unsweetened Kool-Aid (black cherry orange, pink lemonade cherry, and strawberry kiwi lemonade). Each flavor was divided into 3 varying levels of sweetness: fully sweetened (100 mL sweetener/L), half-sweetened (50 mL sweetener/L) and unsweetened. Participants also tasted colored distilled water. Order of beverage consumption was randomized for each participant.
3.3 Procedure
3.4 Measures
3.4.1 Restrained eating
Restrained eating was measured using the Dutch Restrained Eating Scale (DRES). This questionnaire contains 10 items with a Likert response format ranging from 1
“never” to 5 “always” (sample item: Do you deliberately eat less in order not to become too heavy?). Scores range from 0-4, with higher scores indicating higher levels of
restraint. The scale has shown internal consistency (α’s range from 0.93 to 0.95) and temporal reliability (2-week test-retest r=0.82) (Stice, Fisher, & Lowe, 2004).
3.4.2 Beverage Consumption
Sugar sweetened beverage consumption was measured using a Food Frequency Questionnaire (FFQ), in which participants were asked to report how often they had consumed various beverages in the past 2 weeks (Hu et al., 1999). Total sugar consumed was calculated based on average sugar of the beverages. In validations studies the FFQ showed similar results to dietician assessed diet history (Feunekes, Van Staveren, De Vries, Burema, & Hautvast, 1993). Consumption was also measured by assessing ad libitum intake of highest rated beverage following the taste test, with the beverage weight recorded pre- and post-consumption.
3.4.3 Hedonic and Internal State Ratings
3.4.4 Additional Measures
Body mass index (BMI; kg/m2) was used as a measure of adiposity. Height was measured to the nearest millimeter using a stadiometer and weight was assessed to the nearest 0.1 kg using a digital scale. Non-fasted blood glucose was assessed using a finger prick and glucometer to be used as a covariate in analyses.
3.4.5 Analysis
CHAPTER 4: RESULTS 4.1 Participant Characteristics
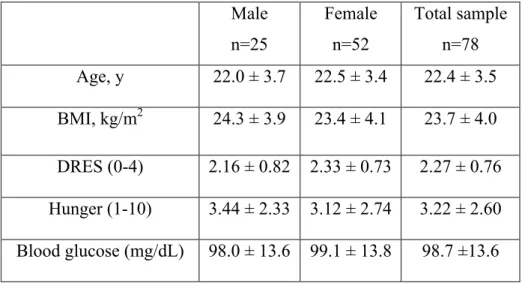
Within our sample, we observed a mean BMI of 23.7 ± 4.0 kg/m2, with a range of 17.4 to 39.1 kg/m2. The sample included 52 females and 26 males, with 21% Asian, 15% black, 50% white, and 13% mixed race or other. Seventy-two percent of these individuals were healthy weight (18.5 to 24.9 kg/m2), 28% were overweight (25 to 29.9 kg/m2) and 6% were obese (>30 kg/m2). Baseline characteristics for the study are summarized in Table 1.
The average score on the Dutch Restrained Eating Scale (DRES) was 2.28 ± 0.76, out of a possible range of 0 to 4. No significant difference was observed in DRES scores or BMI between males and females. Participants reported an average sugar intake of 15.3 ± 14.5 g/day from SSBs in the previous 2 weeks. The average ad libitum SSB intake was 69.8 ± 54.6 g during the study session.
4.2 Results
4.2.1 Dietary Restraint, Beverage Intake and BMI
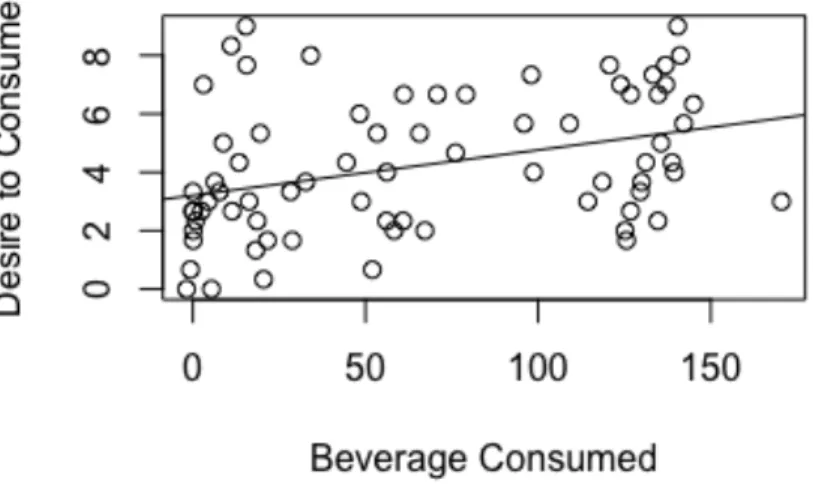
Acute ad libitum intake of the fully sweetened beverage negatively correlated with blood glucose (r=-.35, p=0.005), and positively correlated with time since last meal (r=0.28, p=0.027), and current hunger (r=0.32, p=0.011). Ad libitum beverage intake was also positively associated with ‘desire to consume’ that beverage (r=0.37, p=0.003; Figure 2); this effect remained when controlling for blood glucose, time since last meal, current hunger, and beverage flavor (β=6.02, R2=0.30, p=0.036). Correlations are summarized in Table 2.
4.2.2 Dietary Restraint and Hedonic Ratings
Ratings for beverages are summarized in Table 3. Restrained eating was
negatively related to ‘desire to consume’ the fully sweetened beverages (r=-0.23, p=0.04; Figure 3), and this effect held when controlling for average pleasantness ratings (β=-0.450, R2=0.73, p=0.01). Hedonic ratings did not correlate with BMI or reported SSB intake. Further, there was no significant relationship between restrained eating and desire to consume unsweetened or half-sweetened beverages, nor with pleasantness or
CHAPTER 5: DISCUSSION
The purpose of this study was to determine how dietary restraint affects hedonic ratings and consumption of SSBs. We found BMI positively correlated with dietary restraint, which mirrors what has been seen in the literature (Forrester-Knauss et al., 2012; Snoek et al., 2008; van Strien et al., 2014). Of course, due to the cross-sectional nature of this study, we are unable to draw any conclusions regarding the temporality of this relationship. There was a slight negative association between self-reported total sugar consumed from SSB and dietary restraint. The finding that restrained eaters report
consuming less SSBs than unrestrained eaters is similar to what was found by Goldstein and colleagues (Goldstein, Katterman, & Lowe, 2013). This relationship has been explained by the finding that restrained eaters are more likely to consume diet sodas compared to unrestrained eaters (Elfhag et al., 2007; Olea López & Johnson, 2016). However, we found no correlation between dietary restraint and self-reported diet soda consumption. This suggests that restrained eaters are not replacing SSBs with diet drinks, but rather with other unsweetened drink choices or no drinks at all. Further research would be necessary to determine if restrained eaters are replacing SSBs with another beverage, and, if so, what type of beverage.
eaters will consume the same amount of SSB as unrestrained eaters. There are two possible explanations for this divergence. The first possibility is that the FFQ is not representative of actual intake in this sample, and that restrained eaters are underreporting their SSB consumption. Although the FFQ is a validated measure of assessing dietary consumption, high restraint has been associated with underreporting energy intake (Asbeck et al., 2002; Svendsen & Tonstad, 2006). The second explanation relates to the counterregulatory hypothesis; assuming the taste test acted as a preload, consuming the SSBs may have served to disinhibit the restrained eaters in a way that their typical diet does not. A twin study that examined the effect of a milkshake preload on restrained and unrestrained eaters’ consumption found the twins consumed similar amounts but the restrained twin had higher endogenous ghrelin levels (Myhre et al., 2014). To clarify this relationship, further research should compare consumption without a preload to intake following a preload and consider assessing hormone levels in restrained and unrestrained eaters.
supports research showing restrained eaters only hold these dissociative feelings toward high calorie foods (Hoefling & Strack, 2008). Pleasantness ratings were also independent of dietary restraint, suggesting past researchers were correct in suggesting restrained eaters differ not in their preference for palatable foods, but in their cravings for these foods (Roefs et al., 2005). Research examining implicit attitudes held towards SSBs in individuals with eating restraint could further clarify this relationship.
Given the documented relationship between dietary restraint and disordered eating, a limitation of this study is that we did not screen individuals for eating disorders. This leaves us unable to analyze any potential correlation between reported restraint and disordered eating in this sample. In addition, we cannot assess whether ad libitum intake or self-reported consumption patterns may have been affected by an individual’s eating disorder. The presence of an eating disorder may have also affected individuals’ hedonic ratings of the beverages. Due to the confounding nature of eating disorders, future research should screen participants for eating disorders and consider excluding individuals with disordered eating from studies of this nature.
A final limitation of this study is the population from which we sampled. We focused our recruitment in the School of Public Health, where students typically hold more critical views of SSBs and sugar in general. Unfortunately we did not gather information on students’ program of study, prohibiting us from analyzing this as a confounder. Future research should consider assessing participants preexisting views of SSBs and broad opinions about nutrition in order to account for potential confounders.
In summary, our study adds to the existing body of research on restrained eating, and provides new insight into how high restraint affects hedonic evaluation and
APPENDIX A: DATA TABLES
Table 1. Baseline characteristics of participants (n=78). Male n=25 Female n=52 Total sample n=78 Age, y 22.0 ± 3.7 22.5 ± 3.4 22.4 ± 3.5 BMI, kg/m2 24.3 ± 3.9 23.4 ± 4.1 23.7 ± 4.0 DRES (0-4) 2.16 ± 0.82 2.33 ± 0.73 2.27 ± 0.76 Hunger (1-10) 3.44 ± 2.33 3.12 ± 2.74 3.22 ± 2.60 Blood glucose (mg/dL) 98.0 ± 13.6 99.1 ± 13.8 98.7 ±13.6 No significant differences were observed between genders.
Table 2. Pearson’s correlations between measures
(1) (2) (3) (4) (5) (6) (7) (8)
(1) BMI -
(2) DRES 0.35* -
(3) FFQ 0.21 -0.23 -
(4) Ad Libitum Intake
-0.94 -0.10 0.12 -
(5) Blood Glucose 0.01 0.001 -0.21 -0.35** -
(6) Hunger -0.14 -0.09 0.01 0.32* -0.41** - (7) Pleasantness
(FS)
0.05 -0.10 0.01 0.34** 0.018 0.10 -
(8) Desire to Consume (FS)
0.08 -0.23 0.13 0.37** -0.08 0.12 0.85*** -
Table 3. Hedonic ratings of beverages.
Unsweetened (US) Half-sweetened (HS) Fully-sweetened (FS)
Sweetness*** 1.82 ± 1.43 3.5 ± 1.98 5.78 ± 1.82
Pleasantness*** 1.8 ± 1.53 3.42 ± 1.86 4.87 ± 2.06
Desire to Consume*** 1.5 ± 1.5 2.83 ± 1.87 4.25 ± 2.27
Intensity 4.0 ± 1.9 4.86 ± 2.02 5.2 ± 2.0
APPENDIX B: FIGURES
Figure 1. Timeline of study visit.
Figure 2. Scatterplot showing relationship between dietary restraint and BMI (r=0.35). Consent
obtained
Blood glucose Taste test Surveys Ad libitum consumption
Payment Height &
Figure 3. Scatterplot showing relationship between reported desire to consume SSB and ad libitum SSB consumed (r=0.37).
REFERENCES
Asbeck, I., Mast, M., Bierwag, A., Westenhöfer, J., Acheson, K. J., & Müller, M. J. (2002). Severe underreporting of energy intake in normal weight subjects: use of an appropriate standard and relation to restrained eating. Public Health Nutrition, 5(5), 683–90. https://doi.org/10.1079/PHN2002337
Berridge, K. C. (2009). “Liking” and “wanting” food rewards: brain substrates and roles in eating disorders. Physiology & Behavior, 97(5), 537–50.
https://doi.org/10.1016/j.physbeh.2009.02.044
Bleich, S. N., Wang, Y. C., Wang, Y., & Gortmaker, S. L. (2009). Increasing
consumption of sugar-sweetened beverages among US adults: 1988–1994 to 1999– 2004. The American Journal of Clinical Nutrition, 89(1), 372–381.
https://doi.org/10.3945/ajcn.2008.26883
Brownell, K. D., Farley, T., Willett, W. C., Popkin, B. M., Chaloupka, F. J., Thompson, J. W., & Ludwig, D. S. (2009). The public health and economic benefits of taxing sugar-sweetened beverages. The New England Journal of Medicine, 361(16), 1599– 605. https://doi.org/10.1056/NEJMhpr0905723
Coelho, J. S., Nederkoorn, C., & Jansen, A. (2014). Acute versus repeated chocolate exposure: Effects on intake and cravings in restrained and unrestrained eaters. Journal of Health Psychology, 19(4), 482–490.
https://doi.org/10.1177/1359105312473787
Delinsky, S. S., & Wilson, G. T. (2008). Weight gain, dietary restraint, and disordered eating in the freshman year of college. Eating Behaviors, 9(1), 82–90.
https://doi.org/10.1016/j.eatbeh.2007.06.001
Elfhag, K., Tynelius, P., & Rasmussen, F. (2007). Sugar-sweetened and artificially sweetened soft drinks in association to restrained, external and emotional eating. Physiology & Behavior, 91(2–3), 191–195.
https://doi.org/10.1016/j.physbeh.2007.02.005
Feunekes, G. I., Van Staveren, W. A., De Vries, J. H., Burema, J., & Hautvast, J. G. (1993). Relative and biomarker-based validity of a food-frequency questionnaire estimating intake of fats and cholesterol. The American Journal of Clinical Nutrition, 58(4), 489–96. Retrieved from
http://www.ncbi.nlm.nih.gov/pubmed/8379504
Forrester-Knauss, C., Perren, S., & Alsaker, F. D. (2012). Does body mass index in childhood predict restraint eating in early adolescence? Appetite, 59(3), 921–926. https://doi.org/10.1016/j.appet.2012.08.026
Behaviors, 14(2), 237–240. https://doi.org/10.1016/j.eatbeh.2012.12.002
Harnack, L., Stang, J., & Story, M. (1999). Soft Drink Consumption Among US Children and Adolescents. Journal of the American Dietetic Association, 99(4), 436–441. https://doi.org/10.1016/S0002-8223(99)00106-6
Herman, C. P. (1975). Restrained and unrestrained eating. Duke University Press. Retrieved from
http://vb3lk7eb4t.search.serialssolutions.com.libproxy.lib.unc.edu/?ctx_ver=Z39.88-
2004&ctx_enc=info%3Aofi%2Fenc%3AUTF-8&rfr_id=info%3Asid%2Fsummon.serialssolutions.com&rft_val_fmt=info%3Aofi %2Ffmt%3Akev%3Amtx%3Ajournal&rft.genre=article&rft.atitle=Restra
Hoefling, A., & Strack, F. (2008). The tempting effect of forbidden foods. High calorie content evokes conflicting implicit and explicit evaluations in restrained eaters. Appetite, 51(3), 681–9. https://doi.org/10.1016/j.appet.2008.06.004
Houben, K., Roefs, A., & Jansen, A. (2010). Guilty pleasures. Implicit preferences for high calorie food in restrained eating. Appetite, 55(1), 18–24.
https://doi.org/10.1016/j.appet.2010.03.003
Houben, K., Roefs, A., & Jansen, A. (2012). Guilty pleasures II: Restrained eaters’ implicit preferences for high, moderate and low-caloric food. Eating Behaviors, 13(3), 275–277. https://doi.org/10.1016/j.eatbeh.2012.03.007
Hu, F. B., Rimm, E., Smith-Warner, S. A., Feskanich, D., Stampfer, M. J., Ascherio, A., … Willett, W. C. (1999). Reproducibility and validity of dietary patterns assessed with a food-frequency questionnaire. The American Journal of Clinical Nutrition, 69(2), 243–249. https://doi.org/10.1093/ajcn/69.2.243
Kit, B. K., Fakhouri, T. H., Park, S., Nielsen, S. J., & Ogden, C. L. (2013). Trends in sugar-sweetened beverage consumption among youth and adults in the United States: 1999–2010. The American Journal of Clinical Nutrition, 98(1), 180–188. https://doi.org/10.3945/ajcn.112.057943
Kruger, J., Galuska, D. A., Serdula, M. K., & Jones, D. A. (2004). Attempting to lose weight. American Journal of Preventive Medicine, 26(5), 402–406.
https://doi.org/10.1016/j.amepre.2004.02.001
Lavin, J. H., French, S. J., & Read, N. W. (1997). The effect of sucrose- and aspartame-sweetened drinks on energy intake, hunger and food choice of female, moderately restrained eaters. International Journal of Obesity and Related Metabolic
Claire Wang, Y. (2015). Cost Effectiveness of a Sugar-Sweetened Beverage Excise Tax in the U.S. American Journal of Preventive Medicine, 49(1), 112–123.
https://doi.org/10.1016/j.amepre.2015.03.004
Malik, V. S., Schulze, M. B., & Hu, F. B. (2006). Intake of sugar-sweetened beverages and weight gain: a systematic review. The American Journal of Clinical Nutrition, 84(2), 274–88. Retrieved from http://www.ncbi.nlm.nih.gov/pubmed/16895873
Markowitz, J. T., Butryn, M. L., & Lowe, M. R. (2008). Perceived deprivation, restrained eating and susceptibility to weight gain. Appetite, 51(3), 720–722.
https://doi.org/10.1016/j.appet.2008.03.017
Myhre, R., Kratz, M., Goldberg, J., Polivy, J., Melhorn, S., Buchwald, D., … Schur, E. A. (2014). A twin study of differences in the response of plasma ghrelin to a milkshake preload in restrained eaters. Physiology & Behavior, 129, 50–56. https://doi.org/10.1016/j.physbeh.2014.02.008
Ogden, C. L., Carroll, M. D., Kit, B. K., & Flegal, K. M. (2014). Prevalence of childhood and adult obesity in the United States, 2011-2012. JAMA, 311(8), 806–14.
https://doi.org/10.1001/jama.2014.732
Olea López, A. L., & Johnson, L. (2016). Associations between Restrained Eating and the Size and Frequency of Overall Intake, Meal, Snack and Drink Occasions in the UK Adult National Diet and Nutrition Survey. PLOS ONE, 11(5), e0156320. https://doi.org/10.1371/journal.pone.0156320
Papies, E. K., Stroebe, W., & Aarts, H. (2009). Who likes it more? Restrained eaters’ implicit attitudes towards food. Appetite, 53(3), 279–287.
https://doi.org/10.1016/j.appet.2009.07.001
Patton, G. C., Johnson-Sabine, E., Wood, K., Mann, A. H., & Wakeling, A. (1990). Abnormal eating attitudes in London schoolgirls--a prospective epidemiological study: outcome at twelve month follow-up. Psychological Medicine, 20(2), 383–94. Retrieved from http://www.ncbi.nlm.nih.gov/pubmed/2356264
Polivy, J., Coleman, J., & Herman, C. P. (2005). The effect of deprivation on food cravings and eating behavior in restrained and unrestrained eaters. International Journal of Eating Disorders, 38(4), 301–309. https://doi.org/10.1002/eat.20195 Presnell, K., Stice, E., & Tristan, J. (2008). Experimental investigation of the effects of
naturalistic dieting on bulimic symptoms: Moderating effects of depressive symptoms. Appetite, 50(1), 91–101. https://doi.org/10.1016/j.appet.2007.06.002 Reedy, J., & Krebs-Smith, S. M. (2010). Dietary sources of energy, solid fats, and added
Roefs, A., Herman, C. P., MacLeod, C. M., Smulders, F. T. Y., & Jansen, A. (2005). At first sight: how do restrained eaters evaluate high-fat palatable foods? Appetite, 44(1), 103–114. https://doi.org/10.1016/j.appet.2004.08.001
Rosinger, A., Herrick, K., Gahche, J., & Park, S. (2011). Key findings Data from the National Health and Nutrition Examination Survey. Retrieved from
https://www.cdc.gov/nchs/data/databriefs/db271.pdf
Santos, I., Sniehotta, F. F., Marques, M. M., Carraça, E. V, & Teixeira, P. J. (2017). Prevalence of personal weight control attempts in adults: a systematic review and meta-analysis. Obesity Reviews : An Official Journal of the International
Association for the Study of Obesity, 18(1), 32–50. https://doi.org/10.1111/obr.12466
Schaumberg, K., & Anderson, D. (2016). Dietary restraint and weight loss as risk factors for eating pathology. Eating Behaviors, 23, 97–103.
https://doi.org/10.1016/j.eatbeh.2016.08.009
Schaumberg, K., Anderson, D. A., Anderson, L. M., Reilly, E. E., & Gorrell, S. (2016). Dietary restraint: what’s the harm? A review of the relationship between dietary restraint, weight trajectory and the development of eating pathology. Clinical Obesity, 6(2), 89–100. https://doi.org/10.1111/cob.12134
Schmitz, K. H., Neuhouser, M. L., Agurs-Collins, T., Zanetti, K. A., Cadmus-Bertram, L., Dean, L. T., & Drake, B. F. (2013). Impact of obesity on cancer survivorship and the potential relevance of race and ethnicity. Journal of the National Cancer
Institute, 105(18), 1344–54. https://doi.org/10.1093/jnci/djt223
Snoek, H. M., van Strien, T., Janssens, J. M. A. M., & Engels, R. C. M. E. (2008). Restrained eating and BMI: A longitudinal study among adolescents. Health Psychology, 27(6), 753–759. https://doi.org/10.1037/0278-6133.27.6.753
Stice, E., Fisher, M., & Lowe, M. R. (2004). Are Dietary Restraint Scales Valid Measures of Acute Dietary Restriction? Unobtrusive Observational Data Suggest Not.
Psychological Assessment, 16(1), 51–59. https://doi.org/10.1037/1040-3590.16.1.51 Stice, E., Sysko, R., Roberto, C. A., & Allison, S. (2010). Are dietary restraint scales
valid measures of dietary restriction? Additional objective behavioral and biological data suggest not. Appetite, 54(2), 331–9. https://doi.org/10.1016/j.appet.2009.12.009 Svendsen, M., & Tonstad, S. (2006). Accuracy of food intake reporting in obese subjects
mass change. A 3-year follow up study in a representative Dutch sample. Appetite, 76, 44–49. https://doi.org/10.1016/j.appet.2014.01.015
Witt, A. A., & Lowe, M. R. (2014). Hedonic hunger and binge eating among women with eating disorders. International Journal of Eating Disorders, 47(3), 273–280.
https://doi.org/10.1002/eat.22171
Wyatt, S. B., Winters, K. P., & Dubbert, P. M. (2006). Overweight and Obesity: Prevalence, Consequences, and Causes of a Growing Public Health Problem. The American Journal of the Medical Sciences, 331(4), 166–174.