"Transit Accessibility's Impact on Community Composition: a Study of Changing Demographics and Housing Markets Proximate to Rapid Transit"
Wilson Henry Geography Honors Thesis
Introduction
It is now a well-known fact in the urban planning community that researchers have
proven that individuals living within transit-oriented developments (TODs) drive less on
average. In light of this discovery, TODs were heralded as a means to curb automobile usage in
central cities, thereby reducing traffic and impacts on the environment. While there is no
universally agreed upon definition of transit-oriented development, definitions vary little and
generally describe TODs as walkable, compact and mixed-use developments proximate to a
transit station (Duncan 2011). TODs could potentially improve communities by lowering
automobile usage and increasing economic activity in some ways (Cervero 1995), yet studies
show that the characteristics of TOD – pedestrian-friendly urban form, transit accessibility and a
mixture of uses – contribute to high real estate property values (Duncan 2011; Kahn 2007).
Existing research on TODs, including research indicating higher property values, has been
focused on the development of “transit villages” on green field sites, sites which have not
previously been developed (Hess 2004). Current research provides little insight into what impact
TOD would have in the inner city. Current research on TOD has been limited by lack of
long-term information since the institutionalized practice of planning for transit-oriented development
is a relatively new phenomenon in the world of urban planning (Hess 2004).
Despite the lack of knowledge about how TOD impacts vulnerable members of society,
TOD has been embraced by the California State Government. California planners identified
several communities proximate to transit which were favorable sites for TOD, and then removed
zoning restrictions, making these sites attractive to the kind of development which characterizes
TOD. The TOD communities identified and bolstered by the California State Government are
located in the Bay Area and in the Los Angeles and San Diego metropolitan areas. The research
conducted in this study seeks to build on the research identifying gentrification, indicated by
demographic shifts, is a possible byproduct of transit accessibility, a defining element of TOD.
This paper attempts to determine if transit accessibility can be connected to
gentrification, i.e. whether communities experienced gentrification following the introduction of
transit. The State of California has designated four communities surround Metro stations as
TOD: the Gateway Plaza-Union Metro Station in Los Angeles, the Holly Street
Village-Memorial Park Metro Station in Pasadena, the Hollywood-Highland Metro Station in Los
Angeles, and the Wrigley Marketplace-Willow Metro Station in Long Beach. Rather than
limiting research to four transit stations, this paper focuses its analysis in Los Angeles County
along LA Metro Rail’s four lines which opened prior to 2010. For the purposes of this study,
TOD is defined as the block groups within a one-mile, walkable service area from transit
stations.
This study utilizes linear regression to determine the ability of transit accessibility to
predict gentrification. In order to determine whether or not gentrification has occurred, three
variables will be measured for 1990 and 2010: the percentage of the population which is
black/African American, the homeownership rate for black/African American householders, and
the overall homeownership rate. Change in these percentages are regressed alongside two
independent variables: transit accessibility and the year the closest transit station opened, which
is included in order to account for different levels of change between communities which have
long had transit and those which have only recently been connected to a rapid transit system.
This study hypothesizes that census block groups with greater accessibility to transit will have
composition in the total population, increased homeownership and decreased black
homeownership.
Literature Review
“Transit villages”, as defined by Robert Cervero and Michael Vernick in their landmark
book Transit Villages in the 21st Century, are essentially TOD that developed outside
government interference as a market-driven phenomenon. These villages were first described in
1996 in the context of San Francisco, where researchers noticed the development of several
dense communities along transit lines. (Bernick 1996). This period marks the genesis of
transit-oriented development purely as a market-driven phenomenon before the interference of the
California State Government. Early TODs were not the product of government planning; rather,
they arose out of market demand. Early TOD-style “transit villages” were generally populated by
mid- to high-income households (Bernick 1996). Individuals living in these “transit villages”
also depended less on usage of private automobiles, using transit and other alternative modes of
transit, e.g. walking, biking, etc., to travel to and from work and for shopping trips (Hess 2004).
Hoping to recreate the observed travel patterns of individuals living in these market-driven
“transit villages,” the California State Government introduced legislation in the early-1990s to
encourage TOD-style development. This legislation allowed for easier partnership between
transit authorities and developers. Is also cleared the way for changes in zoning ordinances to
allow for TODs since traditional Euclidian zoning, based on the separation of uses, prevents
TOD-style development (Duncan 2011).
While many studies have touted the power of TODs to decrease automobile dependence,
these studies have looked primarily at TOD-style development occurring on greenfield sties
(Kahn 2007). Relatively little literature is available on the affects TODs can have on existing
(Duncan 2011). With easy access to metropolitan areas’ central cities, walkable environments,
and close retail stores, TODs are often thought of as more livable than traditional-development
communities. This increased livability is thought to attract new residents and the increased
demand for TOD in the inner-city has been shown to drive up real estate prices (Duncan 2011;
Kahn 2007). Increased list prices for for-sale and corresponding increased rental prices for
residential properties cause gentrification. Gentrification is a process by which communities
experience demographic changes that are characterized by increases in median household
income, less representation of racial and ethnic minorities as a percentage of the population, and
greater representation of college graduates (Kahn 2007).
Specific to the area of study examined within this paper, Gen Fujioka provides a narrative
perspective on gentrification due to transit-oriented development in one Los Angeles community
(2011). Boyle Heights, a predominantly Latino neighborhood, began to experience gentrification
following the opening of the LA Metro Gold Line (Fujioka 2011). Boyle Heights surrounds Soto
Station and has a dense network of roads, making the neighborhood a suitable location for
transit-oriented development. Community activists alleged that landlords were seeking to evict
tenants (Fujioka 2011). In the case of Boyle Heights, TOD-induced gentrification was mitigated
through community organizing and the recession of the late 2000s (Fujioka 2011). This insight,
while valuable, is specific to one location and does not attempt to quantify change.
The US Decennial Census provides information regarding demographic and housing
trends in the United States every ten years. Though the wealth of information provided by the
Census has eroded due to the 2010 replacement of the long-form census by the American
Community Survey for much data collection, the Census continues to offer a valuable glimpse of
the state of the nation. However, comparing Census data at fine resolutions, e.g. at the block,
block group, and tract levels, over time can be difficult because of changing Census geographies.
The boundaries of blocks, block groups, and tracts are often redrawn between censuses to
account for changing population distribution. Thus, a one-to-one comparison, which is necessary
for analysis of change over time, cannot be easily achieved with fine-scale census data.
Areal interpolation can be used in comparing Census data across time by harmonizing
data geographies. Areal interpolation extends kriging theory to predict a variable at a given
location based on polygon data. Interpolated data can then be reaggregated to a new set of
polygons. For example, areal interpolation can be used to downscale population counts to census
tracts based on the population count of the county. While this approach can be extremely useful,
the accuracy of reaggregated data from areal interpolation cannot be guaranteed. Research has
explored the accuracy of using areal interpolation for temporal analysis of the British Census
(Gregory & Ell 2006). When reaggregating downscaled data, areal interpolation introduced
considerable error when compared to the more intensive approach of dasymetric intelligent
mapping (DIM). DIM weights areal interpolation using secondary data. The addition of this
secondary data greatly increases the complexity of interpolation, yet it improves the accuracy of
reaggregated data over simple areal interpolation (Holt et al. 2004). While the DIM approach
using secondary data greatly improves the accuracy of downscaled reaggregated data, upscaled
data is not as vulnerable to inaccuracy of areal interpolation (Gregory & Ell 2007). When
upscaling data, the initial polygons provide a greater richness of information than will be
represented in the upscaled geography, thus secondary data and DIM do not perform
Data
Demographic and housing data from the US Decennial Censuses of 1990 and 2010 were
obtained through the National Historical Geographic Information System (NHGIS), a historical
geographic system venture of the Minnesota Population Center. Census data tables that were
collected and studied for the purposes of this study contained information regarding race,
residential tenure, and residential tenure by race of householder. The 1990 Census data were
obtained at the block level, while the 2010 Census data were obtained at the block group level.
These differing geographies were necessary in order to increase the validity of 1990 data in the
2010 geographies for reasons which will be discussed later in this paper.
A shapefile of roads in Los Angeles County built by Tele Atlas North America, Inc. was
used to carry out this study. This shapefile reflects the road network as it stood in 2006, an
intermediate date in terms of the scope of the study. Shapefiles of the transit stations for five
metro lines in Los Angeles County were obtained through the LA Metro Rail. The shapefiles
depict stations on the Blue, Red, Purple, Green, and Gold Lines. The Expo Line was omitted
from this study due to its late opening in 2012.
Methodology
From the 2006 Tele Atlas North America shapefile depicting the roads in Los Angeles
County, all of the major highways, major highway connectors, ramps, and roads with speed
limits of 65 were removed. These types of roads were believed to have low levels of walkability,
therefore they were not relevant for the purposes of this study. The resulting streets shapefile,
featuring only the streets deemed walkable, was used to build a network dataset. Once built, this
network dataset was used to produce a five-mile service area. The 70 transit stations which were
built prior to 2010, composing the Blue, Red, Purple, Green and Gold Lines, were set as the
facilities of the service area.
Data from the 1990 and 2010 US Decennial Censuses were obtained for the purposes of
this study. 1990 Census data was obtained at the level of census blocks with a corresponding
1990 census block shapefile. 2010 Census data was collected at the block group level with a
corresponding 2010 census block group shapefile. From the 2010 block group shapefile, a new
shapefile representing the centroid of each 2010 block group was created. Using these 2010
block group centroids as the point location of the block groups, the five-mile service area
polygons were used to extract 2010 Census block groups with centroids contained within the
service area polygons. In order to simplify later areal interpolation of 1990 block-level data and
the analysis of changes in communities, the 2010 block groups contained within the five-mile
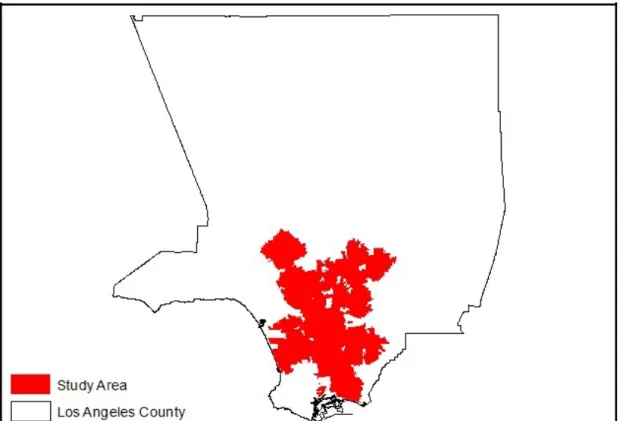
service areas formed the geographic extent of this study. Figure 1 provides a view of the study
area within the context of Los Angeles County. Figure 2 provides a closer look at the study area
by zooming in on the study area in southern Los Angeles County and maps the transit stations
Figure 1: Study Area within Los Angeles County
Figure 2: Study Area and Metro Stations
1990 Census blocks which intersected with the study area were extracted. Data contained
within this 1990 census blocks were then interpolated. Rate (binomial) interpolation was used to
create three interpolated data surfaces. These interpolated surface depicted the percentage of the
African-American population, the rate of homeownership for housing units occupied by African
Americans, and rate of homeownership for all occupied housing units. The variography of each
areal interpolation was manually changed in order to ensure the fitness of models for areal
interpolation. Once areal interpolation was complete for each of these counts, the interpolated
1990 block-level data were reaggregated to 2010 block groups. The results of this reaggregation
are displayed in Figures 3, 4, and 5.
Figure 4: Homeownership Rate for Housing Units Occupied by African Americans
Figure 5: Homeownership rate for Occupied Housing Units
Following reaggregation of 1990 data to 2010 block groups, the same data were
calculated for 2010. Using 2010 Census block-group level data, the African American
percentage of the population, the rate of homeownership for housing units occupied by African
Americans, and the overall rate of homeownership for all housing units were calculated. The
2010 data was then compared to the 1990 data; these time series data were used to calculated
change statistics. These change statistics were calculated by differencing the two observations
for each of the three percentage variable-types – 2010 percentages were subtracted from 1990
percentages.
An OD Cost Matrix was then generated in ArcMap 10.1. This OD Cost Matrix
determined the network distance from each block group of study to the closest LA Metro Rail
station. For the purposes of this process, the previously created centroids of each block group
were used as the origins and the metro stations were used as the destinations. Only the network
distance from a block group to the closest metro station was calculated and the cut-off
impedance for the OD Cost matrix was set to one mile. The one-mile cut-off insures that the
network distances from block groups to metro stations were only calculated if the metro station
was a mile or less away from the 2010 block group centroid. One mile was selected as the cut-off
because pedestrian accessibility of a metro station degrades considerably beyond a mile.
Much of the existing literature on transit-oriented development places the theoretical
extent of TOD at a half-mile to a mile from a rapid transit station (Dittmar & Poticha 2004).
Beyond a single mile, rapid transit stations are not accessible to pedestrians and network distance
becomes a meaningless variable for the purposes of this study. In order to capture the theoretical
accessibility scores are modeled after the hypothesis that network distance matters only within a
half mile and that closer block groups are more affect by transit. For each block group within one
mile of a metro station, this accessibility variable was calculated by subtracting the network
distance between the block group and the station from 1. For block groups more than a mile from
a metro station, the accessibility variable was set to zero. Thus block groups closest to a metro
station possess transit accessibility scores closest to one. Transit accessibility scores decrease,
approaching zero, as block groups are increasingly closer to a mile from a metro station. For
block groups a mile or more from the closest metro station, the transit accessibility score equals
zero.
A final variable was added for those 2010 block groups within a one-mile network
distance from a metro station. The year the closest transit station opened was added to these
select block groups. Opening years range from 1990 to 2009. The later a transit station was
opened, the less change one would expect to see in the three change variables. This variable is
only pertinent for block groups within a one-mile network distance from a metro station because
it is only these block groups which are theoretically impacted by accessibility to transit; for all
other block groups, is does not matter when the nearest transit station opened because the
station’s location theoretically has no impact on block groups more than a mile from the transit
station.
For each 2010 block group within a five-mile service area of transit stations, the
following variable are known: the change in the percent of the total population which is black,
the rate of homeownership for African American households, the homeownership rate for all
households, the transit accessibility score, and the year the closest transit station opened. Using
the statistical analysis software Stata, multivariate linear regression were run on the three
percentage change variables, using the accessibility score and the year of the closest station’s
Results
Presented in Tables 1 through 3 are the results of the statistical analysis of change data
for the 2010 block groups within the 5-mile service areas of metro stations. The results of linear
regression of the change in the percentage of the population which is Black/African American
alongside the block groups’ accessibility score and the year of the closest stations’ opening are
displayed in Table 1. The low p-value indicates that the accessibility variable is a statistically
significant predictor of change in the African American composition of block groups at the 95%
confidence level. This affirms the connection between transit accessibility and changing
community demographics. The low R2 value, .0752, indicates that the model does not explain the
majority of the trend. While transit accessibility was proven its impact on the percentage of the
population which is black is the opposite of the hypothesis.
Accurate interpretation of the coefficient is extremely important. A negative coefficient
indicates that increasing transit accessibility predicts decreasing change in the percent black
population. Decreasing change does not mean that the 1990 and 2010 are more similar, rather it
means that the 2010 measurement is increasing relative to the 1990 measurement as block groups
are closer to transit stations. With a negative coefficient of -0.2734587, increasing transit
accessibility actually results in decreasing change; as transit accessibility increases, the percent
of the population which is African American is predicted to increase from 1990 to 2010. Thus,
block groups closer to metro stations actually saw smaller decreases in black composition or
larger increases in that same racial representation. Either way, these results suggest that transit
accessibility positively impacts racial diversity. The variable “year” was also shown to be
statistically significant at the 95% confidence-level. The coefficient for this “year” as a predictor
of change in African American composition of block groups indicates that changes in the
variable “year” have relatively little impact on the change variable.
Results from the linear regression of the change in African American homeownership are
shown in Table 2. In this regression, the accessibility score failed to meet statistical significance.
The p-value, .967, does not meet any commonly accepted level of significance. Due to this
finding, no claim can be made about a connection between transit accessibility and African
American homeownership rates. The “year” variable did, however, again achieve statistical
significance. The small coefficient indicates that change in the “year” variable has little impact
on homeownership rates for black householders, thus it is relatively unimportant for analysis.
Moreover, the results for the “year” variable mean relatively little due to the theoretical
assumption that the “year” variable only matters within the context of the “accessibility”
variable. For this model, the calculated R2 value was .0177.
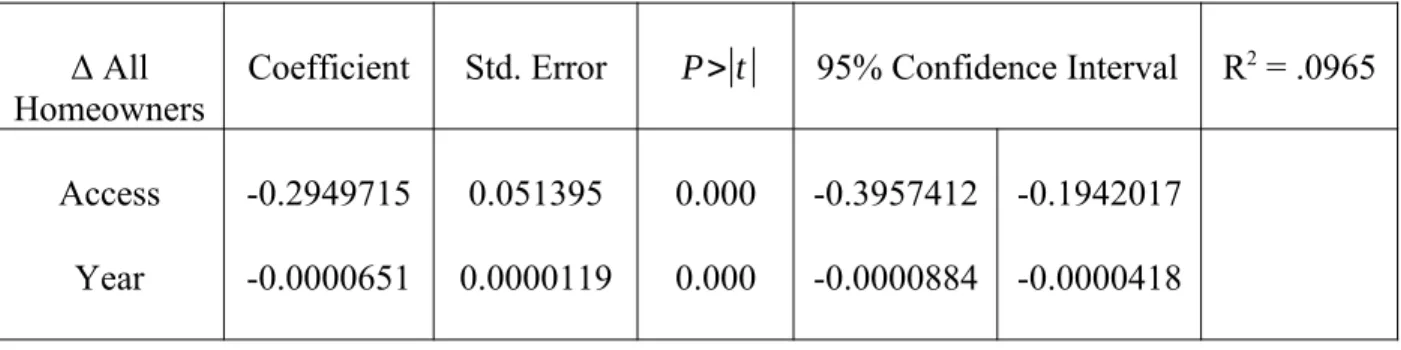
Shown in Table 3, linear regression of the change in homeownership rates alongside
block group accessibility score and the year of the closest stations’ opening yielded statistically
significant p-values for both independent variables. The low p-value indicates that the
accessibility variable is a statistically significant predictor of change in homeownership rates at
the 95% confidence level. With an R2 value of .0965, this model accounts for roughly 10% of the
trend. This indicates that there is far more which is left unaccounted for by this model.
Like the “accessibility” coefficient from the regression on change in black population
composition, accurate interpretation of the coefficient is important to understand the impact of
transit accessibility on homeownership rates. A negative coefficient indicates that increasing
transit accessibility predicts decreasing change in homeownership rates. Again, decreasing
change does not mean that the 1990 and 2010 are more similar, rather it means that the 2010
in decreasing change in homeownership rates. Thus, block groups closer to metro stations
actually saw smaller decreases in homeownership rates or larger increases in those same rates.
Both of these explanations suggest that transit accessibility positively impact homeownership
rates.
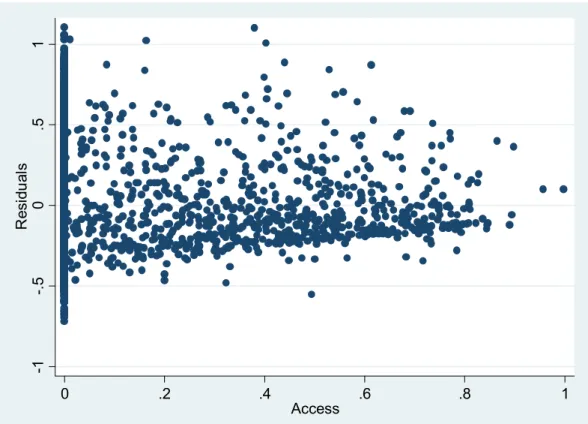
Following basic analysis of p-values and coefficients, residuals plots provide information
about how each regression model fit its change variable. Figures 6, 7, and 8 display residual
plots, graphing each dependent variable – the change in the percent of the population which is
black/African American, the change in homeownership rates for African Americans, and the
change in homeownership rates overall – versus the accessibility variable, the primary
independent variable. For each residual plot, there is a clear pattern to the dispersion of residuals.
Because residuals are not randomly dispersed, this suggests that a linear model is not most
suitable for the data. This finding does not negate the observed connections between increasing
transit accessibility and two of the change variables, yet these plots do suggest that non-linear
regression models might be better suited for this data.
In order to understand the spatial distribution of residuals, each block group’s residual
value was determined. These values were then mapped in order to understand where the each
regression model was consistently over-predicting or under-predicting change. These maps are
displayed in Figures 8, 9, and 10. Between the two models for which transit accessibility proved
to be a statistically significant predictor – change in the percentage of the population which is
black/African American and change in the overall homeownership – most of the same block
groups close to transit are over- or under-predicted. There is a spatial pattern among these block
group characterized by over- or under-prediction. Seen in Figures 9 and 10, block groups
characterized by over- or under-prediction surround stations at the outer reaches of metro lines.
Table 1: Change in Percent of Population which is Black, 2010 Block Groups within 5 Miles
Δ Percent
Black Coefficient Std. Error P
>|t| 95% Confidence Interval R2 = .0752
Access -0.2734587 0.0450342 0.000 -0.361756 -0.1851614
Year -0.0000396 0.0000104 0.000 -0.00006 -0.0000192
Table 2: Change in Rate of Black Homeownership, 2010 Block Groups within 5 Miles
Δ Black Homeowners
Coefficient Std. Error P>|t| 95% Confidence Interval R2 = .0177
Access 0.0013257 0.0321901 0.967 -0.0617891 0.0644405
Year 0.0000325 0.0000074 0.000 0.0000179 0.000047
Table 3: Change in Rate of Homeownership, 2010 Block Groups within 5 Miles
Δ All Homeowners
Coefficient Std. Error P>|t| 95% Confidence Interval R2 = .0965
Access -0.2949715 0.051395 0.000 -0.3957412 -0.1942017
Figure 6: Residual (Change in Percent of Population which is Black) vs Accessibility -1 -. 5 0 .5 1 R es id u al s
0 .2 .4 .6 .8 1
Access
Figure 7: Residual (Change in Rate of Black Homeownership) vs Accessibility
-1 -. 5 0 .5 1 R es id u al s
0 .2 .4 .6 .8 1
Access
Figure 8: Residual (Change in Rate of Homeownership) vs Accessibility
-1
-.
5
0
.5
1
R
es
id
u
al
s
0 .2 .4 .6 .8 1
Access
Figure 10: Residual Map (Change in Black Homeownership)
Figure 11: Residual Map (Change in Homeownership)
Discussion:
The results of the multiple linear regressions provide insights into the impact transit
accessibility has on changes in racial composition and homeownership for the general population
and Black/African American households. Results discredit the hypothesis that improving transit
accessibility negatively impacts African American representation within communities over time.
On the other hand, increasing transit accessibility was shown to positively impact
homeownership rates, supporting the original hypothesis. These seemingly conflicting results
further draw into question the connection between transit accessibility and gentrification.
Connections between decreasing change in the percentage of the black population and
increasing transit accessibility could be due to the greater transit dependence of African
Americans compared to the overall population (Raphael 2000). African Americans traditionally
have lower rates of car ownership, and it is possible that African Americans have gravitated to
communities near transit since the opening of metro stations. A second possible explanation for
the connection between increasing transit accessibility and decreasing change in homeownership
rates could be affordable housing in the area.
Recognizing the potential for gentrification surrounding rapid transit stations, some
proactive communities have responded by protecting affordable housing in these communities
(Fitzgerald 2013). African Americans have historically been and continue to be over-represented
within the American public housing system (Carter 2011). Therefore, the possible decision to
concentrate public housing around metro stations could explain the connection between
decreasing change in black composition and increasing transit accessibility.
around transit. Developers may recognize the increased desirability of living in a community
with high accessibility to transit (Kahn 2007). In recognizing this consumer demand, new
residential properties near transit station could have been built for sale rather that rent. This
possible shift in housing markets could partially explain the connection between increasing
transit accessibility and decreasing change in homeownership rates.
There are many possible explanations for the changes from 1990 to 2010. Each
explanation could account for some of the change, yet it is unlikely that any one of these
explanations would account for all of the exhibited change. For example, an increase in building
residential units for sale could explain the exhibited decreasing change homeownership rates
associated with increasing transit accessibility. However, even if there were such a shift in
housing markets, it is unlikely that this alone would explain all the change exhibited.
The low R2 values for the regressions indicates that there is far more to be accounted for.
The two dependent variables, change in percent of the population which is black and change in
homeownership rates, for which both independent variables possess R2 values of less
than .10: .0752 and .0965, respectively. These low R2 values do not diminish the importance of
transit accessibility and the “year” variable in predicting change, but they do indicate that these
variable are not entirely responsible for the changes exhibited. Gentrification is a complex
process driven by multiple forces, therefore the low R2 values are expected. However,
information presented in the residual maps, particularly Figures 9 and 11, suggest the addition of
a particular variable could improve the R2 values of regression models for the change in the
percent of the population which is African American and the change in overall homeownership
rates. Since over- and under-predicted block groups generally surround transit stations at the
outer edges of metro lines, a variable accounting for the connectivity of the closest station within
the transit network could possibly improve the accuracy of predictions for changes in the percent
of the population which is African American and changes in homeownership rates for all
Limitations
Interpolation of 1990 block-level census data in order to reaggregate that data at the 2010
block level was the only available way of being able to make a one-to-one comparison from
1990 to 2010. This one-to-one comparison was needed in order to perform linear regressions to
determine the correlation between shifts in community demographics and housing markets from
1990 to 2000. Assuming that this interpolation approach yields entirely accurate results,
however, would be a detrimental claim. Interpolation merely displays trends in polygon data.
Moving from a more fine grain census geography, i.e. blocks, to a larger census
geography, i.e. block groups, helps the validity of the methodology utilized in this paper. This
study is an example of upscaling data, so the reaggregated 1990 block-level data is more
complex in its distribution than the 2010 block group-level data. As discussed earlier in this
paper, a more complex method such as DIM, dasymetric intelligent mapping, does not greatly
improve the accuracy of upscaled, reaggregated data, yet this method would improve the overall
accuracy of this analysis.
A second limitation of this study comes from changes in the US Decennial Census
between 1990 and 2010. In the 1990 census, respondents were asked to report their race.
Available options for reporting one’s race included White, Black/African American, Asian or
Pacific Islander, Native American or Other. If an individual chose to clarify their race in the
provided space due to a mixed racial heritage, as would potentially be the case for an individual
whose heritage were half-White and half-Black, only the first race he/she listed would be
counted.
Enumerable individuals of mixed-race heritage are counted among the single-race
categories. Problems such as this are a difficult reality of working with census data across time.
The designation of mixed-race individuals as a single race does prevent accurate study of some
racial upheaval in communities across time when using Census data, yet useful information can
Recommendations and Conclusion:
Further studies of the impact transit accessibility has on communities is extremely
important moving forward. Planning for transit-oriented development by local and regional
planning boards is becoming more common. If planners are to adopt this approach, we must
understand the full extent of the impact transit accessibility has on community stability. Future
research implementing methods similar to those utilized in this study should include a variable
measuring station connectivity in regression models. These models should also investigate the
accuracy of nonlinear regression models. Beyond improving model accuracy, however, future
studies should widen their theoretical scope to determine the role of many variables in changing
community demographics and housing markets.
Future studies of the impact of transit on community demographics should attempt to
account for the role of public housing tenants and homeowners in transit-proximate
communities. Proactive communities could possibly avoid a high degree gentrification in
transit-proximate communities by recognizing the potential impact transit-accessibility can have on
minority or low-income households. By providing public housing in transit-proximate
communities, the stability of these community in the face of transit-led gentrification of
communities can be greatly improved. It is unclear, however, how this bottom-down approach of
mitigating gentrification through provision of public housing impacts the market-driven
gentrification of communities. In order to determine the impact this approach truly has on the
market-driven gentrification of communities, it would be advisable to account for the role of
affordable housing.
As researchers continue to study the impact of transit accessibility on community
stability, land use should be a key element in analysis. Due to the somewhat coarser scale of
analysis employed in this approach – block groups – land use was not considered. Zoning,
however, can be used by planning boards to govern the ways in which land around transit
stations is developed. Land use zoning can be used to clear the way for residential, commercial,
or even mixed-use development surrounding transit stations. Differences in zoning between rapid
transit stations could explain differences in observed changes within communities.
While land use is an important variable to consider when understanding the connection
between transit accessibility and community stability, integrating land use into the methods
described within this paper would pose great difficulty. Land use is a discrete variable unlike the
variables used within this analysis, thus introducing this variable into regression models would
be problematic. An alternative for integrating land use into the analysis methods used within this
study would be to assign numeric values to land use types, yet this would assume that there was
a continuum along which land use types are located. In actuality, each land use type is complex
and is defined by multiple characteristics, such as density of development and
residential/commercial/industrial use.
Moving forward, studies investigating the impact of transit accessibility and
transit-oriented development on community demographics and housing markets should attempt to
account for the role of affordable housing and land use. Surrounding transit stations, land uses
must provide a mixture of residential and commercial purposes to allow for the development of
true transit-oriented development. While transit-oriented development is a phenomenon which
can result from market driven forces, it will be important to account for top-down forces
encouraging and planning for TOD as planners adopt TOD as an approach to decrease sprawl,
encourage transit usage, and reinvigorate neighborhoods. Separating market-driven forces from
References:
Bernick, Michael & Robert Cervero. Transit Villages in the 21st Century (New York:
McGraw-Hill, 1996)
Carter, George III. “From Exclusion to Destitution: Race, Affordable Housing, and Homeless.”
Discovering Homelessness 13, no. 1 (2011):
http://www.huduser.org/portal/periodicals/cityscpe/vol13num1/ch2.html
Cervero, Robert & John Landis. “Twenty Years of the Bay Area Rapid Transit System: Land
Use and Development Impacts.” Transportation Research Part A: Policy and Practice
31, no. 4 (1997): 309-333.
Cervero, Robert & Roger Gorham. “Commuting in Transit Versus Automobile Neighborhoods.”
Journal of the American Planning Association 61, no. 2 (1995): 210-225.
Dittmar, Hank & Shelley Poticha. “Defining Transit-Oriented Development: The New Regional
Building Block,” in The New Transit Town: Best Practices in Transit-Oriented
Development, edited by Hank Dittmar & Gloria Ohland, 19-40. Washington, DC: Island
Press, 2004.
Duncan, Michael. “The Impact of Transit-oriented Development on Housing Prices in San
Diego, CA.” Urban Studies 48, no. 1 (2011): 101-127.
Fitzgerald, Eileen (CEO of NeighborWorks America) in discussion with the author, June 2013.
Fujioka, Gen. “Transit-Oriented Development and Communities of Color: A Field Report.”
Urban Habitat. 2011. http://www.urbanhabitat.org/land-use/fujioka
Gregory, Ian N. & Paul S. Ell. “Error-sensitive historical GIS: Identifying Areal Interpolation
Errors in Time-Series Data.” International Journal of Geographical Information Science
20, no. 2 (2006): 135-152.
Hess, Daniel Baldwin & Peter A. Lombardi. “Policy Support for and Barriers to Transit-Oriented
Development in the Inner City.” Transportation Research Record, no 1887 (2004):
26-33.
Holt, James B., C.P. Lo & Thomas W. Hodler. “Dasymetic Estimation of Population Density and
Areal Interpolation of Census Data.” Cartography and Geographic Information Science
31, no. 2 (2002): 103-121.
LA Metro Rail. Metro. Los Angeles: LA Metro Rail, 2012.
Kahn, Matthew E. “Gentrification Trends in New Transit-Oriented Communities: Evidence from
14 Cities That Expanded and Built Rail Transit Systems.” Real Estate Economics 35, no.
2 (2007): 155-182.
Minnesota Population Center. National Historical Geographic Information System: Version 2.0.
Minneapolis, MN: University of Minnesota, 2011.
Raphael, Steven & Michael Stoll. Can Boosting Minority Car-Ownership Rates Narrow
Inter-Racial Employment Gaps? Berkeley, CA: University of California, Berkeley, 2000.
Tele Atlas North America, Inc. Los Angeles County Detailed Streets. 2006. Redlands, CA: