Tumor Microenvironment RNA Expression Analysis in Human Xenograft Mice Author: Patrick Short
Research Adviser: Dr. Chuck Perou Biology Faculty Adviser: Dr. Corbin Jones
ABSTRACT
While genomic analysis of tumor cells is a mainstay in cancer research, there is growing interest in the characterization of the tumor microenvironment, comprised of nearby healthy somatic cells, most notably fibroblasts and invading immune cells.
Studying the RNA expression profile of the tumor microenvironment provides a way to analyze local response to tumor growth and ultimately to better characterize bodily
response to different stages or genetic subsets of cancer. The purpose of this research was to develop a tool that efficiently separates tumor sequence data from human xenograft mice (mice with genetically human tumors) into separate microenvironment and tumor
expression profiles. While this separation was previously done by physically excising healthy tissue under a microscope using laser capture microdissection, performing this
separation in silico allows for rapid analysis of hundreds of samples. Further, using this tool, we can re-examine tumor expression profiles after filtering out ‘contaminating’ microenvironment sequence, resulting in a more accurate RNA expression profile.
INTRODUCTION
Variation in gene and transcript expression in breast cancer has been studied using both cDNA microarrays and more recently, RNA-seq. Perou et. al found that tumors can be classified into six subtypes, each distinguished by differences in gene expression
by Perou et. al, luminal A, luminal B, ERBB2-enriched, basal-like, claudin-low and normal-like, respond differently to different therapeutic regimens. For instance, basal-like tumors are most frequently ‘triple-negative’, meaning they lack receptors to estrogen,
progesterone, and HER2. Many therapies target these receptor pathways as the mechanism of treatment. For instance, the estrogen receptor blocker Tamoxifen has
shown tremendous success for ER+ tumors(Abe et al.). For this reason, basal-like tumors which lack all three major receptors, can be hardest to treat. In contrast, luminal A
cancers are estrogen receptor positive and treatable by endocrine therapies that act as
estrogen receptor antagonists.
Griffith and Griffith have found that molecular subtype alone is a predictor of
therapeutic efficacy for more than 25% of therapeutics tested. Including other data sets such as copy number aberration, methylation, and protein expression, however, resulted in prediction of therapeutic efficacy for more then 65% of the compounds tested(Griffith
and Griffith). To provide yet another dimension of useful data alongside characterization of the gene expression profile of the tumor itself, there is great interest in analyzing the
healthy cells surrounding the tumor, known as the tumor microenvironment. Most notably, the tumor environment is comprised of blood vessels, and extracellular matrix that nourish the tumor as well as immune cells, which may invade and attack the tumor,
or even be reprogrammed to promote tumor growth(Whiteside). Characterization of the tumor microenvironment may provide opportunities to design therapies that promote a
In human tumors, it is possible to study the tumor microenvironment using a technique called laser-capture microdissection (LCM)(Espina et al.). Mounting a tissue sample on a glass slide and viewing under a microscope, an ultra-violet laser is used to
excise healthy tissue surrounding clearly malignant or pre-malignant cells. However, LCM requires several hours of tedious microscope work for a single sample and as a
result is ineffective for large-scale analysis. Furthermore, the formalin fixation prior to LCM may result in damage to RNA or proteins as well as low-yield. As the border between tumor cells and healthy somatic cells may be blurred or uneven and LCM relies
on the ability to identify cells on morphological characteristics alone, this physical separation can pose considerable challenges(Espina et al.).
In addition to the motivation to separate microenvironment and tumor cells for analysis of the gene expression in the microenvironment, I hypothesize that standard tumor cell RNA-seq profiles contain an appreciable amount of non-cancerous
microenvironment RNA. Thus, the gene expression profiles may be ‘contaminated’ by the presence of RNA from surrounding healthy tissues and immune cells.
The development of an in silico tool to separate non-cancerous microenvironment RNA from tumor RNA would allow researchers to address the efficiency bottlenecks of LCM as well as explore the extent of microenvironment contamination in tumor
expression analysis. Bioinformatically separating microenvironment and tumor sequences will allow for tremendous gains in throughput—hundreds of samples could be analyzed
in a matter of hours.
separation of microenvironment and tumor RNA sequences. Using human xenograft mice, a mouse model which harbors a genetically human tumor, we leverage the genetic differences between mice and humans to separate the microenvironment sequences
(which are genetically mouse) from the tumor sequences (which are genetically human). This work focuses primarily as a proof-of-principle for the METS
(Microenvironment/Tumor Separation) software presented here as well as a preliminary analysis of tumor microenvironment heterogeneity across samples. The ultimate goal of this project is to apply this workflow to a cohort of human xenograft mouse samples in
order to search for intrinsic microenvironment subtypes, correlate microenvironment expression analysis with tumor expression analysis, and analyze tumor expression after
removing contaminating microenvironment reads.
METHODS
Tumor Microenvironment Analysis
The RNA-seq data presented here comes from 8 human xenograft mouse samples,
5 human controls from The Cancer Genome Atlas (TCGA) and 5 mouse controls. The samples were run on an Illumina Hi-Seq. In order to separate microenvironment sequences from tumor sequences, reads were first aligned to both human and mouse
samples, then re-combined into a single BAM file with ‘mouse’ and ‘human’ read groups. Mapsplice version 2.1.4 was used to perform the alignments and Samtools
version 0.1.19 to merge BAM files.
uniquely mapped to the human genome, corresponding to the microenvironment and tumor respectively. Finally, the ambiguous reads that map to both the human and mouse reference genome were stored in a fastq file for further analysis. The workflow also
provides the option of outputting human and mouse reads as FASTQ files. In order to perform this separation, I wrote a python script called METS
(Microenvironment/Tumor Separation) that is available to download directly from source. After partitioning the human xenograft mouse sequences into tumor and
microenvironment sequences, transcript abundance was calculated using RSEM(Li and
Dewey).
Heat maps and hierarchical clustering of RNA expression data were produced
using the statistical computing language R version 2.15.1(Team). The standard heat map coloring (green to red, from low to high) was not used in this paper. Instead, a cyan to yellow heat map coloring was used in order to accommodate for those with red-green
color blindness.
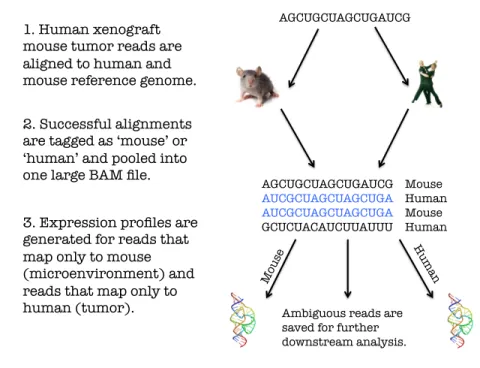
Figure 1. Three step workflow to convert human xenograft mouse sequencing data into microenvironment and tumor expression profiles.
Ambiguous Read Characterization
Reads from the human xenograft mouse samples that successfully align to both a human and mouse reference genomes, called ‘ambiguous reads’, were further analyzed. It
is hypothesized that highly conserved regions of the human and mouse genome would be overrepresented in the ambiguous read group.
The ambiguous reads were again aligned to human and mouse reference genomes using Mapsplice version 2.1.4. The alignments were converted to BED files and
intersected with known human and mouse genome BED files in order to count the
number of reads intersecting with each transcript. Next, I wrote a python script to count the number of reads intersecting each transcript, determine the number of hits per gene
Microenvironment Analysis Workflow
AGCUGCUAGCUGAUCG
1. Human xenograft mouse tumor reads are aligned to human and mouse reference genome.
2. Successful alignments are tagged as ‘mouse’ or ‘human’ and pooled into one large BAM file.
AGCUGCUAGCUGAUCG Mouse
AUCGCUAGCUAGCUGA Human
AUCGCUAGCUAGCUGA Mouse
GCUCUACAUCUUAUUU Human
3. Expression profiles are generated for reads that map only to mouse (microenvironment) and reads that map only to
human (tumor). Ambiguous reads are
from this transcript list, and finally use the Jackson Lab Complete List of Mouse/Human Homologs(Blake et al.) to quantify the percentage of total reads that align to known homologous genes.
RESULTS
Alignment Statistics
Cross-alignment of human xenograft mouse reads to mouse and human reference genomes may result in alignment to the human genome only, to the mouse genome or
may align to both genomes. For our analysis, Figure 2 provides an example of unique alignment to a single genome, mouse or human. The bottom sequence represents the
sequence of the mouse and human references respectively and a letter in red indicates a mismatch with the sample read. As paired-end reads are used in the analysis, Figure 2 is an oversimplification of the requirements of the workflow (that both pairs properly align)
but is nonetheless illustrative of the method used.
Figure 2. If a read aligns to the mouse genome, but not the human genome, the read is classified as microenvironment (left panel). If the converse is true, the read is classified as tumor (right panel).
AGCUGCUAGCUGAUCG (Read)
AGCUGCUACCUGAUCG (Ref) AGCUGCUAGCUGAUCG (Read)AGGUGAUACAUCACGU (Ref)
Read Aligns Uniquely to Mouse
AGCUGCUAGCUGAUCG (Read)
AGCUGCUAGCUGAUCG (Read)
UGCAGCUUUUUGCUCU (Ref) AGCUGCUAGCUGAUCG (Read)AGCUGCUAGCUUAUCG (Ref)
Read Aligns Uniquely to Human
For our analysis, sample reads fall into one of the three categories mentioned above. Human xenograft mice analyzed have tumor cells that are genetically tumor cells, but somatic cells that are genetically mouse. As a result, I hypothesize that reads that
align uniquely to the human genome consist overwhelmingly of tumor sequences. Conversely, I hypothesize that reads that align uniquely to the mouse genome are likely
microenvironment sequences. Analyzing human xenograft samples alongside human and mouse controls allows us to test these hypotheses.
Comparing the alignment statistics of human xenograft mouse reads to human and
mouse control sets in Figure 3, it is clear that substantial amounts of both human and mouse RNA can be found in the human xenograft mouse data while the level of mouse
RNA in the human control and the level of human RNA in the mouse control were effectively zero. Finally, the number of ambiguous reads stayed constant across all three groups. This final point drives the hypothesis that evolutionarily conserved genes that are
Figure 3. Only the xenograft reads (cyan bar) show a substantial number of reads in all three categories. The human control set yielded only human-aligning and ambiguous reads, while the mouse control set yielded only mouse-aligning and ambiguous reads. Xenograft (N=19), Human (N=5), Mouse (N=5)
The mouse-aligning reads from the human xenograft samples serve as our target
for RNA-expression analysis. As uniquely mouse-aligning reads are essentially zero in the human control, we have strong evidence that the subset of human xenograft reads that
align only to the mouse genome are in fact genetically mouse, and therefore part of the tumor microenvironment.
Microenvironment Expression Analysis
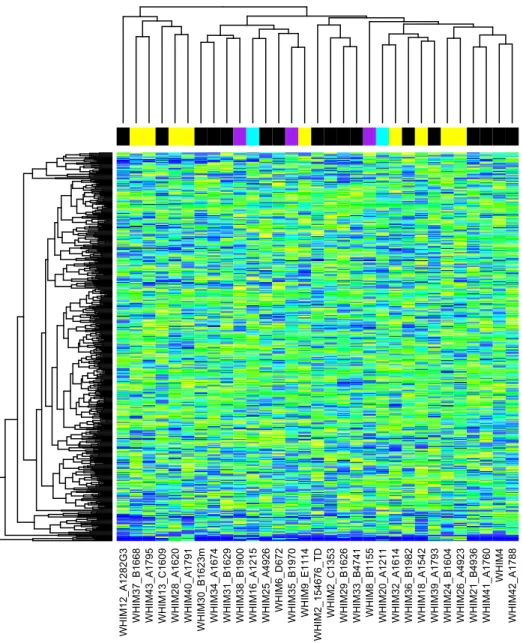
Figure 4 provides an example of RNA expression quantification for the
with the highest standard deviation, we can construct a heat map ranging from blue (lowest expression) to yellow (highest expression). The colored labels correspond to the known molecular subtype of the human tumor that the microenvironment samples
analyzed here were derived from (Black = Basal, Purple = Her2, Cyan = LumA, Yellow = LumB). Importantly, the genes with the highest variation in the microenvironment do
not match those of highest variation for the tumor sample. If the highest varying genes matched between the two sets, we would in fact see clustering of the colored molecular subtype tags. As a result, an RNA expression pattern for the breast cancer
microenvironment, if found, will be in wholly different genes than the patterns
discovered for molecular subtype by Perou et. al. This analysis must be done on a larger
Figure 4. Heatmap of gene expression in 483 mouse genes for 31 samples. Genes used were those with the highest standard deviation across the 31 samples. Expression data was normalized to [0,1] scale and colors range from blue (zero expression) to yellow (highest expression).
As the molecular subtype of the tumor associated with each human xenograft mouse microenvironment presented above is known, we can use an analysis of variance (ANOVA) to test for significance difference in mean microenvironment expression level
for every gene. While the hierarchical clustering provides an analysis of global changes in expression, using ANOVA allows us to identify genes for which expression differs
drastically between known molecular subtypes derived from the pam50 assay(Prat et al. 2012).
This ANOVA test allows us to search for any variation in microenvironment
genes that may correlate with tumor molecular subtype. A histogram of p-values for the ANOVA test is presented in Figure 5. The large peak on the left (below p < 0.05)
implies that there are a large number of genes for which different molecular subtype samples have statistically different expression values. If there were no relationship, we would expect the histogram to be essentially flat, reflecting p-values equally between
zero and one. Investigating the genes with the highest statistical difference (lowest p-value) will be a target of ongoing investigation. If the genes in this group prove to be
Figure 5. The large peak with p<0.05 indicates that there are a substantial number of genes for which microenvironment RNA expression is different between known tumor molecular subtypes.
Human Tumor Expression Analysis
While the microenvironment sequences are unable to be distinguished from tumor sequences in human sequencing data, the METS workflow allows for tumor gene
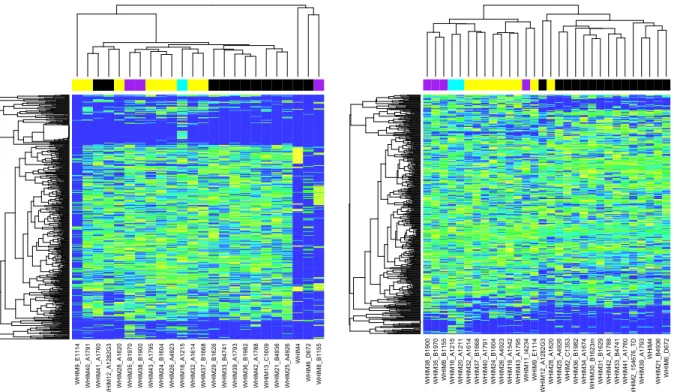
expression analysis with ‘contaminating’ microenvironment sequences removed. The heat maps in Figure 6 were constructed using hierarchical clustering on 63 human xenograft mouse samples. The left panel shows a “naïve” analysis resulting from RNA
expression quantification by RSEM on human xenograft data aligned to the human genome. The right panel presents the same data analyzed by the METS protocol. The
same gene sets (y axis) and samples (x axis) were used to construct both heat maps.
Histogram of ANOVA p-values
ANOVA p-values
F
re
qu
en
cy
0.0 0.2 0.4 0.6 0.8 1.0
0
1000
2000
3000
Figure 6. Heatmap colors range from blue (lowest expression) to yellow (highest expression). Colored bars on the of the heatmap mark known molecular subtype (Black = Basal, Purple = Her2, Cyan = LumA, Yellow = LumB).
The METS-processed data is marked with known PAM50 molecular subtype (see Figure
6 legend). Comparing the clustering between the left panel (unprocessed tumor sample) and the right panel (METS processed tumor sample), we can see that the known PAM50 subtypes are more faithfully recovered in the METS processed sample (mouse-aligning
microenvironment reads and ambiguous reads removed). This variation may be reflective of the removal of reads that are included in the naïve implementation, but
removed as microenvironment in the METS workflow.
Homology of Ambiguous Reads
In order to test the hypothesis that the ambiguous read group would contain a proportionally larger number of highly conserved mouse and human homologs, a second python script was written to analyze the ambiguously aligned reads, quantify the number
of reads per gene, then use the Jackson Lab Complete List of Mouse/Human
Homologs(Blake et al.) to parse this quantification for mouse/human homologs. The
same workflow was applied to the mouse-only and human-only alignments generated by the METS workflow in order to serve as a control.
Figure 7. There is no statistical difference between the percentage of reads that align to homology regions between unambiguous and ambiguous reads for either the mouse or human genome.
The proportion of ambiguous reads aligned to the mouse genome which fall in
proportion of unambiguous human-aligning reads falling in homologous regions. This analysis is presented in Figure 7 above. The analysis above (n=21 samples) indicates that the hypothesis that ambiguous reads contain proportionately greater homologous
gene-mapping reads may not be supported by the data.
DISCUSSION
The work presented here primarily serves as a proof of principle that human xenograft mice can be used as a model system to study the tumor microenvironment and
that an effective in silico workflow that leverages genetic differences to study the mouse microenvironment can be designed. In particular, the METS workflow presented here
provides advantages in throughput and specificity as the separation of tumor and microenvironment is done in silico, removing the necessity of time-consuming
microscope work used in laser-capture microdissection. While it is still an open question
whether analysis of a cohort of human xenograft mouse data will yield clinically relevant information, the opportunity to use this tool to further study the microenvironment will
undoubtedly prove relevant.
One major drawback of this method is that insights into the microenvironment will be drawn from analysis of the mouse microenvironment rather than the human
microenvironment and thus may not be immediately translationally applicable. Despite this drawback, pathways controlling vasculature, canonical inflammatory pathways, and
phenomena could be observed in humans, providing an impetus and direction for further research.
This workflow will be applied to a much larger cohort of human xenograft mice
samples, allowing de novo subtype discovery by hierarchical clustering to be
implemented. Furthermore, links between microenvironment and tumor heterogeneity
can be explored by cross-referencing tumor microenvironment expression with the known molecular subtype of the tumors. Greater understanding of microenvironment heterogeneity will provide yet another dimension of biological data to improve
therapeutic efficacy.
As discussed in the introduction, using multiple sources of descriptive data has
been shown to drastically improve clinical outcomes over the use of molecular subtype alone(Griffith and Griffith). Expanded research into the tumor microenvironment provides yet another dimension to this analysis. Furthermore, while transcriptional
signatures and genetic aberrations tend to be cancer specific, (for instance, the PAM50 assay for breast cancer) insight into the microenvironment may be more expansive and
generally applicable to a broad spectrum of cancers.
BIBLIOGRAPHY
Abe, O. et al. “Tamoxifen for Early Breast Cancer: An Overview of the Randomised Trials.” Lancet 351.9114 (1998): 1451–1467. difusion.academiewb.be. Web. 25
Blake, Judith A et al. “The Mouse Genome Database: Integration of and Access to Knowledge about the Laboratory Mouse.” Nucleic acids research 42.1 (2014): D810–817. NCBI PubMed. Web.
Espina, Virginia et al. “Laser-Capture Microdissection.” Nature Protocols 1.2 (2006): 586–603. www.nature.com. Web. 22 Feb. 2014.
Griffith, Obi L., and Malachi Griffith. “Modeling Precision Treatment of Breast Cancer.” (2013): n. pag. Google Scholar. Web. 28 Feb. 2014.
Li, Bo, and Colin N. Dewey. “RSEM: Accurate Transcript Quantification from RNA-Seq
Data with or without a Reference Genome.” BMC Bioinformatics 12.1 (2011): 323. www.biomedcentral.com. Web. 24 Feb. 2014.
Perou, Charles M. et al. “Molecular Portraits of Human Breast Tumours.” Nature
406.6797 (2000): 747–752. www.nature.com. Web. 22 Feb. 2014.
Prat, A et al. “PAM50 Assay and the Three-Gene Model for Identifying the Major and
Clinically Relevant Molecular Subtypes of Breast Cancer.” Breast cancer research and treatment 135.1 (2012): 301–306. NCBI PubMed. Web.
Team, Rdevelopment Core. “R: A Language and Environment for Statistical Computing.” R foundation for Statistical Computing (2005): n. pag. Google Scholar. Web. 3 Mar. 2014.
Whiteside, T. L. “The Tumor Microenvironment and Its Role in Promoting Tumor Growth.” Oncogene 27.45 (2008): 5904–5912. www.nature.com. Web. 22 Feb.