Introduction
As pharmaceutical care continues to advance in the area of oncology, scientists have turned to nanoparticle delivery systems to improve upon existing anticancer agents. Exact definitions vary, but one commonly used definition from the National Nanotechnology Initiative defines nanotechnology as “science, engineering, and technology” on the order of 1 to 100 nanometers in any dimension1. The last two decades have witnessed enormous growth in the development of nanoparticle anticancer agents. In 1995, the FDA approved pegylated liposomal doxorubicin (PLD, Doxil ®) for the treatment of platinum-refractory ovarian cancer. Since that time, there has been extensive research into the use of liposomal agents for the treatment of various malignancies. The hope has been, and continues to be, that these agents can be used to target cytotoxic chemotherapy to malignant cells while minimizing exposure to healthy cells. Unfortunately, only two other nanoparticle agent, Abraxane® and
Marqibo®, have come to market in the 20 years since the FDA approved Doxil ®. Other agents that have been studied as liposomal formulations but are not currently FDA approved include belotecan, irinotecan, lurtotecan, cisplatin, oxaliplatin, paclitaxel, and vinorelbine2.
Nanoparticles, and liposomes in particular, are a favored method of drug delivery because they provide the ability to control the timing and location of a drug’s release3. An additional benefit of liposomal agents is reduced clearance compared to small molecule agents, providing more sustained drug concentrations and less frequent dosing4. It has been observed for some liposomal agents that concentrations in tumor tissue are 10 to 50 times that observed in circulation5. This finding is attributed to the enhanced permeation and retention (EPR) effect. Tumors secrete growth factors like VEGF that promote angiogenesis and help sustain the rapid growth of malignant cells. These new blood vessels are irregular and dilated with wide fenestrations, the epithelial cells are poorly aligned, and many vessels lack an underlying basement membrane or smooth muscle layer6. The extravasation of liposomes out of circulation is assisted by an imbalance between vasodilators (e.g. nitric oxide, bradykinin, prostaglandins) and vasoconstrictors (angiotensin II) in tumor tissue. In addition, tumor tissue has slow venous return and poor lymphatic drainage, leading to prolonged retention of liposomes and accumulation of the drug in tumor7.
biodistribution and clearance of the liposome, and the antineoplastic agent
encapsulated within the liposome can have a cytotoxic effect on the MPS9-12. Because liposomes are cleared from circulation by the MPS, they primarily accumulate in tissues with dense populations of these cells, notably the liver and spleen13.
While liposomes and other nanoparticle agents have the advantages discussed above, they have not been more widely developed as commercial agents due to issues of pharmacokinetic (PK) and pharmacodynamics (PD) variability. Multiple studies have compared liposomal agents to their small molecule equivalent and confirmed that liposomes have significantly greater PK and PD variability14-17. The exact causes are still unclear, but there does appear to be a correlation between PK/PD variability and patient specific factors such as age, body composition, and clearance rate of the drug2,17.
This PK/PD variability may help explain why some cancers respond to liposomal agents while other do not. PLD provides an excellent case study here. The FDA approved Doxil ® on the basis of a Phase 3 study showing a survival benefit compared to standard of care in platinum refractory ovarian cancer18. However, these benefits have not extended to other gynecologic cancers. A Phase 2 study designed to evaluate the antitumor activity in patients with persistent or recurrent endometrial carcinoma found limited activity and subsequent studies have not provided sufficient rationale to pursue this research further19.
The expansion of liposomal anticancer agents to improve on current standard of care would be greatly simplified by a relatively rapid, affordable, and accurate marker to explain PK/PD variability and predict efficacy in specific patient populations. One
potential candidate is the F4/80 marker for tumor associated macrophages (TAMs). TAMs are specific MPS cells that migrate to and exert their function within the tumor tissue. They are mediators of inflammation and are associated with poor prognosis20. TAMs regulate tumor growth, angiogenesis, invasion and metastasis through the release of cytokines, chemokines, enzymes, and growth factors21. Zamboni et al illustrated that the number of MPS cells associated with different tumor cell types correlated with distribution of a liposomal anticancer agent to tumor tissue, release of the agent within the tumor tissue, and tumor response to the agent22.
The F4/80 marker is highly specific for MPS cells and survives tissue fixation and embedding, allowing the opportunity to visualize and quantify MPS cells in tissue samples8. The exact processing and staining methodology has been previously
Figure 1: Comparison of a melanoma (A375) and ovarian (SKOV-3) cancer cell line in terms of number of MPS cells, distribution of a liposomal cancer agent in an
encapsulated (S-CKD602) and released (CKD-602) form, and tumor response. (Adapted from: Zamboni, 2011)
Figure 2: F4/80 staining in tumor tissue, illustrating how the various grades of staining appear before and after computer algorithm analysis.
0.00 0.02 0.04 0.06 0.08 0.10 0.12
A375 Melanoma
SKOV-3 Ovarian
Distribution of S-CKD602 To Tumors
Release of CKD-602 in Tumors Monocytes
& Dendritic Cells in Tumors
Tumor Sensitivity
Grade 0 Grade 1+
Grade 2+ Grade 3+
Post Algorithm
The following formula is then used to obtain an overall H Score, ranging from 0 to 400, for a tissue region or an entire tissue.
𝐻 − 𝑠𝑐𝑜𝑟𝑒 =(#𝑜𝑓𝑐𝑒𝑙𝑙𝑠𝑔𝑟𝑎𝑑𝑒 3) × 4 + (#𝑜𝑓𝑐𝑒𝑙𝑙𝑠𝑔𝑟𝑎𝑑𝑒 2) × 3 + (#𝑜𝑓𝑐𝑒𝑙𝑙𝑠𝑔𝑟𝑎𝑑𝑒 1) × 2
𝑡𝑜𝑡𝑎𝑙𝑛𝑢𝑚𝑏𝑒𝑟𝑜𝑓𝑐𝑒𝑙𝑙𝑠 × 100
The goal of this honors project was to compare the pharmacokinetics and efficacy of PLD to small molecule doxorubicin in two xenograft mouse models, one endometrial (i.e. HEC1A) and one ovarian (i.e. SKOV-3), with differing TAM densities as measured by H Score analysis. PLD concentrations were measured separately for drug still within the liposomal carrier (i.e. encapsulated) and drug released from the liposomal carrier (i.e. released). It is important to note that encapsulated drug is pharmacologically inactive and possesses the PK properties of the carrier molecule, while released drug is active and possesses the PK properties of the small molecule agent14.
Methods
HEC1A and SKOV3 cells were obtained from the American Type Culture Collection (Rockville, MD) and expanded in culture by the Tissue Culture Facility at the University of North Carolina.
Female CB17 SCID mice aged 8 to 12 weeks were purchased from Taconic Labs (Albany, NY) and were allowed to acclimate for 1 week at the UNC Lineberger Cancer Center prior to initiation of the study. The mice in the endometrial arm were injected with 1,000,000 HEC1A xenograft cells in 25 uL volume into the uterine horn. The mice in the ovarian arm were injected with 200,000 SKOV3 xenograft cells in 5 uL volume into the ovarian bursa.
Animal weights were obtained daily for 2 weeks, then biweekly for the remainder of the study. Tumor dimensions were measured by palpation biweekly for the duration of the study. Animals were sacrificed if tumors measured 2.0 cm in any direction or the animal lost 20% from maximum body weight achieved.
PLD was purchased from FormuMax Scientific (Palo Alto, CA) and nonliposomal
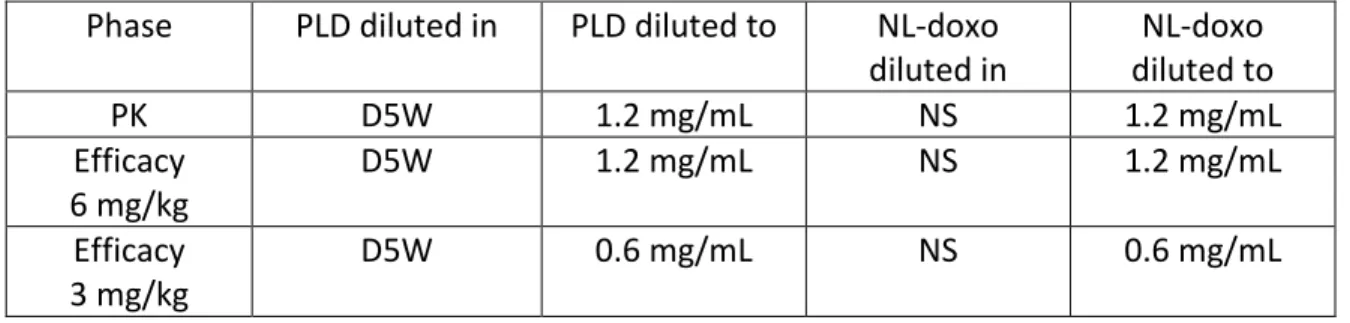
Table 1: Dosing of PLD and NL-doxorubicin by study phase
Phase PLD diluted in PLD diluted to NL-doxo diluted in
NL-doxo diluted to
PK D5W 1.2 mg/mL NS 1.2 mg/mL
Efficacy 6 mg/kg
D5W 1.2 mg/mL NS 1.2 mg/mL
Efficacy 3 mg/kg
D5W 0.6 mg/mL NS 0.6 mg/mL
In the PK and initial efficacy studies, mice were treated with PLD and NL-doxorubicin at 6 mg/kg. Mice in the initial efficacy study did not tolerate multiple doses, so a follow up efficacy study was conducted comparing PLD and NL-doxorubicin at 3 mg/kg. In addition to the PLD and NL-doxorubicin arms for both mice bearing HEC1A and SKOV3
xenografts, the efficacy studies included a “control” arm consisting of tumor bearing mice who received no treatment.
PK samples were obtained prior to drug injection and at 5 min, 30 min, 1 hr, 3 hr, 6 hr, 24 hr, 48 hr, 72 hr, and 96 hr post injection. Blood samples were placed on ice and processed the same day using a solid phase separation method described previously to isolate encapsulated and released drug fractions25. Tissues were snap frozen after collection and stored at -80°C until further processing. They were then homogenized with pH 7.4 PBS buffer at a 1:3 ratio of tissue:PBS and drug in tissue was isolated and measured using protein precipitation. Released doxorubicin in plasma, encapsulated PLD in plasma, and sum total doxorubicin in tissues were all measured using a high performance liquid chromatography assay25. Areas under the curve (AUCs) for overall drug exposure were calculated using Phoenix Version 6.2 (Pharsight Corp) with a linear up, log down rule.
Results
PLD concentrations as measured in plasma, liver, and spleen were not significantly different between the mice bearing HEC1A and SKOV3 xenografts. AUC analysis showed that SKOV3 PLD exposures were 70%, 86%, 102%, and 143% of the HEC1A exposures for released drug in plasma, encapsulated drug in plasma, sum total drug in liver, and sum total drug in spleen, respectively. This compared to an SKOV3 PLD AUC in tumor tissue that was 263% of HEC1A AUC. PK data for plasma and tumor are plotted with respect to time in Figure 3 and Figure 4. At 3 hours, concentrations in SKOV3 tumor tissue
Figure 3: Concentration vs. Time in plasma from 0 to 96 hours after administration of PLD at 6 mg/kg x 1 dose in female SCID mice bearing SKOV3 and HEC1A xenografts. Enc: Encapsulated PLD fraction. Rel: Released PLD fraction
Figure 4: Concentration vs. Time in tumor from 0 to 96 hours after administration of PLD at 6 mg/kg x 1 dose in female SCID mice bearing SKOV3 and HEC1A xenografts. Tot: Sum total doxorubicin
1 10 100 1,000 10,000 100,000 1,000,000
0 12 24 36 48 60 72 84 96
C o n c e n tr a ti o n ( n g /m l) Time (hr) HEC1A Enc SKOV3 Enc HEC1A Rel SKOV3 Rel 1 10 100 1,000 10,000 100,000
0 12 24 36 48 60 72 84 96
Similar trends were observed in the mice treated with NL-doxorubicin; however, the ratio of drug measured in tumor relative to plasma was not as great. SKOV3
NL-doxorubicin exposures were 47% of HEC1A exposures for plasma and 116% for tumor. NL-doxorubicin accumulation in tumor, then, was 2.4 fold greater in SKOV3 than in HEC1A, while PLD accumulation in tumor was 3.8 fold greater in SKOV3 than in HEC1A.
In the initial efficacy study at 6 mg/kg, median survival for HEC1A PLD vs. NL-doxorubicin vs. control was 13 days, 9 days and 27 days. Median survival for SKOV3 PLD vs. NL-doxorubicin vs. control was 11 days, 9 days and 37 days. While PLD mice did survive, on average, longer than NL-doxorubicin mice, the control mice outperformed both
treatments regardless of whether the mice were in the ovarian or endometrial group. In both the PLD and NL-doxorubicin groups, around ½ of the mice were harvested between the 1st and 2nd dose of treatment. By the time mice were scheduled to received their 3rd dose of treatment, less than 10% of mice remained in any of the treatment groups. On the basis of this limited data, it was not possible to properly compare survival between groups. The results of the initial efficacy study are presented in Figure 5.
Figure 5: Survival data in mice carrying either SKOV3 ovarian or HEC1A endometrial xenografts who received pegylated liposomal doxorubicin (PLD) at 6 mg/kg,
Figure 6: Survival data in mice carrying either SKOV3 ovarian or HEC1A endometrial xenografts who received pegylated liposomal doxorubicin (PLD) at 3 mg/kg,
nonliposomal doxorubicin (doxo) at 3 mg/kg, or no treatment.
Accordingly, a follow up efficacy study was conducted at 3 mg/kg. These results are presented in Figure 6. In this study, median survival for HEC1A PLD vs. NL-doxorubicin vs. control was 14 days, 13 days and 13 days. Median survival for SKOV3 PLD vs. NL-doxorubicin vs. control was 27 days, 23 days and 20 days. With the limited number of mice in each group, the potential trend toward improved survival in the SKOV3 mice treated with PLD did not reach statistical significance (p = 0.85).
Discussion
Our findings in this study present more than one paradox. The pharmacokinetic data suggests a link between MPS function, as measured by the H score, and drug
distribution to xenograft tumor tissue. Mice carrying representative ovarian (SKOV3) and endometrial (HEC1A) xenografts were given a single dose of PLD or NL-doxorubicin at 6 mg/kg. Mice tolerated this treatment well up to 96 hours, and data up to this point suggests minimal differences in plasma drug concentrations when comparing the two xenografts either based on released or encapsulated drug. However, the mice with ovarian xenografts, which had more MPS cells as measured by H Score analysis,
migrating to the tumor in SKOV3 mice was helping to deliver the liposomal agent. This same benefit was not seen with NL-doxorubicin.
However, this pharmacokinetic link did not translate to an efficacy advantage at either the initial 6 mg/kg or the subsequent repeat study at 3 mg/kg. Tumor bearing control mice who received no treatment outperformed both treatment groups for both types of xenografts at 6 mg/kg weekly. Moreover, it was noted that the vast majority of mice did not tolerate more than 2 doses of drug, whether liposomal or small molecule,
suggesting that acute anthracycline toxicity is playing more of a role here than the cancer progression. The mouse facility noted prior issues with anthracycline toxicity in SCID mice on projects for other researchers; however, this had not previously been observed on Zamboni lab projects as we use other mouse models for these types of studies.
The lower dose of 3 mg/kg also produced disappointing efficacy results. At this dose, SKOV3 mice had improved survival relative to HEC1A mice no matter the treatment arm. Median survival was consistent with the anticipated trend: PLD > NL-doxorubicin > control. However, this trend was not statistically significant. One interesting trend to note when comparing the 6 mg/kg data to the 3 mg/kg data is the fact that survival times for the HEC1A mice remained the same while survival times for the SKOV3 mice improved notably with the dose reduction. One possible explanation is that the survival benefit of PLD is still being obscured to some degree by acute anthracycline toxicity. Less than 1/3 of SKOV3 mice tolerated all 6 doses of PLD, and no HEC1A mice made it this far. The data for NL-doxorubicin is similar.
This study emphasizes several limitations associated with the use of orthotopic
xenograft mouse models. While orthotopic models are considered more physiologically accurate than flank models, these models are generally not considered as
One potential step moving forward is to perform one additional efficacy analysis in mice treated at 1 mg/kg. This dose should be sufficiently low enough that toxicity should not confound the results, allowing any potential survival benefit from PLD to become more clear over the 6 week treatment period.
In summary, this study illustrates a link between the MPS and the distribution of PLD in orthotopic xenograft mouse models. The pharmacokinetic advantage of PLD is
associated with tumor cell lines that have higher MPS population and is most likely a function of MPS uptake and delivery of liposomal anticancer agents preferentially to the tumor tissue. Unfortunately, whether this pharmacokinetic advantage translates into a benefit in terms of efficacy is still unknown. Researchers employing SCID mice for efficacy studies should be especially cautious in dosing these animals with
anthracyclines, as they are particularly prone to toxicity.
References
1. What is Nanotechnology? National Nanotechnology Initiative. Available at http://www.nano.gov/nanotech-101/what/definition. Accessed Feb 28 2015.
2. Schell RF, et al. Meta-analysis of inter-patient pharmacokinetic variability of liposomal and non-liposomal anticancer agents. Nanomedicine. 2014 Jan;10(1):109-17.
3. Singh R, Lillard JW. Nanoparticle-based targeted drug delivery. Exp Mol Pathol. 2009 Jun;86(3):215-23.
4. Caron WP, et al. A review of study designs and outcomes of Phase I clinical studies of nanoparticle agents compared with small-molecule anticancer agents. Clin Cancer Res. 2013 Jun 15;19(12):3309-15.
5. Iyer AK, et al. Exploiting the enhanced permeability and retention effect for tumor targeting. Drug Discov Today. 2006 Sep;11(17-18):812-8.
6. Maeda H, et al. Tumor vascular permeability and the EPR effect in macromolecular therapeutics. J Control Release. 2000 Mar 1;65(1-2):271-84.
7. Greish K. Enhanced permeability and retention of macromolecular drugs in solid tumors: a royal gate for targeted anticancer nanomedicines. J Drug Target. 2007 Aug-Sep;15(7-8):457-64.
8. Hume DA, et al. The mononuclear phagocyte system revisited. J Leukoc Biol. 2002 Oct;72(4):621-7.
10. Song G, et al. Nanoparticles and the mononuclear phagocyte system:
pharmacokinetics and applications for inflammatory diseases. Curr Rheumatol Rev. 2014;10(1):22-34.
11. Zamboni WC, et al. Bidirectional pharmacodynamics interaction between pegylated liposomal CKD-602 (S-CKD602) and monocytes in patients with refractory solid tumors. J Liposome Res. 2011 Jun;21(2):158-65.
12. Smith MJ, et al. From immunotoxicity to nanotherapy: the effects of nanomaterials on the immune system. Toxicol Sci. 2014 Apr;138(2):249-55.
13. Zamboni WC. Concept and clinical evaluation of carrier-mediated anticancer agents. Oncologist. 2008 Mar;13(3):248-60.
14. Caron WP, et al. Interpatient pharmacokinetic and pharmacodynamic variability of carrier-mediated anticancer agents. Clin Pharmacol Ther. 2012 May;91(5):802-12. 15. Caron WP, et al. Translational studies of phenotypic probes for the mononuclear phagocyte system and liposomal pharmacology. J Pharmacol Exp Ther. 2013
Dec;347(3):599-606.
16. Song G, et al. Factors affecting the pharmacokinetics and pharmacodynamics of liposomal drugs. J Liposome Res. 2012 Sep;22(3):177-92.
17. Zamboni WC, et al. Pharmacokinetic study of pegylated liposomal CKD-602 (S-CKD602) in patients with advanced malignancies. Clin Pharmacol Ther. 2009 Nov;86(5):519-26.
18. Gordon AN, et al. Long-term survival advantage for women treated with pegylated liposomal doxorubicin compared with topetecan in a phase 3 randomized study of recurrent and refractory epithelial ovarian cancer. Gynecol Oncol. 2004 Oct;95(1):1-8. 19. Muggia FM, et al. Phase II trial of the pegylated liposomal doxorubicin in previously treated metastatic endometrial carcinoma: a gynecologic oncology group study. J Clin Oncol. 2002 May 1;20(9):2360-4.
20. Joyce JA. Therapeutic targeting of the tumor microenvironment. Cancer Cell. 2005 Jun;7(6):513-20.
21. Lewis CE, Pollard JW. Distinct role of macrophages in different tumor microenvironments. Cancer Res. 2006 Jan 15;66(2):605-12.
22. Zamboni WC, et al. Tumor disposition of pegylated liposomal CKD-602 and the reticuloendothelial system in preclinical tumor models. J Liposome Res. 2011 Mar;21(1):70-80.
23. Goldstein M, Watkins S. Immunohistochemistry. Curr Protoc Mol Biol. 2008 Jan;Chapter 14:Unit 14.6.
24. Budwit-Novotny DA, et al. Immunohistochemical analyses of estrogen receptor in endometrial adenocarcinoma using a monoclonal antibody.Cancer Res. 1986
25. Zamboni W, et al. The development of liposomal and nanoparticle anticancer agents: methods to evaluate the encapsulated and released drug in plasma and tumor and phenotypic probes for pharmacokinetic (PK) and pharmacodynamic (PD)
disposition. Proceedings of the 2007 NSTI nanotechnology conference; Florida: CRC Press; 2007.
26. Olive KP, Tuveson DA. The use of targeted mouse models for preclinical testing of novel cancer therapeutics. Clin Cancer Res. 2006 Sep 15;12(18):5277-87.
27. Politi K, Pao W. How genetically engineered mouse tumor models provide insights into human cancers. J Clin Oncol. 2011 Jun 1;29(16):2273-81.
28. Combest AJ, et al. Genetically engineered cancer models, but not xenografts, faithfully predict anticancer drug exposure in melanoma tumors. Oncologist. 2012;17(10):1303-16.