Tali M Beesley. Exploring Usage of Digital Collections via Web Analytics Tools. A Master’s Paper for the M.S. in L.S degree. April, 2012. 79 pages. Advisor: Christopher Lee
This paper presents the findings of a detailed data collection and analysis process on a subset of a digital library and archive’s web analytics data. The study focused on three research areas: user demographics across twelve collections; usage of value-added content across collections; and use as a function of size of collections. The paper presents findings, includes suggestions for
improving the collections, and includes guidelines for how the digital library and archive’s staff can monitor web analytics data in the future.
Headings:
Archives
Digital Collections
Digital Libraries
Primary Sources
Special Collections
EXPLORING USAGE OF DIGITAL COLLECTIONS VIA WEB ANALYTICS TOOLS
by Tali M Beesley
A Master’s paper submitted to the faculty of the School of Information and Library Science of the University of North Carolina at Chapel Hill
in partial fulfillment of the requirements for the degree of Master of Science in
Library Science.
Chapel Hill, North Carolina April 2012
Approved by
1
Contents
Introduction ... 3
Literature Review... 4
Research Overview ... 10
User Profiles... 14
Research Hypothesis and Operational Definitions... 14
Methodology ... 16
Geographic Location ... 16
Language ... 17
New Visitor vs. Returning Visitor ... 17
Browser ... 17
Mobile Operating System ... 18
Source ... 18
Average Time on Site ... 18
Results ... 19
Geographic Location. ... 19
Language ... 30
New Visitor vs. Returning Visitor ... 30
Browser ... 33
Mobile Operating System ... 34
Source ... 35
Average Time on Site ... 38
Conclusions ... 43
Value-Added Content ... 46
Hypothesis ... 46
Operational Definitions ... 46
Methodology ... 47
For Homepages ... 47
For Primary Source Pages ... 48
For Keywords ... 51
Results ... 51
For Homepages ... 51
For Primary Source Pages ... 53
For Top 100 Landing Pages ... 54
For Keywords ... 56
Conclusions ... 56
Usage by Size of Collections ... 58
Hypothesis ... 59
Operational Definitions ... 59
Methodology ... 60
Results ... 60
Conclusions ... 64
Limitations ... 66
Intention ... 66
Filters ... 67
Other Limitations ... 67
Discussion ... 68
Assessment Means Data, and Data is Good ... 68
Why and How to Act on the Data ... 69
References ... 72
Appendix 1: Google Analytics Basics ... 75
3
Introduction
The Carolina Digital Library and Archives (CDLA) at the University of North
Carolina at Chapel Hill, and specifically the Digital Publishing Group (DPG) within the
CDLA, works with students, scholars, and faculty to create digital collections housed on
the UNC Library Systems’ servers. The CDLA’s mission statement1
, which is currently
under revision, emphasizes the CDLA’s desired audience by explaining that its projects
and services seek to “support the work of scholars, students, librarians and the general
public in the state of North Carolina and beyond.” The mission statement also
emphasizes using “technological means to enhance research, teaching, and the public
interest,” and adhering “to a philosophy of collaboration that ensures these groups are
both our audience and our partners.”
Since 1996, much of the DPC’s efforts in production and maintenance of digital
collections have focused on the award winning Documenting the American South
Collection (DocSouth). DocSouth “draws on the Library's historic collecting strengths to supply teachers, students, and scholars everywhere at every level with a wide array of
carefully selected and arranged materials that support scholarly, educational, and
individual research” (“Carolina Digital Library and Archives / Digital Publishing /
Home,” n.d.).
Thus, the main goals for DocSouth can be reduced to the following: Support a wide array of users (from students to scholars to librarians to the general public) with content
By exploring the web analytics data attached to DocSouth sites that have been aggregating for more than a year, I hope to gain insights into some of the most pressing
questions about usage of the CDLA’s digital collections:
1. Who is accessing the collections? Currently, the CDLA has only anecdotal
evidence of who the users of their collections are.
2. Do visitors to the collections view the content that augments the primary sources
(e.g. summaries and biographies)? The CDLA spends a significant amount of
time and resources in the creation of these contextual materials and does not
currently have any data regarding their use.
3. How does use of the CDLA’s smaller collections compare to use of its larger
collections? The CDLA has collections that vary widely in size but does not
know how or if the size of a collection relates to the use of a collection.
Literature Review
A digital collection, as Allison B. Zhang and Don Gourley put it in their book
Creating Digital Collections: A practical guide, “is simply a set of related items that are
in electronic form” (2008). For the purposes of this paper, I have defined digital
collections more specifically as compilations of digital representations of special
collections’ primary source materials with accompanying contextual information that
may be born-digital content.
There are likely many reasons why memory institutions create digital collections,
though two reasons may be the most prominent: as Abby Smith states, “Libraries usually
5
reach of those collections” (2001). Digitization can be part of a larger preservation
program: “The decision to take on the analog-to-digital conversion of our oral history
collection stemmed from a growing concern with magnetic tape as a preservation
medium and the introduction of born digital oral history interviews” (Weig, Terry, &
Lybarger, 2007). Yet digitizing for preservation often has less to do with making a
digital replacement for a physical object and more to do with making use copies so that
users will not handle the physical object and chance damaging it (Zhang & Gourley,
2008). As important as preservation is, Zhang and Gourley stress access as the most
important goal: “We believe extending and improving access to special collections
material is the primary reason to embark on digitization projects” (Zhang & Gourley,
2008).
Whether preservation or access is the primary reason a digital collection is
created, the collections, once made available to the public, are meant to be used. Yet, as
Chris Prom and other prominent archivists have noted, there is a lack of literature on
usage of digital collections (Prom, 2011) (Harley & Henke, 2007). To begin to rectify
this dearth, Molly Bragg performed a survey on “if and how memory institutions track
and analyze the use of their digitized primary source materials” (Bragg, 2011). Bragg
found that the majority of institutions she surveyed did track usage information of their
digitized materials: of the 49 institutions surveyed, 40 (82%) were tracking usage
information. Those institutions that did not track usage data cited their poor technical
infrastructure or lack of administrative support as reasons for not tracking the data rather
Though institutions may be tracking usage data, many are failing to analyze the
data in cohesive and actionable ways. Bragg confirms, “Although institutions surveyed
see the value of tracking such data…many are struggling with how to fully leverage
usage data. Participants were able to collect use information but in many cases obstacles
such as limited time, limited resources and a lack of policy kept them from funneling raw
statistics into effective decision-making” (2011).
Institutions in Bragg’s study revealed that they would ideally like to use their data
to “make digitization decisions” and to inform “website redesign” (2011). Articles that
do exist on assessing digital collections have echoed those goals, as well as focused on
investigating current usage and impact of services. For example, Chris Prom wrote of a
case study he conducted at his institution on online access to archival resources that
aimed "to measure user actions, to understand some aspects of user behavior, and to
initiate a program that will improve online services" (Prom, 2011). Similarly, Elizabeth
Black conducted a case study on her academic library’s web analytics data to determine
“when visitors come, the duration of the visit, how they get there, the technology they
use, and the most popular content”(Black, 2009). In both cases, Prom and Black worked
to investigate current use and used that information to strategically plan for how to
improve the services they offered.
Another reason to assess is to demonstrate how digital collections are helping to
meet or underline goals put forth in the mission statement for either the library/archive or
the broader institution. One of the few articles on evaluating users of digital collections
was conducted by Irene M. H. Herold, who wanted to determine who was using the
7
her to determine whether providing access to the archive’s materials was helping to
underline the college’s mission to globally enhance its students’ knowledge. Herold felt
she had a mandate to provide materials for international users: “the need to evaluate the
users of these collections in a meaningful and manageable method arises as part of the
library’s contribution to the institutional mission…Particularly with international origins
of collection contents, capturing who the users are helps justify digitizing and
maintaining collections as an important support of the college’s mission" (2010).
Since part of the CDLA’s mission includes supporting the needs of users “in the
state of North Carolina and beyond,” determining whether their content is reaching users
beyond North Carolina will be similarly important. “Depending upon the library or its
archive’s mission, users may not be members of the college community, but could
include public patrons and scholars located worldwide. [Archivists] need to evaluate
whether they are connecting their digital archival image collections with this
constituency if doing so is part of their mission and purpose in providing Internet
access to their collections" (Herold, 2010).
Beyond understanding where users are coming from geographically, some studies
have started to research where users are coming from virtually by tracking the referring
site, or the site from which users came directly before reaching the digital collection.
Ann Lally and Carolyn Dunford of the University of Washington Libraries have started
adding links to their collections in relevant Wikipedia articles. They have then used web
analytics tools to track the specific articles in Wikipedia that led to users visiting their
Libraries’ collections. “Therefore, not only can we see that we are receiving referrals
for the traffic, and how much traffic is generated by the links in each article” (Lally &
Dunford, 2007).
Tabatha Farney, like Prom and Black, wanted to use web analytics data to
improve services—she wanted to determine how to improve her Library’s homepage
(2011). She chose to use click analytics because "Click analytics is a powerful technique
that displays what and where users are clicking on a webpage helping libraries to easily
identify areas of high and low usage on a page without having to decipher website use
data sets” (2011). Farney says using click analytics made it easy for her to see which
links were redundant for her website’s homepage. She also emphasized how easy it is to
collect this data: “A major bonus of using click analytics tools is their ability to create
easy to understand reports that instantly display where visitors are clicking on a webpage.
No previous knowledge of web analytics is required to understand these reports"(2011).
Others institutions have referred to using web analytics to help determine whether
there is a need for mobile browsing capabilities on their libraries’ websites (Mitchell &
Suchy, 2012). In addition, some institutions are looking at ways to leverage social media
tools to either augment access to digital collections (Schlosser, 2011) or to engage users
with libraries and digital collections in thoughtful rather than slapdash ways (Schier,
2011) (Gerolimos & Konsta, 2011). Thus, the literature surrounding digital libraries’
websites agrees on the importance of understanding who the users of an institution’s
website are and what they are doing while on the institution’s websites. "Although the
evaluation of DL [Digital Libraries] collections can be approached from a number of
perspectives, an assessment of the nature of DL user communities should be an essential
9
There is also the sense that good digital projects provide something more for users
than a merely digitized reproduction of a physical object (Davision, 2009). "Digitization
is a start, but providing innovative digital services on top of the digital collections is
essential to meet the needs of an expanding audience for special collections materials. As
digitized material is made more freely available, new populations of users will be drawn
to them, bringing with them a much broader range of needs" (Davision, 2009).
Understanding the current usage patterns of the CDLA’s digital collections hopefully will
help the CDLA anticipate the broad range of needs of their users.
Khoo et al. have some advice for how to frame a digital library’s web analytics
strategy. They say there are “two basic strategies,” which include first identifying “key
metrics that can be reported on a daily basis,” and then mining “web metrics data in a
focused way, guided by one or more targeted research or evaluation questions” (2008).
Irene Herold presents a stepped web analytics strategy, which includes gathering data,
inferring ideas from the data (e.g. “are the site visitors consistent with the intended
audience for the materials), segmenting (e.g. combine users’ characteristics and
behaviors), and tracking (e.g. “follow any changes in user behavior after implementation
of new materials”) (2010).
No matter the technique chosen, assessors of digital collections need to share the
ways in which they are using these tools so that others may learn and copy their
techniques. Web analytics tools, though they have many limitations (which will be
discussed in detail later), can be very effective. Harley and Henke describe some of the
many libraries used—all of the benefits of TLA still apply to web analytics: "First,
[TLA] captures the actual behavior of real users in their own real-use environments; it
does not rely on biased self-reports or artificial, laboratory-based use scenarios. Second,
because TLA records behave passively without requiring users' active participation, it can
capture a much broader spectrum of uses and users than can surveys, focus groups, or
other methods” (Harley & Henke, 2007). Yet it takes at least “a moderate amount of time
and effort to interpret the reported results” (Prom, 2011). Sharing methods and findings
about use with the broader community is important so that librarians and archivists do not
have to reinvent the wheel every time an institution decides to start using web analytics
tools to assess their digital collections. This paper aims to present some methods for both
delving deeply into web analytics data and for keeping up with web analytics data in a
less effortful manner.
Research Overview
For this study, I chose to take Khoo et al.’s tactic to mine web analytics data using
targeted research questions as guideposts (2008). As a reminder, my questions are as
follows:
1. Who is accessing the CDLA’s collections? I want to know more about the
visitors to the CDLA’s collections: where do they live, how long do they stay on the site,
what language do they speak, how many of them are using mobile devices to access the
content, what browser do they use, what sites led them to the collections, and have they
11
Knowing more about the CDLA’s users and their habits could be used to justify
not only current collections but also to inform decisions about what kind of content
should be digitized in the future and the ways in which the material can be improved for
better accessibility. Knowing whether users are local to North Carolina, from the U.S.
more broadly, or even largely international will show the CDLA whether it is meetings
its goal to support scholars from North Carolina and abroad.
2. Do visitors to the collections view the content that augments the primary
sources (e.g. summaries and biographies)? The CDLA creates and works with many
partners to create what I term value-added content, or material that augments primary
sources in some way. Knowing whether the material is viewed will help the CDLA
determine if the resources they put into the creation of the content is worth it.
3. How does use of the CDLA’s smaller collections compare to use of its
larger collections? The CDLA has many different-sized collections. Some of the
collections have similar interfaces, some of the collections have very specialized
interfaces, some of the collections are large and some of the collections are small.
Having a better understanding of use as a function of size of the collection will help the
CDLA to make informed decisions about whether smaller “boutique” collections are
worth the resources put into creating them.
For this study, I decided to focus on use of a subset of the CDLA’s digital
collections; I opted to explore the web analytics data for twelve of the DocSouth
collections. I chose these sites for the following reasons: 1) All of the sites have working
value-added content (this will be further defined later); and 4) they have analytics data for the
entire 2011 calendar year. It should be noted that the digital collections vary along many
factors including size of the collection, date they were created, and date at which Google
Analytics data began to be collected. As mentioned, for all metrics for which a date span
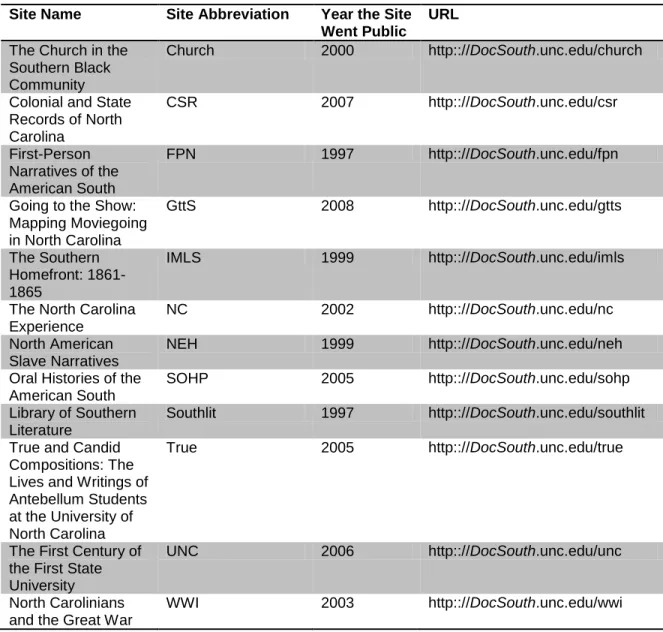
is needed, I used the data for the entire 2011 calendar year. See Table 1 for a list of the
DocSouth collections used.
Table 1. DocSouth Collections Studied.
Site Name Site Abbreviation Year the Site Went Public
URL
The Church in the Southern Black Community
Church 2000 http:://DocSouth.unc.edu/church
Colonial and State Records of North Carolina
CSR 2007 http:://DocSouth.unc.edu/csr
First-Person Narratives of the American South
FPN 1997 http:://DocSouth.unc.edu/fpn
Going to the Show: Mapping Moviegoing in North Carolina
GttS 2008 http:://DocSouth.unc.edu/gtts
The Southern Homefront: 1861-1865
IMLS 1999 http:://DocSouth.unc.edu/imls
The North Carolina Experience
NC 2002 http:://DocSouth.unc.edu/nc
North American Slave Narratives
NEH 1999 http:://DocSouth.unc.edu/neh
Oral Histories of the American South
SOHP 2005 http:://DocSouth.unc.edu/sohp
Library of Southern Literature
Southlit 1997 http:://DocSouth.unc.edu/southlit
True and Candid Compositions: The Lives and Writings of Antebellum Students at the University of North Carolina
True 2005 http:://DocSouth.unc.edu/true
The First Century of the First State University
UNC 2006 http:://DocSouth.unc.edu/unc
North Carolinians and the Great War
13
I used Google Analytics to collect the necessary data to answer my research
questions. A brief introduction to Google Analytics can be found in Appendix 1. The
Google Analytics code had been placed on all of the above twelve sites since before
January 1, 2011. As discussed throughout this paper and more extensively in the
limitations section, I was not able to retroactively filter out the CDLA staff’s IP
addresses, and so the data includes visits from CDLA staff to the above sites. As none of
the sites was still under development at the time of the data collection, it is my hope that
visits from the CDLA staff would be limited. I used a combination of exporting large
reports of relevant data from Google Analytics and manually sifting through the standard
reports and dashboards to find relevant data. Each section below will outline the specific
dimensions and metrics of data I collected, as well as the specific ways in which I
analyzed the data. I looked for noteworthy trends in the data related to my research
questions. For two situations, I tried to determine whether differences in data were
statistically significant. For the section addressing value-added content, I used a portion
of Google Analytics called In-Page analytics, which provides a visual data layer over any
webpage so that one can see which links on that webpage have been clicked and how
many times (similar to the click analytics process Tabatha Farney employed).
I have used a few tools to help visualize my findings, including Many Eyes2, Tableau Professional Edition 6.1 and Excel 2007 charts and tables.
In the Discussion section, I also suggest using two other Google Analytics
capabilities called campaign tracking and Intelligence Events, both of which can be used
User Profiles
I am interested in understanding the average user profile for each of the twelve DocSouth
sites, and in trying to find and attempt to explain differences among the sites.
Research Hypothesis and Operational Definitions
I hypothesize that across all sites, users will predominately have the characteristics
outlined in Table 2.
Table 2. Hypothesized Characteristics of DocSouth Users
Characteristic Hypothesis Rationale
1. Geographic Location Chapel Hill, NC USA The CDLA is located in Chapel Hill and much of the DocSouth content is related to events in the South. In addition, a large limitation of my study is that I was not able to filter out internal CDLA IP addresses, which will appear as Chapel Hill visitors. To see more about this limitation, see the limitations section, Filters.
2. Language English Most of the DocSouth materials are written in English.
3. New vs. Return New The DocSouth content includes many materials that may provide quick answers to questions. It seems likely, then, that DocSouth would have more new users than returning users. The ratio of new to returning visitors across sites may have large variance as some DocSouth sites have fewer summaries and materials that would be conducive to quick answers. 4. Browser Internet Explorer Internet Explorer is one of the most
prominent desktop icons on the desktops of the UNC-CH library computers.3 5. Most common mobile
operating system
iPhone The iPhone has been on the market longer than iPads or smartphones that use the Android operating system. 6. Source Google Google is the most popular search engine
globally4.
7. Average time on site Less than two minutes Many of the DocSouth pages could be read in less than two minutes time. Also, I knew going into this research project that the average time on site for
15
important to understand differences in average time on site across the
DocSouth sites than to make decisions about any one site based on the average time on site metric.
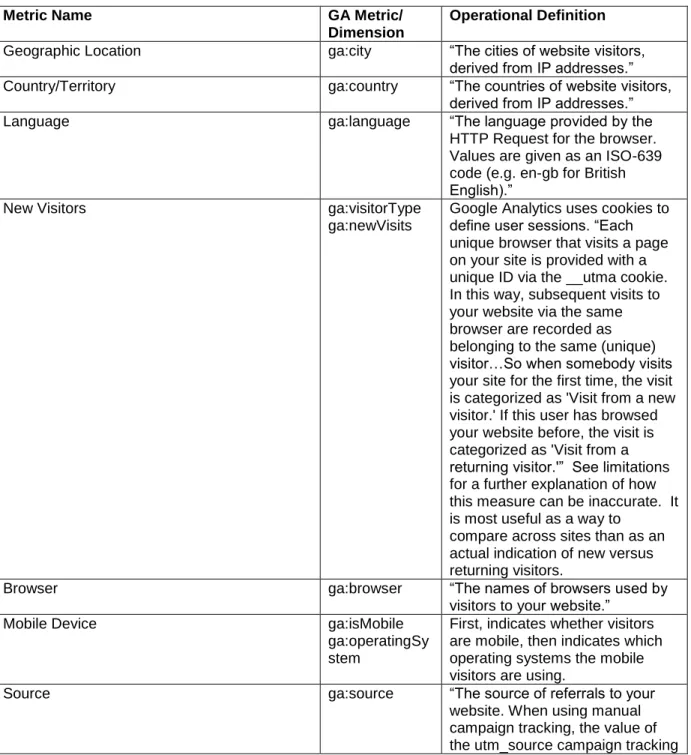
Operational definitions for each of the above metrics are included in Table 3.
Table 3. Operational Definitions for User Profiles. All definitions taken from http://code.google.com/apis/analytics/docs/gdata/dimsmets/dimsmets.html.
Metric Name GA Metric/
Dimension
Operational Definition
Geographic Location ga:city “The cities of website visitors, derived from IP addresses.” Country/Territory ga:country “The countries of website visitors,
derived from IP addresses.”
Language ga:language “The language provided by the
HTTP Request for the browser. Values are given as an ISO-639 code (e.g. en-gb for British English).”
New Visitors ga:visitorType
ga:newVisits
Google Analytics uses cookies to define user sessions. “Each unique browser that visits a page on your site is provided with a unique ID via the __utma cookie. In this way, subsequent visits to your website via the same browser are recorded as belonging to the same (unique) visitor…So when somebody visits your site for the first time, the visit is categorized as 'Visit from a new visitor.' If this user has browsed your website before, the visit is categorized as 'Visit from a returning visitor.'” See limitations for a further explanation of how this measure can be inaccurate. It is most useful as a way to
compare across sites than as an actual indication of new versus returning visitors.
Browser ga:browser “The names of browsers used by
visitors to your website.”
Mobile Device ga:isMobile
ga:operatingSy stem
First, indicates whether visitors are mobile, then indicates which operating systems the mobile visitors are using.
Source ga:source “The source of referrals to your
parameter. When using AdWords autotagging, the value is google. Otherwise the domain of the source referring the visitor to your website. (e.g. document.referrer). The value may also contain a port address. If the visitor came to the site without a referrer, the value is (direct)”
Average time on site ga:timeOnSite The total duration of visitor sessions represented in total seconds.
Methodology
I collected Google Analytics data for the previously mentioned twelve sites. When
indicated in the sections below, to get an overall perspective, I have collected data from
DocSouth.unc.edu; each of the twelve DocSouth sites in this research study is a part of the DocSouth.unc.edu domain. There are other DocSouth sites that are not a part of this study that also fall under DocSouth.unc.edu. Those sites were not included in this study because they either did not have data for the full 2011 calendar year, or they did not have
a working In-Page Analytics feature. I used data for CY2011.
Geographic Location
I collected and analyzed data for the top city where the most visits originated for
each site, including the number of visits, the average pages per visit, the average time on
site, and the bounce rate for that city. I collected the same data for the top state. I also
collected data for the top ten states per site, including the total number of visits from each
state and what percentage of total visits that data represented. I then collected the number
of visits for each state for each site and mapped the data using the website Many Eyes:
17
I also collected and analyzed data for the top two countries per site, including the
total number of visits from each country and what percentage of total visits that data
represented. I used the Visitor Flow function of Google Analytics to explore a particular
population of users from the Philippines.
Language
To determine language, for each site I collected ranked list of the languages
provided by the HTTP Request for the browser for each visit. I noted the top two
languages for each of the twelve sites.
New Visitor vs. Returning Visitor
I collected all visitors that are categorized as new and returning and the
percentage of all visitors for each (see operational definitions). I also collected the
number of pages per visit and the average time on site segmented by new vs. returning
visitors.
I then created custom reports in Google Analytics that allowed me to export data
for new and returning visitors’ pageviews and time spent on site for each day of 2011 for
three sites: CSR, GTTS, and True. I ran Student’s t-tests to determine if the difference
between the means for new and returning visitors was statistically significant.
Browser
I collected the top four browsers for each site and the percentage of visits each of
Mobile Operating System
I collected the top four mobile operating systems for each site and the percentage
of all mobile visits each of those mobile operating systems represents.
Source
I collected the top traffic source for each site. I also collected the percentage of
all visits that came from Google and from Direct Traffic. Google means the users from
the Google search engine. Direct traffic is when someone enters the URL directly into
the web browser or comes to the site through a bookmark.
I also collected the Top Other Traffic Source, which I define as the source from
which the most visitors came where the source was not a search engine, direct traffic, the
library website or Wikipedia. To determine the Top Other Traffic Source, I manually
looked through the ranked list of traffic sources until I found a source that met the
definition.
I also collected the average time on site for five categories of traffic source for
each DocSouth site: Google, Direct, Library Website, Wikipedia, and Top Other Traffic Source. Library Website is defined as users who came from lib.unc.edu. Wikipedia is
defined as users who came from en.wikipedia.org. If the category did not show up in the
top 25 traffic sources, I input its average time on site as “0.” To compare the differences
in that data, I used a one-way ANOVA test and a Student’s t-test.
Average Time on Site
19
Results
The results for each hypothesis are included below, with a conclusion section following
this section. The limitations for the entire study are included in section six, but are
relevant to this section.
Geographic Location. Hypothesis: Chapel Hill, NC USA Result:
Top City: New York City Top State: North Carolina Top Country: USA
My hypothesis that Chapel Hill would consistently be the top location from which users
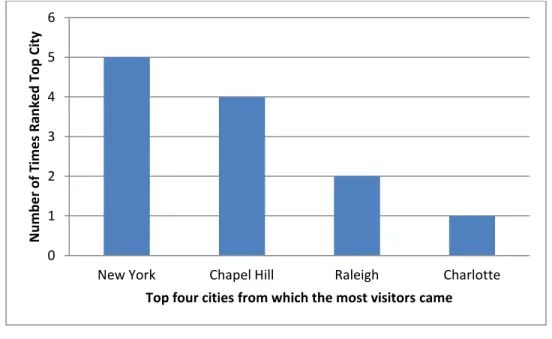
visited was not supported by the data. As Figure 1 relates, the city that originated the
most visitors (as determined by IP address) for five of the 12 sites was New York City.
Figure 1. Top Visitor Location (City)
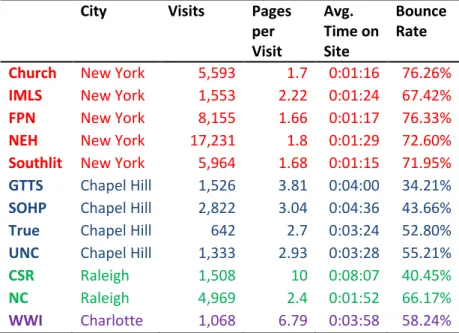
Though there are more visits from New York City, those visits tend to have a higher
bounce rate, a lower time on site, and lower average pages per visit. See Table 4. One
likely factor for more visits from New York City than from Chapel Hill is the larger 0 1 2 3 4 5 6
New York Chapel Hill Raleigh Charlotte
N u m b e r o f Ti m e s R an ke d To p C ity
relative population of New York City to Chapel Hill. Another factor may be the kinds of
content—it is possible that content from sites like “First-Person Narratives” and “The
Church in the Southern Black Community” resonate with a broader population than some
of the CDLA’s other more location-specific content like the collection UNC—a site
devoted to the history of the University of North Carolina.
Table 4. Top City for Each Site
City Visits Pages per Visit
Avg. Time on Site
Bounce Rate
Church New York 5,593 1.7 0:01:16 76.26% IMLS New York 1,553 2.22 0:01:24 67.42% FPN New York 8,155 1.66 0:01:17 76.33% NEH New York 17,231 1.8 0:01:29 72.60% Southlit New York 5,964 1.68 0:01:15 71.95% GTTS Chapel Hill 1,526 3.81 0:04:00 34.21% SOHP Chapel Hill 2,822 3.04 0:04:36 43.66% True Chapel Hill 642 2.7 0:03:24 52.80% UNC Chapel Hill 1,333 2.93 0:03:28 55.21% CSR Raleigh 1,508 10 0:08:07 40.45% NC Raleigh 4,969 2.4 0:01:52 66.17%
WWI Charlotte 1,068 6.79 0:03:58 58.24%
My hypothesis that North Carolina would be the top state from which visitors
came was supported by the data. The top state for eight out of twelve sites is North
Carolina. Table 5 shows the top ten locations for each of the twelve sites. It also shows
the percentage of total visits each location represents. Notice that the distribution of
21
Table 5. Number of Visits for Top Ten States for Each Site. Table continues on next page.
Church CSR FPN GTTS IMLS NC
Region Visits %of Total
Visits Region Visits %of Total
Visits Region Visits %of Total Visit
s Region
Visit s
%of Total Visit
s Region Visits %of Total Visit
s Region Visits %of Total Visit s
California 12,702 8%
North Carolina
10,34
2 24% Texas 23,751 8%
North
Carolina 4,276 48%
North
Carolina 6,175 8%
North
Carolina 41,139 22%
North Carolina 10,932 7% Texas 3,298 8% California 22,885 7% California 321 4% California 4,898 6% California 11,707 6%
New York 10,808 7% California 2,084 5%
North
Carolina 21,315 7% New York 277 3% Georgia 4,796 6% New York 8,522 5%
Georgia 9,592 6% Georgia 2,071 5% New York 20,485 6% Florida 234 3% Texas 4,482 5% Texas 8,449 5%
Texas 8,581 5% Virginia 2,039 5% Georgia 16,367 5% Virginia 219 2% Virginia 3,578 4% Virginia 6,559 4%
Pennsylvania 6,931 4% Florida 1,935 5% Florida 13,267 4% Georgia 208 2% Florida 3,230 4% Georgia 6,525 4%
Florida 6,807 4% Tennessee 1,569 4% Virginia 12,933 4%
South
Carolina 179 2% New York 3,164 4% Florida 6,451 4%
Virginia 6,005 4%
South
Carolina 1,533 4%
Pennsylvani
a 11,054 4% Texas 151 2%
South
Carolina 2,998 4%
Pennsylvani
a 5,082 3%
Illinois 5,581 3% New York 1,410 3% Illinois 9,724 3% Indiana 142 2% Pennsylvania 2,372 3% Illinois 4,696 3%
Maryland 5,580 3% Illinois 959 2% Ohio 7,837 2% Illinois 139 2% Alabama 2,207 3%
South
Carolina 4,547 2%
83519
52.13
% 27240
63.90
NEH SOHP Southlit TRUE UNC WWI
Region Visits %of Total
Visits Region Visits %of Total
Visits Region Visits %of Total Visit
s Region
Visit s
%of Total Visit
s Region Visits %of Total Visit
s Region Visits %of Total Visit s
California 44,074 9%
North Carolina
10,60
9 24% California 17,460 7%
North
Carolina 2,479 38%
North
Carolina 3,912 36%
North
Carolina 5,825 17%
New York 36,397 7% Georgia 2,538 6% Texas 14,691 6% Pennsylvania 467 7% California 504 5% California 2,397 7%
Texas 27,763 5% California 2,317 5% New York 13,142 6% California 292 5% Texas 431 4% New York 1,503 4%
North
Carolina 26,722 5% New York 2,108 5%
North
Carolina 12,762 5% Virginia 244 4% Virginia 379 3% Texas 1,376 4%
Georgia 22,921 4% Virginia 1,577 4% Georgia 12,620 5% Texas 224 3% New York 328 3% Illinois 1,029 3%
Florida 22,790 4% Florida 1,551 3% Florida 11,185 5% Georgia 219 3% Georgia 304 3%
South
Carolina 896 3%
Pennsylvania 20,882 4% Texas 1,497 3% Virginia 9,339 4% New York 195 3% Florida 290 3% Florida 848 2%
Virginia 19,508 4%
South
Carolina 1,474 3%
Pennsylvani
a 8,049 3% Florida 159 2% Pennsylvania 229 2% Ohio 847 2%
Illinois 16,248 3% Washington 1,239 3% Illinois 6,510 3%
South
Carolina 108 2% Illinois 200 2% Georgia 828 2%
Massachuset
ts 14,797 3% Ohio 1,197 3% Tennessee 6,246 3% Tennessee 108 2% Ohio 190 2% Virginia 815 2%
23
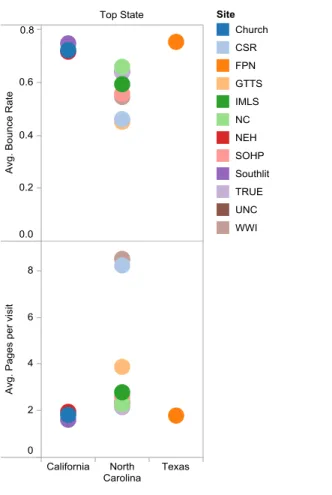
It is illuminating to look at the distribution of visits, pages per visit, time on site
and bounce rate across top states. Table 6 and Figure 2 show that when the top state is
North Carolina, the percentage of total visits, pages per visit and average time on site
tend to be larger than they do from other states. By contrast, the bounce rate tends to be
lower. I have not calculated whether these are statistically significant differences as I did
not have sufficient data to run tests for significance.
Table 6. A Comparison of Top States’ Metrics for Each Site
Site Top State Number of Visits
% of Total Visits
Pages per visit
Avg. Time on Site
Bounce Rate
Church California 12,702 8% 1.82 0:01:16 72.33%
NEH California 44,074 9% 1.95 0:01:48 71.75%
Southlit California 17,460 7% 1.61 0:01:02 74.90%
True North Carolina 2,479 38% 2.15 0:01:57 64.06% UNC North Carolina 3,912 36% 2.34 0:02:37 64.16% WWI North Carolina 5,825 17% 8.51 0:03:57 54.59% CSR North Carolina 10,342 24% 8.23 0:06:30 46.19% GTTS North Carolina 4,276 48% 3.88 0:03:17 45.21% IMLS North Carolina 6,175 8% 2.79 0:02:25 59.43% NC North Carolina 41,139 22% 2.28 0:01:57 66.02% SOHP North Carolina 10,609 24% 2.56 0:03:14 55.75%
Figure 2. Average of Bounce Rate and Average of Pages per visit for each Top State. Color indicates site.
These data may indicate that visits from North Carolina are more engaged visits than
visits from other states. Although the available data did not allow me to run statistical
tests for significance of these differences, the data suggest that visitors coming from
North Carolina may be less likely to “bounce” from the site and be likely to visit more
pages per visit than visitors from outside of North Carolina.
What may be the most useful conclusion based on these data is that some sites have a
larger local significance than others do. Namely, “Going to the Show” (GTTS), “True
and Candid Compositions” and “The First Century of the First University” (UNC)
generate a significant percentage of their visits from North Carolina and especially the
25
and people in North Carolina, whereas many of the other collections include materials
that are more broadly of the South or that are not location-specific at all.
It is especially interesting to note that for GTTS, almost 50% (48%) of traffic comes
from North Carolina. In fact, eight of its ten top cities are from North Carolina, and those
cities make up 34% of all traffic. There may be a few reasons for these kinds of large
percentages beyond the location-centric materials. GTTS is the newest of the twelve
collections, having only been created in 2008. See Table 1 for other collection dates. It
brings in the third least number of visits of all collections, so 48% of visits only equates
to 4,276 visits (as a comparison, see that 8% of visits from California for the Church site
means over 12,000 visits). It is again important to note that I was not able to filter for
internal CDLA visits, nor for the faculty members’ IP addresses who helped create the
content; it is possible, therefore, that some percentage of visits to GTTS is from CDLA
staff or the faculty that are heavily invested in the project. While bringing in a large
number of visits from North Carolina most likely means GTTS is serving the UNC
campus and Chapel Hill community well, such a high percentage of visits from Chapel
Hill—coupled with its relatively low number of total visits—means one should also
consider the possibilities that the collection does not hold as broad an appeal outside the
local community, that the collection has not had enough time to gain traction outside of
the local community, or that it has not been publicized enough outside of the local
community.
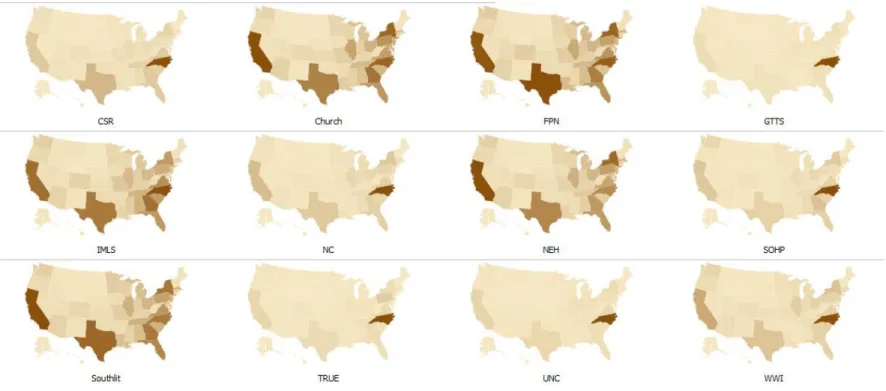
Knowing just the top ten states for each location does not support an understanding of
all visits originated in those top locations helps, but it still does not show the distribution.
27
As shown in Figure 3, the location distribution of visits varies widely by site. NEH, FPN,
Southlit, NC, and Church have visits distributed over more locations than the other sites.
Even though Figure 3 shows each map according to its own scale of visits (which can be
adjusted on the website), those sites with more total visits also have the most distributed
locations. Figure 4 shows total visits per site.
Figure 4. Total Visits per Site
NEH, FPN, Southlit, NC, and Church have both the most visits per site (see
Figure 4) and also appear (from analyzing Figure 3) to have the widest geographical
distribution. We can conclude that NEH, FPN, Southlit, NC and Church are bringing in
more visits and serving a more geographically distributed population than UNC, GTTS,
and True, which have the least number of visits, most of which are concentrated in North
Carolina.
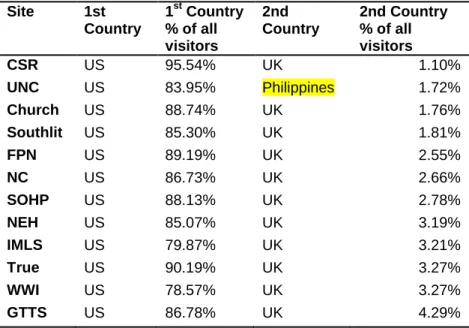
My hypothesis that most of the CDLA’s visitors come from the U.S was supported by
the data. One hundred percent of the twelve DocSouth sites have most (always more than True_
GTTS UNC WWI CSR SOHP IMLS Church NC Southlit FPN NEH
29
75%) of their visitor’s IP Addresses originating in the U.S. See Table 7. All but one site
have the second country with the most visits in the U.K. The UNC collection has as its
second-highest ranked country the Philippines, with 1.72% of all visits originating there.
It is useful to know that visitors are mostly coming from the U.S.
Table 7. Comparison of Top Countries’ Metrics for Each Site
Site 1st Country
1st Country % of all visitors
2nd Country
2nd Country % of all visitors
CSR US 95.54% UK 1.10%
UNC US 83.95% Philippines 1.72%
Church US 88.74% UK 1.76%
Southlit US 85.30% UK 1.81%
FPN US 89.19% UK 2.55%
NC US 86.73% UK 2.66%
SOHP US 88.13% UK 2.78%
NEH US 85.07% UK 3.19%
IMLS US 79.87% UK 3.21%
True US 90.19% UK 3.27%
WWI US 78.57% UK 3.27%
GTTS US 86.78% UK 4.29%
Knowing that the UNC site for some reason has drawn 1.72% of its visits from the
Philippines does not reveal much. Knowing that 1.72% means 190 visits, and that the
average time on site is less than 20 seconds with an almost 92% bounce rate implies that
the majority of these people are either not finding what they are looking for, or finding it
very quickly. On further exploration, I was able to find (through the Visitors Flow
function in Google Analytics) that 78% of traffic from the Philippines was to one
webpage, the “Printed Page for Commencement Exercises, June 2, 1859”5
for the
University of North Carolina. The page would only take about twenty seconds to scan if
a person were looking for a particular name. If I had instead found that these Filipino
average of almost two minutes, then I would have suggested that the CDLA consider
providing a Filipino version of the site.
Language Hypothesis: English Result: English
My hypothesis that English would be the predominant language was supported by the
data: one hundred percent of sites have predominantly US English-speaking users. All
but one site have British English as the second top language. The “North Carolinians and
the Great War” (WWI) site is the only one to have as its second most-used language
French: 2.47% of visits (849 visits) have French as the language provided by the HTTP
Request for the browser. These French visits average 1.43 minutes, which is only
slightly less than the US English-speaking visits (at 2.15). If the CDLA were to decide
that creating other-language versions of their sites might be a way to increase traffic
outside of the U.S., creating a French-language version of WWI might be the best pilot
site. If the CDLA wanted to create other-language versions of sites, however, it might be
more useful to determine the top non-English language spoken for locations that are
already bringing the most visits. In this instance, most visits to WWI come from North
Carolina. Given the percentage of Spanish-speaking people in North Carolina6, a better project might be to create a Spanish-language version of WWI to support that known
population.
New Visitor vs. Returning Visitor Hypothesis: New
Result: New
I hypothesized that each site would have more new users than returning users,
31
have the highest percentage of returning visitors, which was calculated by subtracting
new visit percentages from 100%. See Figure 5. True has almost as many returning
visitors as new visitors (50.2% new, 49.8% returning).
Figure 5. Return versus New Visitors
Return visitors may indicate that users of True, CSR, and GTTS are finding the
content useful and engaging, as we hope. As we already know, True and GTTS get a
large percentage (almost 10% and more than 17% respectively) of their traffic from
Chapel Hill. Perhaps these are returning scholars who find the material engaging. One
way to explore that idea further is to see if the returning visitors spend more time on the
site and view more pages on the site than the new visitors for these three sites. Table 8
shows the metrics of pages per visit and average time on site by new or returning visitor.
Table 8. New Versus Returning User Engagement
Site Type of Visitor
Visits Pages/Visit Average time on site
CSR New 24766 5.75 4m3s
Returning 17862 10.82 9m10s
GTTS New 5686 3.04 2m5s
Returning 3171 4.42 3m56s 0%
25% 50% 75% 100%
Return Visitors
True New 3263 1.85 1m20s Returning 3221 1.93 1m55s
On first glance, the difference in the averages appears significant; knowing the
difference in averages does not indicate whether the difference is statistically significant,
however. To determine statistical significance, I created custom reports in Google
Analytics that allowed me to export the following data sets for CSR, GTTS, and True:
1. Total pageviews per day for new visitors for each day of 2011;
2. Total pageviews per day for return visitors for each day of 2011;
3. Total time on site per day for new visitors for each day of 2011;
4. Total time on site per day for return visitors for each day of 2011.
The difference in pageviews between new and return visitors for all three sites was
not statistically significant. The difference in time on site for GTTS was also not
statistically significant. For CSR and True, total time on site per day for the two groups
(return and new visitors) differed significantly according to Student’s t-test. CSR return
visitors spend significantly more total time on site per day (M=7:28:26, SD=3:26:42)
than new visitors (M=4:35:07, SD=2:06:02), t(363)= -25.96, p= <.0001. True return visitors spend significantly more total time on site per day (M=0:16:55, SD=0:35:40)
than new visitors (M=0:11:55, SD=0:20:58), t(363)= -4.55, p= <.0001.
Thus, returning visitors are spending more time on site for CSR and True, perhaps
indicating they are more engaged with the content than new visitors are. In the case of
GTTS, however, having a larger percentage of return visitors without any other indication
33
not broadly known and is not bringing in a broad base of new users, as shown by the
smaller relative total visits.
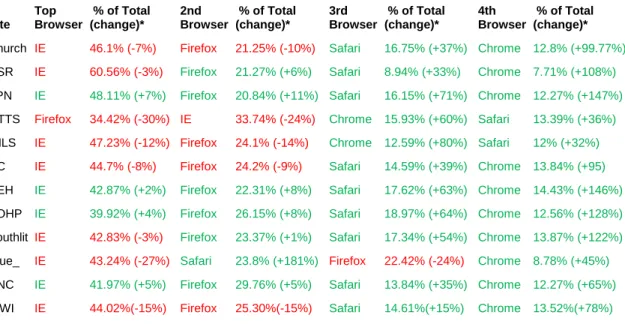
Browser
Hypothesis: Internet Explorer Result: Internet Explorer
All but one site had the most visits from Internet Explorer: GTTS had the most visits
from Firefox. The top four browsers were always a mix of Internet Explorer, Firefox,
Safari and Chrome. See Table 9 for a comparison of what percentage of all visits came
from each browser for each of the twelve sites, as well as the percent of change from
previous year figures. Take special note of the large percent of change for Chrome for
each site.
Table 9. Top Four Browsers for Each Site. (change) shows percent of change from previous year figures. Red indicates a negative change and green a positive change.
Site Top Browser
% of Total (change)*
2nd Browser
% of Total (change)*
3rd Browser
% of Total (change)*
4th Browser
% of Total (change)*
Church IE 46.1% (-7%) Firefox 21.25% (-10%) Safari 16.75% (+37%) Chrome 12.8% (+99.77%)
CSR IE 60.56% (-3%) Firefox 21.27% (+6%) Safari 8.94% (+33%) Chrome 7.71% (+108%)
FPN IE 48.11% (+7%) Firefox 20.84% (+11%) Safari 16.15% (+71%) Chrome 12.27% (+147%)
GTTS Firefox 34.42% (-30%) IE 33.74% (-24%) Chrome 15.93% (+60%) Safari 13.39% (+36%)
IMLS IE 47.23% (-12%) Firefox 24.1% (-14%) Chrome 12.59% (+80%) Safari 12% (+32%)
NC IE 44.7% (-8%) Firefox 24.2% (-9%) Safari 14.59% (+39%) Chrome 13.84% (+95)
NEH IE 42.87% (+2%) Firefox 22.31% (+8%) Safari 17.62% (+63%) Chrome 14.43% (+146%)
SOHP IE 39.92% (+4%) Firefox 26.15% (+8%) Safari 18.97% (+64%) Chrome 12.56% (+128%)
Southlit IE 42.83% (-3%) Firefox 23.37% (+1%) Safari 17.34% (+54%) Chrome 13.87% (+122%)
True_ IE 43.24% (-27%) Safari 23.8% (+181%) Firefox 22.42% (-24%) Chrome 8.78% (+45%)
UNC IE 41.97% (+5%) Firefox 29.76% (+5%) Safari 13.84% (+35%) Chrome 12.27% (+65%)
WWI IE 44.02%(-15%) Firefox 25.30%(-15%) Safari 14.61%(+15%) Chrome 13.52%(+78%)
In fact, what may be most interesting is to observe how the numbers have
changed over time. The following chart (Figure 6) shows a comparison between data for
Figure 6. Visits by Browser 2010 & 2011
Visits using Safari and Chrome have increased, while visits using IE and Firefox have
decreased. This data, while interesting, may not have much of an impact on the CDLA’s
everyday considerations. Though they do have plans down the line to rework much of
their website design, they would no doubt design the sites to display well on all four
browsers.
Mobile Operating System Hypothesis: iPhone
Result: iPad
I hypothesized that the iPhone, because of its longevity on the market, would be the
mobile operating system most used for accessing the collections. In fact, the mobile OS
most used is the iPad, then Android, and last the iPhone. See Table 10.
Table 10. Top Four Mobile Operating Systems. % of Total refers to % of Total Mobile Traffic
Site Top Mobile OS % of Total 2nd Mobile OS % of Total 3rd Mobile OS % of Total 4th Mobile OS % of Total
Church Android 34.16% iPhone 30.51% iPad 23.26% iPod 6.19% 0 10 20 30 40 50 60
2010 2011
35
FPN Android 32% iPhone 28.18% iPad 24.16% iPod 9.65% NC Android 31.54% iPad 27.26% iPhone 26.77% iPod 8.14% NEH Android 30.46% iPhone 28.30% iPad 24.68% iPod 10.69% CSR iPad 48% iPhone 23.86% Android 19.67% iPod 4.09% GTTS iPad 38.12% Android 30.31% iPhone 24.06% iPod 3.44% IMLS iPad 29.94% Android 28.11% iPhone 27.11% iPod 6.85% SOHP iPad 37.97% iPhone 26.08% Android 25.24% iPod 5.66% True_ iPad 43.70% Android 26.05% iPhone 19.33% BlackBerry 5.04% UNC iPad 31.78% iPhone 31.46% Android 25.55% iPod 6.23% WWI iPad 33.79% iPhone 28.35% Android 24.37% iPod 9.57% Southlit iPhone 31.14% iPad 28.56% Android 25.63% iPod 9.96%
Upon reflection, this finding makes sense as the CDLA’s collections are largely
visual collections, and their content is content perhaps best viewed on a larger screen, like
that of the iPad. The content is also probably not content that people currently view in an
on-the-go manner. If the CDLA were to create a mobile application meant solely for
accessing content in its current form, I would suggest they create it for the iPad (rather
than iPhone or Android) market.
Source Hypothesis: Google Result: Google
I hypothesized that most of DocSouth users would come from Google, which was supported by the data. The second largest traffic source was “direct” traffic, which
means those users who directly input the URL for the site into the browser or follow
Figure 7. Percentage of Traffic by Traffic Source
What is perhaps most interesting here is the top source of traffic that is not either direct or
from a search engine. See Table 11.
Table 11. Top Other Traffic Source. Top Other Traffic Source is defined as the source from which the most visitors came where the source was not a search engine, direct traffic, the library website or Wikipedia.
Site Top Other Traffic Source Traffic Source Rank
Number of visits
Percentage of total visits
Church memory.loc.gov 6th7 3033 1.89%
CSR ncgenweb.us 6th8 593 1.39%
FPN memory.loc.gov 5th9 5963 1.89%
GTTS cinematreasures.org 4th10 197 2.22% IMLS foodtimeline.org 5th11 3198 3.91%
NC learnnc.org 11th12 893 0.49%
NEH onlinebooks.library.upenn.edu 9th13 3363 0.65%
SOHP crdl.usg.edu 4th14 1031 2.31%
Southlit katechopin.org 4th15 7356 3.12%
TRUE museum.unc.edu 6th16 128 1.97%
UNC museum.unc.edu 3rd17 1108 10.06%
WWI learnnc.org 6th18 566 1.65%
0% 25% 50% 75% 100%
Other
Direct
37
This begs the question of which kind of traffic source brings users who stay on the site
the longest. On average across all sites, the Top Other Traffic Source brings users with a
larger average time on site. See Figure 8.
Figure 8. Average Time on Site by Traffic Source. The data for this visualization came from the top 25 traffic sources. If any of the categories was not one of the top 25 traffic sources, its time on site was input as "0."
I used a one-way ANOVA to test whether the differences in average time on site among
the five traffic sources was significant. The difference across all five traffic sources was
not significant, F (4, 60) = 1.761, p= .149. I then chose to test whether the difference in average time between Top Other Traffic Source and each other source category was
significant.
1. Top Other Traffic Site versus Google. Total time on site per day for the two
groups differed significantly according to Student’s t-test. Average Time on Site (in seconds) for Top Other Traffic Sources was significantly higher (M=214.17,
SD=118.69) than Google (M=116.09, SD=80.85), t(10)= 62.88, p= <.0001. 01:53
01:54 02:13
03:06 03:34
0 1 2 3 4
Google Wikipedia Library Website Direct Top Other Traffic Source
2. Top Other Traffic Site versus Direct. Total time on site per day for the two
differed significantly according to Student’s t-test. Average Time on Site (in seconds) for Top Other Traffic Sources was significantly higher (M=214.17,
SD=118.69) than Direct (M=176.82, SD=96.24), t(10)= 21.16, p= <.0001. 3. Top Other Traffic Site versus Wikipedia. Total time on site per day for the two
groups differed significantly according to Student’s t-test. Average Time on Site (in seconds) for Top Other Traffic Sources was significantly higher (M=214.17,
SD=118.69) than Wikipedia (M=113.36, SD=95.76), t(10)= 57.42, p= <.0001. 4. Top Other Traffic Site versus Library Site. Total time on site per day for the
two groups differed significantly according to Student’s t-test. Average Time on Site (in seconds) for Top Other Traffic Sources was significantly higher
(M=214.17, SD=118.69) than Library Site (M=145.55, SD=202.12), t(10)= 16.57, p= <.0001.
Top Other Traffic Site had a significantly higher average time on site than each other
kind of traffic source. It would be useful to do a more thorough study into these top other
traffic sites to see the following:
1. How did they hear about the DocSouth site?
2. What kind of content do they link to in the DocSouth site?
3. Which DocSouth sites have the most and least of these other traffic sources in their top traffic sources and what impact, if any, does that have on number of
visits and length and depth of stay?
Average Time on Site
Hypothesis: Less than two minutes
39
My hypothesis was not supported by the data, as the data showed the average time
on site is slightly more than two minutes. It is also interesting to see the average number
of pages each user visited. See Table 12.
Table 12. Average Pages per Visit and Time on Site
Site Pages per Visit
Average Time on Site
Southlit 1.7 0:01:14
NC 1.91 0:01:26
Church 1.97 0:01:27
True 1.89 0:01:37
IMLS 2.18 0:01:40
FPN 1.92 0:01:43
UNC 1.88 0:01:46
NEH 2.02 0:01:50
WWI 4.11 0:02:09
SOHP 2.31 0:02:40
GTTS 3.53 0:02:45
CSR 7.87 0:06:12
Figure 9. Variance of Average Time on Site
It is also interesting to see both average time spent on site and average pages per visit
41
Figure 10. Depth of Engagement
If time on site and pages per visit can be considered measurements of depth of
engagement with a site, then those visitors to CSR have much more engaged visits with
the content. Southlit has the least depth of engagement in its visits. Yet the answers to
why may lie in the kind of content on each site, the varying interfaces for each site, as
well as the limitations of average time on site.
CSR’s content is unlike other DocSouth site’s content because most of the
webpages in the site are digital transcripts of single analog pages in large analog volumes
of related materials. There are many pages that are linked by context. Figure 11 below is
an example of a page from the CSR site. Notice how easy it is to navigate to the next
document in the volume, which is related to the current document. Southlit WWI SOHP GTTS CSR 0 1 2 3 4 5 6 7 8 9
0 1 2 3 4 5 6 7
A ve rag e Pag e s Per Vis it
Figure 11. Example of CSR Webpage
In other DocSouth sites, the content is different in two ways:
1. Most often a single page will have the entire volume of a text. See
http://DocSouth.unc.edu/southlit/chopinawake/chopin.html for an example;
2. The content is also not as interrelated. The text for Chopin’s The Awakening has a less direct relationship to other content on Southlit than Document 5 does to
Document 4 on the CSR site.
In addition, as mentioned in the hypothesis section, average time on site has
limited use. Average time on site is calculated by subtracting the time stamp for an
43
requested to view a page on CSR at 10:00am, read the content, and then requested the
next page at 10:02am, Analytics could calculate that I was on the original page for
two minutes. If I left the site instead of requesting the next page—even if I spent two
minutes reading the original page— it would be counted as an average time of 0
because Analytics has no time stamp to subtract the original request from. Thus, if a
user spent two hours reading the Chopin text in the link above, then left the site,
Analytics would not track those two hours. Because the content is more interrelated
on CSR than on other sites, users may be more likely to request another page, and so
each visitor’s time is more likely to be tracked.
Conclusions
The CDLA might want to determine if their institution’s activities are privileging
one of the populations from its mission statement (scholars, students, librarians, the
general public, North Carolina, “beyond” North Carolina) over another kind of
population. If they find that their collections are only reaching those in Chapel Hill or that
they are not providing the content in a meaningful way to scholars who speak languages
other than English, they may be privileging one kind of scholar over another, in which
case they should either take steps to rectify that situation, or make changes to the mission
statement to reflect their priorities.
Knowing that certain kinds of collections generate more or less traffic in Chapel
Hill can help the CDLA to determine what kind of collections they want to continue to
create. If location-specific collections draw visitors only from those locations, they may
the denizens of Chapel Hill are their primary users and their primary concern, in which
case they may want to create more materials similar to GTTS or UNC. As one
respondent in Molly Bragg’s survey said, “other collections are digitized not because
they will be widely used but because their being digitally available and searchable is very
significant to an important group of users, regardless of the size of this user group. In
these instances, statistics should be treated with less weight” (2011).
CSR, True, and GTTS all have location-centric materials. It is interesting to find
that CSR, True, and GTTS have more returning visitors than most other DocSouth sites, and that CSR’s and True’s returning visitors spend significantly more time on the site
than their new users do—a positive indication of engagement. Yet GTTS’s returning
visitors do not spend significantly more time on the site than its new visitors. This,
coupled with its low total numbers, may simply indicate that the site is not used much by
anyone. In the Discussion section at the end of this paper, I will indicate ways in which I
believe the CDLA could do some focused outreach to draw in more visitors. Perhaps
GTTS could serve as a pilot project for such efforts.
Seeing the way in which CSR is an outlier in terms of time on site and pageviews
does not necessarily mean that users are happier with the layout of that site. It would be
interesting to do some user experience testing on whether user’s prefer to click through
material (as with CSR), or whether they prefer to scroll through material (as with most of
the other sites).
More than 75% of all traffic to these twelve sites comes from the U.S. If the
CDLA wants to expand its user base outside the U.S., it could consider creating
45
encourage more visits from within the U.S. If the CDLA decided that they wanted to
explore whether creating other-language versions of sites brought more visitors, I would
suggest starting with creating both a French and a Spanish version of WWI.
We should continue to keep an eye on the top mobile devices, the top operating
system, and the top browsers used. If we see that a mobile operating system has made a
large jump, we should consider creating mobile applications for those sites. At the
moment, however, mobile visits make up a very small percentage of total visits.
Perhaps the most interesting conclusion is that traffic that comes from sources
other than search engines, the library website, or Wikipedia is traffic that stays on the site
significantly longer. It may be worth exploring how to increase traffic from these Top
Other Traffic Sources. It would be worth exploring those sites to see what kinds of links
they provide to CDLA content and how those sites learned of CDLA content, especially
if it was through any publicity or branding efforts on the CDLA’s part. I believe it would
be worth pursuing these other traffic sources through various forms of outreach. If
possible, it would be useful to see if there is any overlap in the top other traffic sources
across sites. If there were, those institutions would be the ones to try to contact. It might
also be worth reaching out to individuals at the institutions to see if there are any ways to
collaborate more formally on projects in the future. In addition, the CDLA could see if
the individuals are willing to take part in interviews or focus groups for the website
redesign that is slated for the future. Building relationships with these stakeholders could
Value-Added Content
For the DocSouth Collections, the CDLA augments the digitized primary sources with materials that add more context or insight. For instance, to augment the section that
includes the full-text HTML file of The Awakening, the site also includes a summary of the title, a short biography of Kate Chopin, the author of The Awakening, and a highlight page that discusses how Chopin’s reputation changed from scandalous to beloved. Both
the Head of the CDLA and the Head of the Digital Publishing Group within the CDLA
have been wondering if these contextual materials—which I will call value-added content
(VAC)—are being used. In consultation with both Heads, we decided that an acceptable
return on investment would be if VAC content made up at least 10% of clicks.
Hypothesis
Across the same twelve DocSouth sites, value-added content (VAC) will make up more than 10% of total clicks or views.
Operational Definitions
DocSouth sites will include the same twelve sites from Table 1. Value-added content (VAC) is content that augments the primary sources in some way but is not 1) a
representation of a primary source document with or without alterations; 2) a description
of how to browse or search for the primary source documents; or 3) a description of how
to use the website. VAC could be anything from a summary of a primary source
document in a collection, to a timeline of the era in which the primary source documents
were created, to educational materials for teachers to help their students use the primary