Fei-Wen Deng The Influence of Adding Alum on Biological
Phosphorus Removal and Nitrification in Sequencing Batch
Reactors.(Under the direction of Dr. James C. Lamb).
One of the approach for improving reliability of
biological phosphorus removal could be adding alum to
activated sludge mixed liquor. Other studies of limited
scope had suggested that such additions might adversely
affect nitrification in the treatment system. In many plants
that must meet a stringent effluent ammonia limit, that
situation could cause serious problems in meeting permit
requirements.
A bench-scale sequencing batch reactor (SBR) experiment
was conducted, using a control unit without alum addition and
three units that received different dosages of alum. The
results showed that: 1) Adding alum seems have no adverse
effect on biological phosphorus removal, 2) the addition of
alum may exert adverse effects on nitrification, and 3)
acetate plays an important role in biological phosphorus
I would like to acknowledge the advice of my advisor.
Dr. James C. Lamb. I would also like to thank Dr. Donald E.
Francisco and Dr. Philip C. Singer for serving on my
committee and for giving valuable suggestions on this report.
Special thanks are extended to Stephen Shoaf, Carolyn
Durham, and Janice Braxton for their assistance during this
experiment. I would like to express my love and appreciation
to my parents, and my friends, David Chang and Jan Dewaters,
for their support and encouragement.
This investigation was sponsored by North Carolina Urban
Water Consortium, North Carolina Water Resources Research
page
List of Tables v
List of Figures vii
I. Introduction 1
II. Objectives 3
III. Literature Review 4
A. Theories of Phosphorus Removal in 4
Activated Sludge
1. Normal Cell Requirement 4
2. Luxury Uptake 4
a. Biochemistry 5
b. Microbiology 8
3. Chemical Precipitation 9
B. Technology of Sequencing Batch 11
Reactor (SBR)
1. Description of System 11
2. Historical Perspective 11
3. Comparison of SBR and Continuous 13
Flow Process
4. Advantages of SBR 13
IV. Experimental Design 17
A. Design Criteria 17
B. Apparatus 20
1. Feed 20
2. Gas 22
3. Mixing 22
4. Discharge 22
5. Timer Control 23
C. Experimental Stages 28
1. Start up 28
2. Favorable BPR stage - Stage I 29
3. Unfavorable BPR stage - Stage II 29
4. Partially favorable stage - Stage III 29
D. Experimental Methods 31
1. Maintenance 31
2. Sampling 32
3. Analyses 33
V. Results and Discussion 36
A. Influent Characteristics and Operating 36
Conditions
1. Phosphorus Removal by the Control 49
Unit2. Phosphorus Removal by the Units 56
Receiving Alum
3. Effectiveness of Alum Precipitation 62
B. Effect of Alum Additions on Nitrification 69
VI. Conclusions 76
VII. Future Research 77
References 78
TABLE 1 Comprison of SBR and Continuous Flow
Processes
page 14
TABLE 2 SBR Design Criteria
19TABLE 3 Apparatus Status During SBR Periods
27TABLE 4 Analyses of SBR Samples 34
TABLE 5 Average Characteristics of System
Influent37
TABLE 6 Average Operation Conditions
38TABLE 7 Average Effluent Suspended Solids
Performance44
TABLE 8 Average Biochemical Oxygen Demand
Performance45
TABLE 9 Phosphorus Removal by the Control Unit 50
TABLE 10 Phosphorus Performance of the Control 54
Unit at the end of Anaerobic and
Aerobic Phases
TABLE 11 Phosphorus Performance at the end of
Anaerobic Phases
57
TABLE 12 Oxidized Nitrogen Data at the end of
Anaerobic and Aerobic Phases
60
TABLE 14 Nitrification Performance - Comparison 70
of Effluent Ammonia and Oxidized
Nitrogen
TABLE 15 Average pH Values at the end of 74
List of Figures
FIGURE 1 Diagram of SBR Reactor
page 21
FIGURE 2 System Flow Schematic 24
FIGURE 3 SBR Timer Control Design 25
FIGURE 4 Comparison of MLSS 39
FIGURE 5 Comparison of MLVSS 41
FIGURE 6 Effect of MCRT on VSS 47
FIGURE 7 Effluent TP of the Control Unit 51 FIGURE 8 OrthoP of the Control Unit
-at the end of Aerobic Phase
52
FIGURE 9 Effect of Alum and Acetate on
P-release
58
FIGURE 10 Effect of Alum and Acetate on
Effluent TP
66
FIGURE 11 Comparison of NH3-N
the Aerobic Phase
- at the end of 72
FIGURE 12 Comparison of NOx-N
the Aerobic Phase
The eutrophication of lakes and rivers is a serious
problem in many of our natural waters. Phosphorus is one of
the nutrients that often can limit development of eutrophic
conditions and, therefore, the amount of phosphorus that can
be discharged in wastewater discharges has been limited by
regulatory agencies in many areas.There are two broad categories of phosphorus removal
processes. The first is chemical precipitation using alum,
iron salts or lime. Its main disadvantage is the cost for
chemicals and sludge handling. Another approach is biological
phosphorus removal (BPR) in an activated sludge process.
This has the potential for better cost-benefit relationships
than chemical precipitation processes. However, BPR may not
be operated as easily as chemical precipitation for reliable
phosphorus removal because the mechanisms of BPR are stillnot well understood, and design and operating standards are
less well developed.
One approach to assure meeting the limits for effluent
phosphorus concentration is to add chemicals after the BPR
system as post-treatment to compensate for uncertainty of
BPR processes. This would require construction and operation
removes phosphorus by adding alum to activated sludge
aeration tanks was investigated and proved feasible in the 1970's, those studies included only consideration of
conventional activated sludge processes. If BPR is possible
simultaneously with alum addition, the result might be both
economical and reliable. It is not clear, however, whether
the combined treatment would adversely affect BPR performance
or nitrification. Therefore, it was decided to investigate the impact of adding chemicals to mixed liquor in BPR systems.
Among the processes modified for BPR, sequencing batch
reactors (SBR) are felt by some to be highly promising
(Manning, 1985). The SBR is a recently developed technology,
based on the fill-and-draw activated sludge process. A
full-scale plant at Culver, Indiana, has produced consistent biological removal of phosphorus. This study used the SBR
process because of its potential for BPR and the simplicity
The objective of this report are to;
1) review the theories of phosphorus removal in
activated sludge processes;
2) review the technology of sequencing batch reactors;
3) investigate the effects on BPR of adding alum to
bench scale sequencing batch reactors; and
4) investigate the effects on nitrification of adding
Theories of Phosphorus Removal in Activated Sludge
Details of actual mechanisms involved in phosphorus
removal during activated sludge processes are still largely
unresolved. In general, phosphorus removal mechanisms have been
explained mainly in terms of : (1) normal cell requirements;
(2) luxury uptake; and (3) chemical precipitation.
(1) Normal Cell Requirement
Bacteria utilize phosphorus as part of their metabolic
processes in synthesizing microbial material, for which a
composition of C^oe ^180 ^45 ^15 ^ -^^ often cited (Lan et
al.,1983). From analyses of sludges, 2-3% of phosphorus on a
dry-weight basis often is reported. Usually 20 - 30 % of the
influent phosphorus may be removed by microbial growth in
municipal treatment systems. This is based on the stoichio¬
metric composition of the microorganisms and the amounts of
cell material generated in biological processes.
(2) Luxury Uptake
Some investigators have reported that biological storage,
or luxury uptake, is responsible for any further phosphorus
biochemistry and microbiology.
a) Biochemistry
Basically, luxury uptake can occur when the organisms
are subjected to a seguence of anaerobic-aerobic conditions.
During the anaerobic phase, certain phosphorus-accumulating
organisms hydrolyze stored polyphosphate (poly-P) to simple
orthophosphate (ortho-P) to obtain energy for the uptake of
organic substrates. Upon entering the aerobic stage, the
remaining substrates are oxidized, and some of the energy
derived from them is used to form poly-P and cell material.
This results in low concentrations of both phosphorus and
organic substrate in the liquid.
Barth and Stensel (1981) point out that the biological
phosphorus removal capability for a given system is a
function of the influent biochemical oxygen demand (BOD) and
phosphorus concentrations, sludge residence time (SRT), and
phosphorus percentage in the sludge. Marais (1983) proposes a
population selection theory that under anaerobic/aerobic
conditions, poly-P accumulating organisms gain an advantage
over non-poly-P accumulating organisms. Fukase, Shibata, and
Miyaji (1984), however, do not agree that poly-P must be
advantage over others in adsorbing BOD under anaerobic
conditions. They conclude that not only the addition of an
anaerobic stage in the activated sludge process, but also the
influent BOD concentration is important in enhancing
phosphorus removal. Manning and Irvine (1985) suggest that
an anaerobic period with excess substrate allows
phosphorus-accumulating organisms to compete favorably, and the aerobic
period which follows is essential to the final enrichment of
the organisms.
Florentz et al. (1984) have found that nitrates can
affect phosphorus assimilation by inhibiting release of
phosphorus to the liguid although they found no disturbing
effect on phosphorus assimilation inside the cell. Hascoet
and Florentz (1985) point out that the permissible nitrate
in return sludge depends on the influent chemical oxygen
demand (COD). If the influent COD is sufficiently high, the
recycled nitrates have a negligible effect on the phosphorus
removal process.
Marasis, Loewanthal, and Seibrite (1983) report that the
ability to form poly-hydroxy butyrate (PHB) is important to
the phosphorus removing organisms. They suggest that PHB is
involved in the supply of ATP, reducing energy and carbon
that luxury uptake of phosphate is the result of microbes
existing under partial stress. Partial stress is caused by
an imbalance in the biochemical energy pool (in the form of
ATP and reduced cofactors), carbon source, and other
components such as sulfide and ammonia.
In order to find the pathways of luxury uptake, Florentz
o "I
et al.(1984) used P nuclear magnetic resonance (NMR) to
observe the displacement of stored phosphorus from the poly-P
form to soluble phosphorus (Pi) form during the non-aerated
period. They state that this displacement is very rapid in
the presence of carbonaceous pollution and is slow in its
absence. The transfer process reverses immediately upon
aeration. Their works are in agreement with the biochemical
model proposed by Marais and co-workers (1983) who propose
the following equation :
2 acetate + 2 ATP = acetoacetate + 2 ADP + 2 Pi
When the pollutant is degraded and stored in the organisms in
the form of acetoacetate, two molecules of Pi are released.
An osmotic pressure is created as the stored polyphosphate
decreases and the phosphorus in the cell increases. Thereby,
the phosphorus diffuses through the cytoplasmic membrane and
Fuhs and Chen (1975), and Buchan (1983) report that
Acinetobacter spp can store phosphorus in metachromic volutin
granules and mainly use acetic acid as substrate. Nicholls
and Osborn (1978) find good correlation between the removal
of phosphorus in an activated sludge plant and the presence
of the volutin granules in the organisms. They also state
that not only Acinetobacter are responsible for the
accumulation, but other facultative bacteria are also capable
of phosphorus removal. Brodich and Joyner (1983) propose
that Aeromonas and Pseudomonas may also contribute to
biological phosphorus removal. Florentz and Hartemann (1984)
further identify that Bacillus cereus and Pseudomonas cepacia
individually accumulate more phosphate during the stationary
phase than Acinetobacter in a meat extract medium without
acetate. However, they point out that supplying acetate to a
pure culture of Acinetobacter entails a significant
over-accumulation of phosphorus which is stored in the form of
poly-P granules inside the cellular cytoplasm. Letter (1985)
suggests that the short-chain carbon compounds, such as
acetate and butyrate, can stimulate phosphorus accumulation.
After comparing various short-chain carbon compounds,
Gerber et al.(1986) report that the most favorable compounds
that intermittent-carbon-supplementation can be used to
improve long-term BPR efficiency and reliability. The
frequency and magnitude of supplemental carbon addition
depends on the organic loading history of the system.
(3) Chemical Precipitation
As mentioned before, not all researchers agree that
enhancedphosphorus removal is the result of biological
mechanisms. Some believe that the improved phosphorus
removal results from physical-chemical phenomena.
Menar and Jenkins (1969) hypothesized that calcium
phosphate precipitation followed by sorption accounts for
exceedingly high phosphorus removal. They state that the
formation of a calcium phosphate sludge is induced by higher
pH, which is caused by decreased production and increased
stripping of carbon dioxide during the aeration period.
Riding et al.(1979) also observed that much higher phosphorus
removal can occur in wastewater which contains high
concentrations of calcium ion. However, Milamoto-Mills et
al. (1983), and Gerber and Winter (1984) find no significant
variation in calcium concentration when the wastewater passes
potential (ORP) between anaerobic and aerobic phases
contributes to phosphorus removal. They report that calcium,
magnesium and iron (potentially contained in the enzyme layer
on the exterior of cells) solubilize during the anaerobic
phase because of the low ORP; these reactions cause the
phosphorus release. During the aerobic phase, these ions
precipitate inorganic phosphorus because of the high ORP.
Other researchers contend that both biological and
chemical precipitation mechanisms are involved in phosphorus
removal, especially when removals below 1 mg/1 are obtained
(Barnard, 1983; Lan, et al., 1983; Fukase,et al., 1984).
However, Lan et al. point out that for systems operating at
high pH (pH>8), the precipitation of phosphorus by calcium or
other metals can represent the most important mechanism.
Arvin (1983) proposes that under anaerobic conditions,
biological phosphorus release can initiate and accelerate
phosphate precipitation. Therefore, chemical precipitation of
Technology of Sequencing Batch Reactor (SBR)
(1) Description of System
TheSBR is a fill-and-draw activated sludge system,which
may be composed of two or more tanks to accommodate a
continuous inflow of wastewater. Five discrete operating
periods occur for each cycle - FILL, REACT, SETTLE, DRAW, and
IDLE.
FILL is the period of receiving raw waste with mixing
and/or aeration to provide distinct, selective growth
conditions for microbial biomass (Manning,1985). The REACT
period follows and completes desired reactions by holding and
aerating contents of the full tank. SETTLE is the period in
which the biomass is allowed to flocculate and settle under
quiescent conditions for a predetermined time. This is
followed by the DRAW period, in which the treated effluent is
decanted to the design minimum liquid volume level. The IDLE
period is used for awaiting resumption of the influent
wastewater flow to refill the tank and start another cycle.
(2) Historical Perspective
SBR is the precursor to modern day continuous flow
activated sludge technology. In 1914, Ardern and Lockett
substrate-adapted organisms for efficient treatment. However,
this early fill-and-draw activated sludge system was neverapplied to any great extent because of the lack of suitable
aeration equipment to prevent plugging with stop-startoperation, the unavailability of automatic valving, timing,
and switching technology and equipment, and the lack of
understanding of the biokinetic advantages of batch systems
(Mandt, 1985) .
Now new hardware devices, such as motorized valves,
pneumatically actuated valves, solenoid valves, flowmeters,
level sensors, automatic timers, and process controllers or
microprocessors,have been developed and are available (Arora
et al., 1985). These improvements provide the capability for
SBR technology to reach its full potential. EPA has been
re-evaluating SBR technology since the early 1980s. During
the past decade, researchers at the University of Notre Dame
have demonstrated the strong potential of SBR for energysavings and reliable operation. Nevertheless, the lack of
widely accepted design standards has delayed application of
SBR technology. A full scale demonstration plant at Culver,
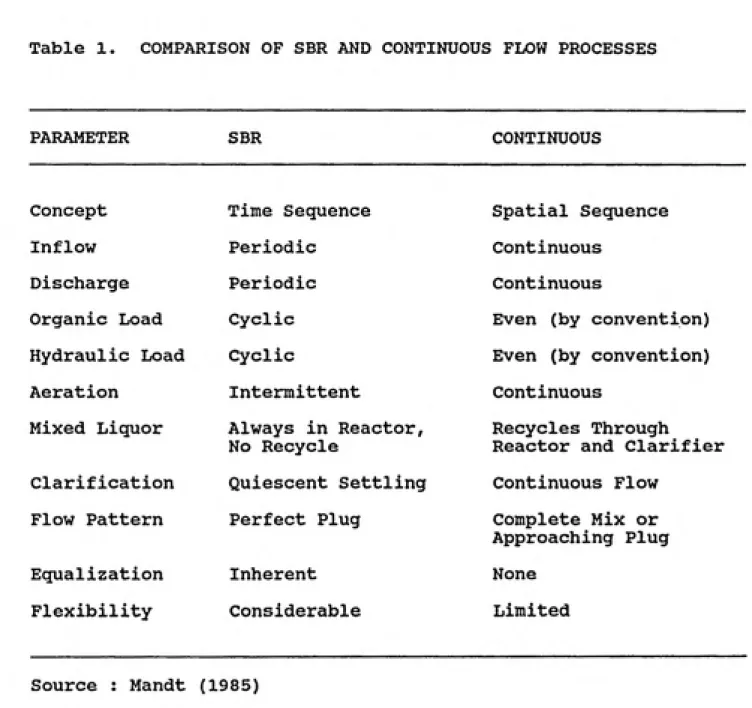
(3) COMPARISON OF SBR AND CONTINUOUS FLOW PROCESSES
Conceptually, SBR involves timed unit processes which all
occur sequentially within the same vessel. A continuous flow
system involves specially related unit processes. Mandt
(1985) compared SBR and continuous flow parameters in a way
similar to Table 1.
(4) Advantages of SBR
Based on the evaluations by Arora et al.(1985) and Mandt
(1985), the advantages of SBR are:
a) Flow equalization is inherent, therefore, SBR can control
flows and organic shock loads within the constraints of
reactor volume and oxygen supply.
b) The phases of SBR can be modified, within limits, to
attain the desired effluent quality.
c) No return sludge pumping and secondary clarifiers are
required.
d) Solid-liquid separation occurs under nearly ideal
quiescent conditions.e) During the initial REACT period the oxygen utilization
capacity of organisms will generally exceed the transfer
Table 1. COMPARISON OF SBR AND CONTINUOUS FLOW PROCESSES
PARAMETER SBR CONTINUOUS
Concept Inflow Discharge Organic Load Hydraulic Load Aeration
Mixed Liquor
Clarification Flow Pattern EqualizationFlexibility
Time Sequence
Periodic Periodic Cyclic Cyclic IntermittentAlways in Reactor,
No Recycle
Quiescent Settling
Perfect Plug Inherent ConsiderableSpatial Sequence
Continuous ContinuousEven (by convention)
Even (by convention)
Continuous
Recycles Through
Reactor and Clarifier
Continuous Flow
Complete Mix or
Approaching PlugNone
Limited
oxygen transfer efficiency can be achieved by the greater
driving gradient from an anoxic FILL to an aerobic REACT
period.
f) Filamentous growth can be easily controlled by varying
the operating strategies during FILL. Floe forming organisms
are more capable of storing substrate during anoxic periods
than filamentous organisms.g) SBR can be operated to achieve phosphorus removal,
nitrification, or denitrification.(5) Biological Phosphorus Removal in SBR
As suggested by Manning and Irvine (1985), the
flexibility of SBR seems ideally suitable for biological
phosphorus removal. They state that phosphorus release is
hastened by the presence of soluble COD during anaerobic
periods but also depends on the prior removal of oxidized
nitrogen from the system. They also observe that the mode of
operation can greatly affect sludge settling characteristics;
however, excellent biological phosphorus removal can be
obtained during periods of high sludge volume index (SVI>500
ml/g).
aerobic conditions for biological phosphorus removal without
any chemical addition. They propose that four major groups
of organisms are involved in the SBR biological phosphorus
removal: denitrifying organisms, fermentation
product-manufacturing organisms, phosphorus-accumulating organisms,
and aerobic heterotrophs and autotrophs.
Anaerobic conditions favor the fermentation
product-manufacturing organisms to use organics in the incoming
wastewater and produce by-products such as biodegradable
acetic acid. Meanwhile, phosphorus-accumulating organisms
release stored poly-P to provide energy for accumulating
these by-products. The subsequent aerobic conditions allow
phosphorus-accumulating organisms to use storage products for
growth and providing energy to take up the phosphorus in
solution as intracellular poly-P. Further treatment is
achieved by aerobic autotrophs and heterotrophs using
residual substrate. In the next FILL cycle, these organisms
are prepared to release poly-P and store by-products during
EXPERIMENTAL DESIGN
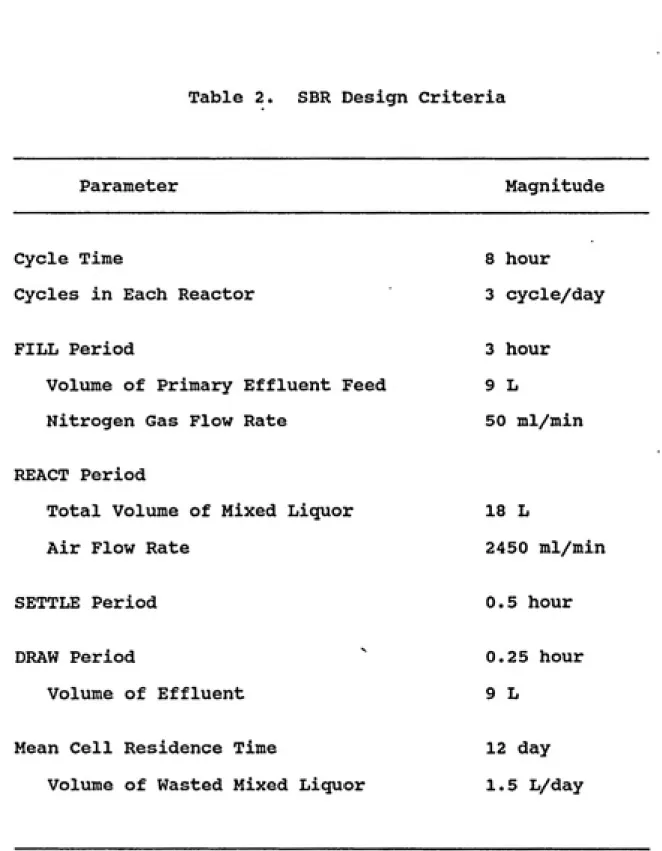
Design Criteria
Since there are no widely known standards for SBR design,
the SBR design in this study was based on other SBR studies,
which were not shown here, and the suggestions given by Arora
et al. (1985). In this study, four reactors were operated
parallel and an 8-hour operating cycle was used, with a
3-hour FILL period (anaerobic phase), 4.25-3-hour REACT period
(aerobic phase), 0.5-hour SETTLE period, and 0.25-hour DRAW/
IDLE period.
During the FILL period, wastewater, sodium acetate,and
nitrogen gas were fed continuously into the reactors, and
mixers were used to provide adequate mixing. Nitrogen gas
was provided to hasten and insure anaerobic environment for
denitrification and phosphorus release. The sodium acetate
was added as substrate according to suggestions by Manning
(1985), Letter (1985), and Gerber (1986). At the end of the
FILL period, wastewater, sodium acetate, and nitrogen gas
were stopped and air was provided for the REACT period.
Nitrification and phosphorus uptake happened during the REACT
period, and mixed liquors were wasted near the end of this
period. The volume of wasted mixed liquor is equal to the
total volume of mixed liquor (18 liters) divided by mean cell
During the last five minutes of REACT period, different
dosages of alum were added to three of the reactors while no
alum was added to the control unit, representing a BPR
activated sludge system. After the five minutes, the alum
feed, air, and mixer were stopped for SETTLE period. After
SETTLE period, each reactor drained out one half of the total
volume of mixed liquor as effluent (9 liters). The SBR
Table 2. SBR Design Criteria
Parameter Magnitude
Cycle Time
Cycles in Each Reactor
FILL Period
Volume of Primary Effluent Feed
Nitrogen Gas Flow Rate
REACT Period
Total Volume of Mixed Liquor
Air Flow Rate SETTLE Period
8 hour
3 cycle/day
3 hour
9 L
50 ml/min
18 L
2450 ml/min
0.5 hour
DRAW Period
Volume of Effluent
Mean Cell Residence Time
Volume of Wasted Mixed Liquor
0.25 hour
9 L
12 day
Four 33.7 liter (total volume) stainless steel cylindrical
tanks, as shown in Figure 1, were used for the reactors. Each
tank was 10 inches in diameter and 3 0 5/8 inches high. The
bottom 8 inches were sloped at 2:1 to form a cone which
helped prevent sludge accumulation.
(1) Feed
Effluent from the primary clarifier of the Mason Farm
Wastewater Treatment Plant at Chapel Hill was pumped into the
laboratory continuously. This was the wastewater influent to
the laboratory SBR systems. The actuation of all feed pumps
(influent, acetate, and alum) was controlled by a timer. A
TECHNICON proportioning pump was used to feed sodium acetate
at a low flow rate (0.32 ml/min). MASTERFLEX pump heads,
variable speed drives, and solid state speed controllers were
used for the influent and alum feed flows. MASTERFLEX tubing
was used in the pump heads and TYGON tubing was used for all
other liquid and gas lines. All feeds were added through
funnels fixed on top of the reactors; PVC pipes extended
into the tanks to prevent the splashing of feed causing air
FIGURE 1. DIAGRAM OF SBR REACTOR
4- 10' -*
yUf^A/EL
6eARM0TDK
7rj/w/ium
TM?eU.&i
TLASTIC
* STYR.opo4^i
COVER,
*• ^Ti^KJVPxrB
f^^T (.TO pp/ij^ ^i^P^
(2) Gas
The conical bottoms of each tank contained three outlets,
one of them was used as a gas port which was connected to a
gas line receiving either air or nitrogen gas. The gases
were filtered by GILMONT No. 12122 0.2 urn autoclavable mini
capsule filters. The flow rates of nitrogen gas were
measured with GILMONT No.11 compact flowmeters and air flows
were measured with MANOSTAT 36-54 6-215 flowmeters. The air
and nitrogen flows were turned on or off by DAYTON 6X543
solenoid valves actuated by timers. Styrofoam covers were
used on the liquid surface in each reactor to reduce oxygen
transfer from the atmosphere.
(3) Mixing
Shafts and impellers, connected to DAYTON 200 rpm
gearmotors, were used to provide mixing during anaerobic and
aerobic phases. Nitrogen gas and air also provided additional
mixing during anaerobic and aerobic phases, respectively. All
the mixing was turned off by a timer-actuated relay during
SETTLE and DRAW periods.
(4) Discharge
The other two holes on the bottom of each cone were used
the other was connected to the drain pump from the standpipe.
The samples were withdrawn manually while drain pumps were
controlled by timers. The volume of effluent from each tank,
controlled by a standpipe in the reactor, was designed to be
9 liters out of 18 liters total liquid volume. Note that the
IDLE period was included in the DRAW period, which is 15
minutes, in this experiment. The system flow schematic is
illustrated in Figure 2.
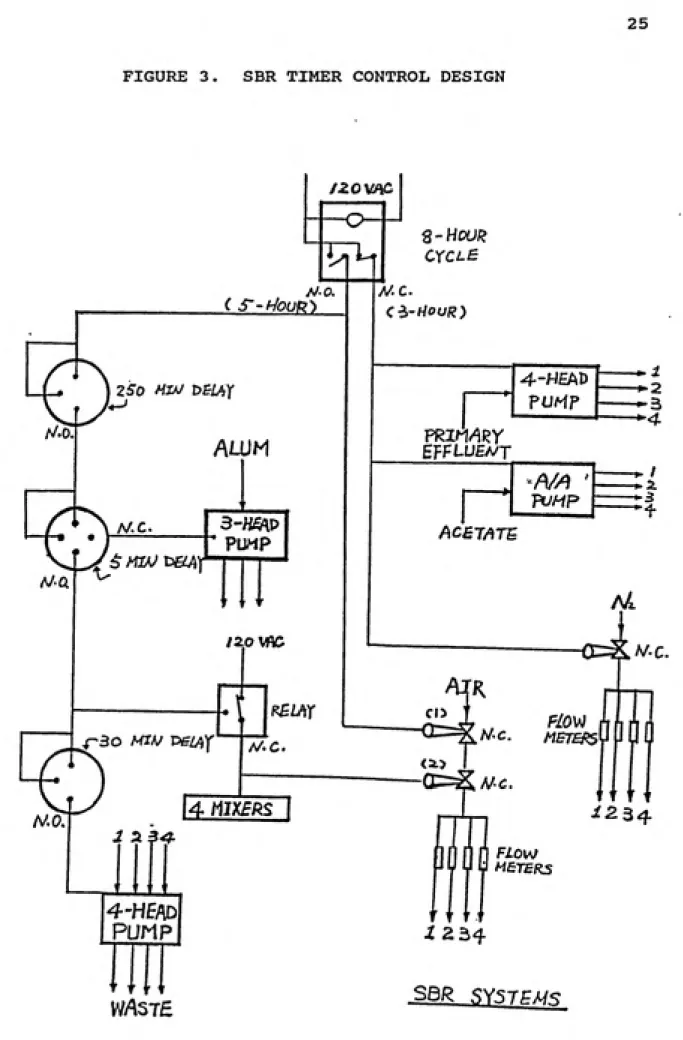
(5) Timer control
A DAYTON 2E026 24-hour program time switch was used as
the main timer to control the 8 hour repeating cycle, with 3
hours normally closed (N.C.) for the FILL period and 5 hours
normally open (N.O.) for the rest of the cycle, as shown in
Figure 3. Cycles started at 8:00 AM, 4:00 PM, and 12:00
midnight.
During the 3 hour FILL (anaerobic) period, the influent
and acetate pumps were actuated by the normally closed
circuit. The normally-closed solenoid valve connected to the
nitrogen gas tank was actuated to open. Meanwhile, the
motor mixers and the second normally-closed solenoid air
valve controlled by a relay were actuated through the
separate closed relay. Since the first
normally-closed solenoid air valve connected to the air source was not
LE6^fJZ> •
M HoroR HIKER,
/ll-PH ALUM yuH? UtAO
Al-PT A<:t7/lr£ Pt/Mp TUBE
C'l^/Jr/;*
!---f'-nr
i»»mM^^m\
i^Hx-t—m-^
41-PW
/TO"
ͣ
^CEViTE-J
OKAlf^
.L^g)_©_J
/ll-p<U
/^/.UM
lilKlUi
SAHrm
V/lLV£S
H/'fW
/^Ly/M /^c-gr^Te
1—(i^
S/iMni4---^
FIGURE 3. SBR TIMER CONTROL DESIGN
/ZOVflP
^
//ͣa
ALUM
A/.O.©
MC.A/, a
" PUMP
' T ͫ
/20WC
^30 MlhJ T>eiAX
^lAX
MC.
UnmRs (
i 2 5^4-Hf/\D
PUMPT t f
WAst£
S-Hdur CYCLE MC. 4--WEAD PUMP EFFLLI£A/T Pl/MP AC£T/»Te -^2 -*4 FlOVif^C. MBTEf!5
i234
FZOlV
fl MET£R3
XZh^
After 3 hours, the normally closed circuit of the main
timer switched off and the normally open circuit was actuated,
terminating the influent, acetate, and nitrogen gas feeds.
Meanwhile, a 5 hour delay timer, set at 250 minutes, was
actuated, and the first air valve was opened for the REACT
(aerobic) period. After 250 minutes, the normally-open
contacts of the delay timer closed and the alum feed pump was
activated through the normally-closed contacts of a 15
minutes timer, set at 5 minutes. After 5 more minutes, the
alum pump stopped and a 30 minute delay timer, set at 30
minutes, was actuated for the SETTLE period. At the same
time, the 120 VAC relay was switched to open, stopping the
mixers and closing the second air valve. After 30 minutes,
the drain pumps were actuated by the 30 minute timer for the
DRAW period to drain treated effluent. At the end of 15
minutes, DRAW period, another entire cycle was started by
activating (closing) the normally closed circuit on the main
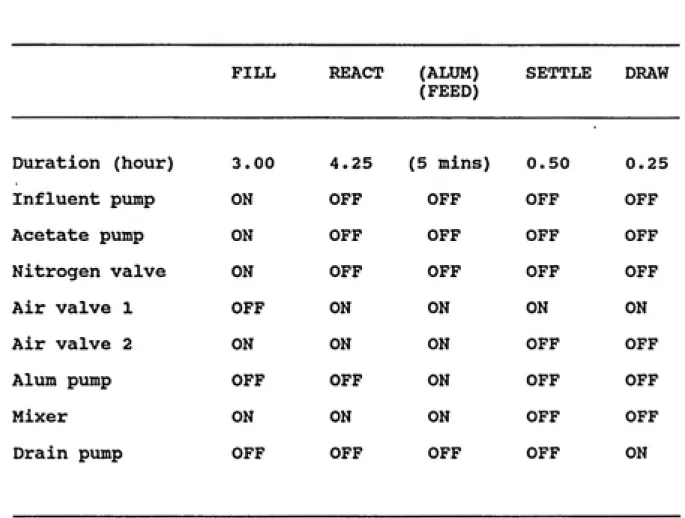
time switch. The status of pumps, valves, and mixers during
each SBR period are illustrated in Table 3.
All timers described above are CRAMER 472A-E reset timers
wired to reset upon opening switch supplying power to the
timer. These timers all reset upon opening of the normally
open circuit of the 24 hour main time switch. A SOLA 1200-A
standby power source was provided to prevent undesired timer
Table 3. APPARATUS STATUS DURING SBR PERIODS
FILL REACT (ALUM) (FEED)
SETTLE DRAW
Duration (hour)
Influent pump
Acetate pump
Nitrogen valve
Air valve 1 Air valve 2
Alum pump
Mixer
Drain pump
3.00 4.25 (5 mins) 0.50 0.25
ON OFF OFF OFF OFF
ON OFF OFF OFF OFF
ON OFF OFF OFF OFF
OFF ON ON ON ON
ON ON ON OFF OFF
OFF OFF ON OFF OFF
ON ON ON OFF OFF
Experimental Stages
This study was divided into four experimental stages to investigate the effects of alum additions under different
conditions.
(1) Start up
Initially, each reactor was filled with nine liters of
mixed liquor. Five of nine liters were collected from the
Mason Farm Plant's aeration basin and the other four liters
were from other pilot units that were successfully removing
phosphorus biologically. The reactors were started in the
anaerobic phase. A performance testing stage was used to
test the similarity between reactors under the same operating
conditions. No alum was added until similar results were
reached in these four reactors. The data for this stage is given in Appendix A-1. After the performance testing stage,
reactor #1 was chosen as the control unit, which received no
alum additions. Reactors #2, #3, and #4 received 26, 52, and
104 mg/1 of alum (AI2(SO^)3 *14H20), respectively. These doses
would have been enough to precipitate 2, 4, and 8 mg/1 of
dissolved phosphorus (based on an Al:P weight ratio of
1.2:1), if that much were left at the end of the aerobic
phase. Note that the alum dosage of reactor #4 was more than
(2) Favorable BPR stage - Stage I
During the period December 10, 1986 to January 13,
1987 (day 7-41), the units were provided sodium acetate feed
of 40 mg/l carbon (favorable BPR condition) to investigate
the effects of alum additions under this condition.
(3) Unfavorable BPR stage - Stage II
From January 14 to February 11, 1987 (day 42-70) the units were not provided acetate feed (unfavorable BPR condition) to investigate the effects of alum additions under this condition. Sodium bicarbonate (50 mg/l CaC03) was
provided to raise the alkalinity level because significant drops of pH levels were observed after the discontinuing the acetate feed. The sodium bicarbonate feed was added during the anaerobic phase using acetate pump for convenience.
(4) Partially favorable BPR stage - Stage III
From February 23 to April 2, 1987 (day 82-120) the
units were provided sodium acetate feed of 15 mg/l carbon and same strength of sodium bicarbonate as in stage II. This stage was used to investigate the effects of alum additions under this partially favorable BPR condition. The strength of
15 mg/l carbon was determined by changing the concentration
of acetate feed to the control unit after the end of stage II
and testing effluent orthophosphate (P04-P) concentration by
adjusted until the effluent P04-P concentration was on the
margin of 1 mg/1 limit to investigate the optimal strength of
acetate feed for BPR. The operation conditions and data are
Experimental Methods
(1) Maintenance
a) Sodium acetate (21.35 g/1) was prepared in a one liter
reagent bottle for each reactor. It was made fresh every 5
days.
b) Alum was prepared in a one liter reagent bottle for each
alum unit (0.43, 0.85, and 1.70 g/1 Al for reactors #2, #3,
and #4, respectively). It was made fresh every 6 days.
c) The compressed nitrogen gas cylinder was replaced every
10 days.d) The pump tubes of the Autoanalyzer (acetate feed pump)
were replaced once a month.
e) Mixed liquor was wasted everyday near the end of the
aerobic phase, before the alum feed.
g) Air flow rates were adjusted to maintain approximately 5
mg/1 of dissolved oxygen (DO) concentrations at the end of
the aerobic phase.
f) Equal amounts of sodium acetate and alum were added to
each reactor and monitored by the marked reagent bottles.
The walls of each reactor were marked to indicate volumes;
water levels of the reactors were monitored by observing
(2) Sampling
a) Unfiltered influent samples were grabbed once a week and
preserved by adding concentrated sulfuric acid to pH less
than 2 for total phosphorus (TP) and total Kjeldahl nitrogen
(TKN) analyses. Filtered samples were collected twice a week
and filtered through WHATMAN GF/F glass microfiber filters
for orthophosphate (P04-P), ammonia nitrogen (NH3-N), and
oxidized nitrogen (NOx-N) analyses.
b) Anaerobic phase mixed liquor samples were collected twice
a week, 15 minutes before the end of the FILL period. After
being centrifuged and filtered, they were frozen until P04-P,
NH3-N and NOx-N analyses were run.
c) Aerobic phase mixed liquor samples were collected twice
a week, 15 minutes before the end of the REACT period. The
same procedure and analyses were conducted as for anaerobic
samples.
d) Effluent samples were collected about two minutes after
the beginning of the DRAW period twice a week. It was
desirable to wait until solids in the standpipes had been
flushed out before sampling. The same procedures as for
influent samples were conducted for P04-P, NH3-N, NOx-N, TKN,
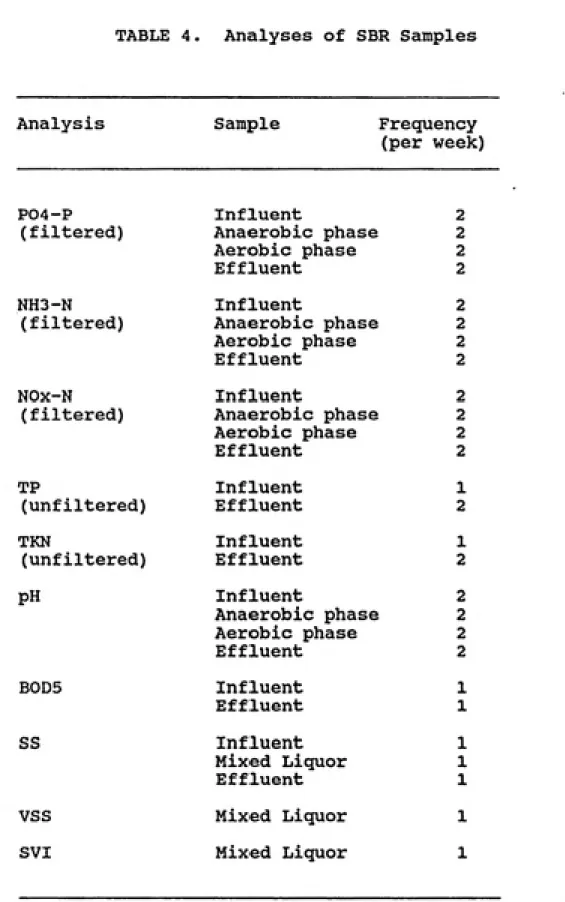
(3) Analyses
P04-P, NH3-N, and NOx-N analyses were conducted twice a week (see Table 4). TP and TKN were digested and analyzed
once a week. An ORION SCIENTIFIC auto analyzer was used for
the analysis. This included an AS-140 sampler, AP-200 peri¬ staltic pump, AR-200 recorder, and two AC-lOO colorimeters
and combination analytical cartridges. The CFA-PC data
handling system was also used to compute the data. Spiked and duplicate samples were used in each analytical run for
quality control. Analyses were performed according to the
Orion Scientific Instruments Manual. These were based on the methods approved by EPA (1979) and Standard Methods (1985).
The pH of influent, effluent, and mixed liquors for anaerobic and aerobic periods were measured twice a week using an ORION 701A digital pH/mV meter. The concentrations of BODS of the influent, effluent, and sodium acetate feed were determined once a week following the procedure in
Standard Methods (1985), part 507, including nitrification
inhibition. The dissolved oxygen (DO) levels were measured with a WESTON and STACK 330 Dissolved Oxygen Analyzer. The DO
concentrations were checked during the anaerobic phase, but
this measurement was terminated after two weeks because of
TABLE 4. Analyses of SBR Samples
Analysis Sample Frequency (per week) P04-P (filtered) Influent Anaerobic phase Aerobic phase Effluent 2 2 2 2 NH3-N (filtered) Influent Anaerobic phase Aerobic phase Effluent 2 2 2 2 NOx-N (filtered) Influent Anaerobic phase Aerobic phase Effluent 2 2 2 2 TP (unfiltered) Influent Effluent 1 2 TKN (unfiltered) Influent Effluent 1 2 PH Influent Anaerobic phase Aerobic phase Effluent 2 2 2 2 BODS Influent Effluent 1 1 SS Influent Mixed Liquor Effluent 1 1 1
VSS Mixed Liquor 1
Suspended solids (SS) and volatile suspended solids (VSS)
concentrations were deteirmined according to Standard Methods,
part 209 C and D using WHATMANGF/C glass microfiber filters.
The suspended solids of influent, effluent, and mixed liquor
were measured once a week. The sludge volume index (SVI) was
RESULTS AND DISCUSSION
Influent Characteristics and Operating Conditions
The system influent was the primary clarifier effluent
of the Mason Farm Treatment Plant. The average concentrations
and standard deviations of its various constituents for each
stages are summarized in Table 5. The system influent in
this study contains 80 mg/1 SS, 110 mg/1 BODS, 30 mg/1 TKN,
17 mg/1 NH3-N, and 5 mg/1 TP, and could be classified as a
weak wastewater. The average temperature of the system
influent was low, 15°C, through the period of this study.
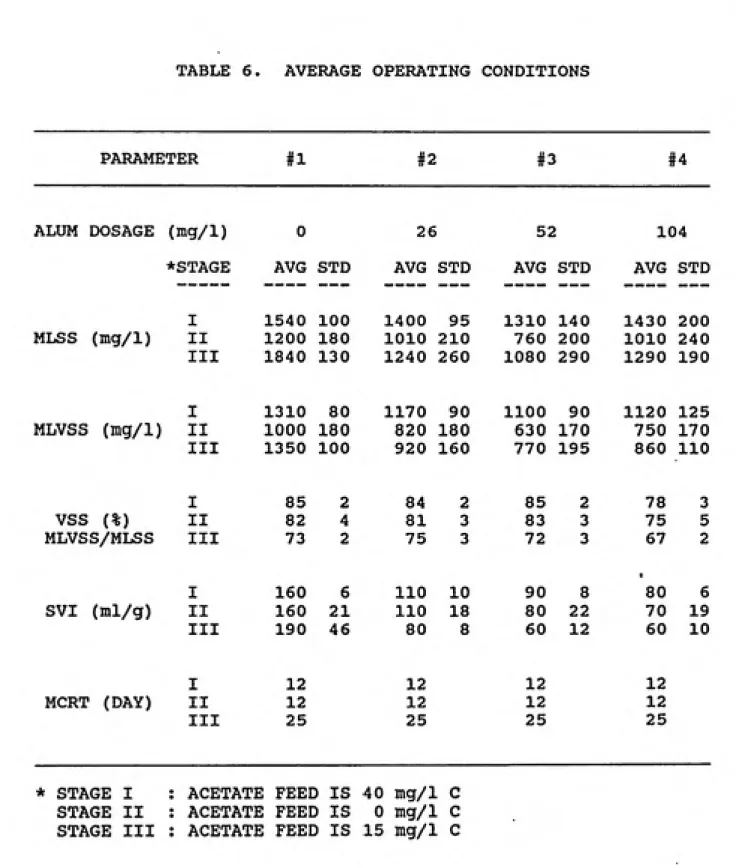
The average levels of mixed liquor suspended solids (MLSS), as shown in Table 6, seem in the same range for all units in Stage I (1310-1540 mg/1). Lower levels of MLSS (760-1200 mg/L) were observed in Stage II, especially reactor #3,
as illustrated in Figure 4. Because of the low levels of
MLSS in Stage II, the MCRT was increased in Stage III from 12
days (the MCRT of Stages I and II) to 25 days to increase the MLSS levels in Stage III. However, only reactor #1 showed
significant increase of MLSS levels in Figure 4.
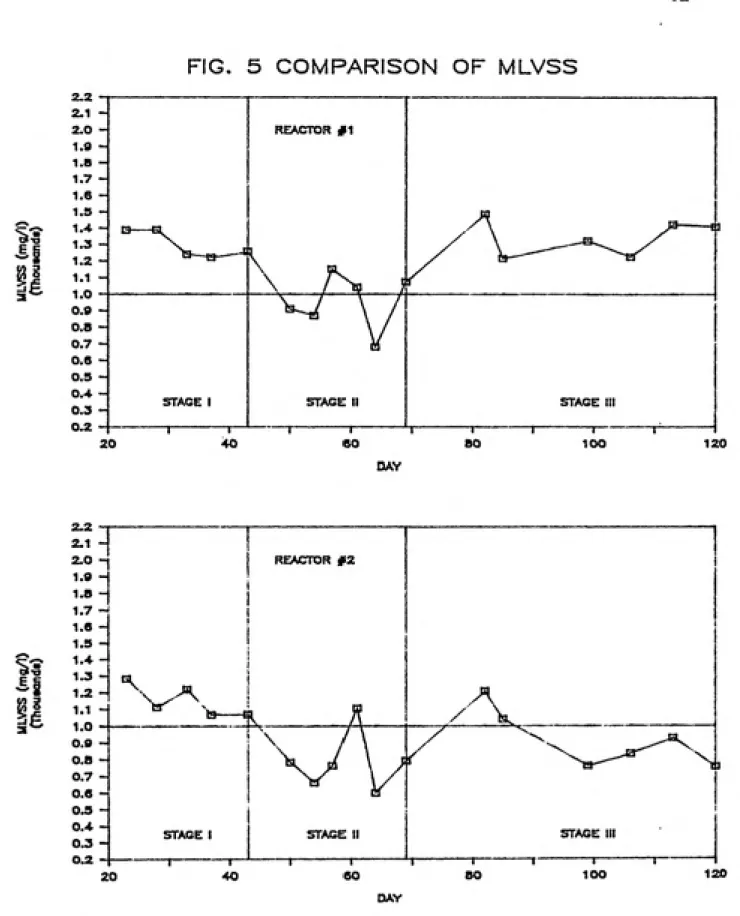
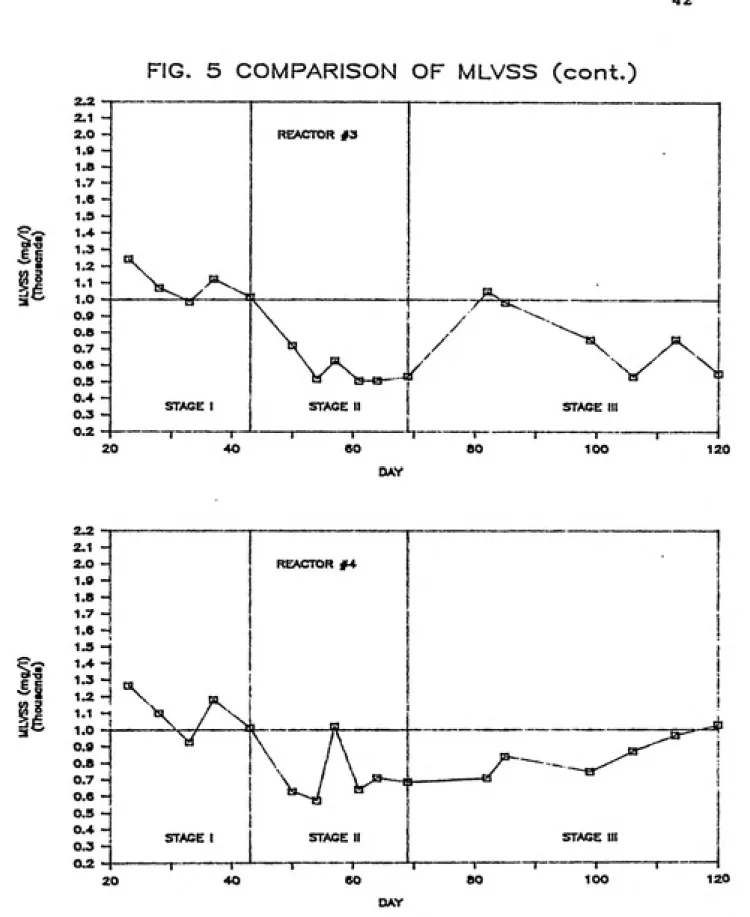
The levels of MLVSS also showed the similar trend as MLSS did, as shown in Table 6 and Figure 5. Since the bound
TABT.E 5. AVERAGE CHARACTERISTICS OF SYSTEM INFLUENT+
PARAMETER T* I II III
pH AVG 7.2 7.3 7.3 7.1
STD 0.1 0.1 0.1 0.1
NH3-N AVG 16.8 16.6 17.0 16.0 STD 4.8 4.8 4.6 4.6
NOX-N AVG 0.2 0.1 0.2 0.2
•
STD 0.2 0.1 0.2 0.2P04-P AVG 3.1 3.1 2.7 3.3
STD 1.0 1.1 0.9 0.7
TP AVG 5.4 5.3 5.3 5.5 STD 1.5 1.8 1.4 0.7
TKN AVG 28 24 30 27
STD 7 8 6 4
BODS AVG 113 109 93 141 STD 27 19 25 16
SS AVG 81 67 79 86 STD 30 23 17 28
+ ALL VALUES EXCEPT pH ARE EXPRESSED IN mg/1
TABLE 6. AVERAGE OPERATING CONDITIONS
PARAMETER #1 #2 #3 #4
ALUM DOSAGE (mg/l) 0 26> 52 104
*STAGE AVG STD AVG STD AVG STD AVG STD
I 1540 100 1400 95 1310 140 1430 200
MLSS (mg/l) II 1200 180 1010 210 760 200 1010 240 III 1840 130 1240 260 1080 290 1290 190
I 1310 80 1170 90 1100 90 1120 125
MLVSS (mg/l) II 1000 180 820 180 630 170 750 170 III 1350 100 920 160 770 195 860 110
I 85 2 84 2 85 2 78 3
VSS (%) II 82 4 81 3 83 3 75 5
MLVSS/MThSS III 73 2 75 3 72 3 67 2
I 160 6 110 10 90 8
1
80 6
SVI (ml/g) II 160 21 110 18 80 22 70 19
III 190 46 80 8 60 12 60 10
I 12 12 12 12
MCRT (DAY) II 12 12 12 12
III 25 25 25 25
* STAGE I STAGE II STAGE III
ACETATE FEED IS 40 mg/l C
E i
FIG.4 COMPARISON OF MLSS
REACTOR #1
i
STAGE I STAGE II STAGE III
120
DAY
REACTOR §2
STAGE III STAGE t
STAGE I
120
1^
FIG.4 COMPARISON OF MLSS (cont.)
FIG. 5 COMPARISON OF MLVSS
o
g
REACTOR #1
STAGE I STAGE II STAGE III
120
DAY
REACTOR #2
STAGE ill
STAGE II STAGE
120
FIG. 5 COMPARISON OF MLVSS (cont.)
2.2 2,1 2.0 1.0 1.8 1.7 1.6 1.S 1.4 1.3 1.2 1.1 1.0 0.9 0.8 0.7 0.6 0.5 0.4 0.3 0.2"V.
20^^
,<ia^ STAGE I —T-40 REACTOR #3 STAGE II —T-60^\/\^^-y
._Ah^-/ STAGE III n----80 —r — 100-j
120 DAY REACTOR #4STAGE I STAGE II STAGE III
120
test (103°C) until in the MLVSS test (550°C), the organic,
MLVSS levels of the alum units in this experiment were lower than the levels shown in Table 6. In another experiment (not shown here), 15 to 2 0 percent of weight of alum precipitate
at 103°C was lost upon determining VSS at 550°C.
It is unclear why reactor #3 showed significant lower levels of MLSS and MLVSS in Stage II, and why only the
control unit (reactor #1) showed significant increase of MLSS and MLVSS from the increase of MCRT in Stage III. The turbid effluents in reactor #3, as shown in Table 7, might explain
the lowest levels of MLSS in reactor #3. However, from the excellent BOD removals (96-99%) for all units in Table 8, the increase of turbidity in reactors #3 and #4 did not result in a proportional increase in effluent BODS concentrations. This suggests that most of the effluent solids in the alum units
may be inorganic solids. Therefore, the significant lower
levels of MLVSS in reactor #3 may not be due to the wash out of the organic solids in turbid effluents, and more studies need to be conducted. The detailed effluent suspended solids and BOD data may be found in Appendix A-5.
According to Table 7, the effluent suspended solids concentrations generally increased when more alum was added.
TABLE 7. AVERAGE EFFLUENT SUSPENDED SOLIDS PERFORMANCE
PARAMETER STAGE FEED #1 #2 #3 #4
ALUM DOSAGE 26 52 104
(mg/1)
I AVG 74 7 9 19 16
STD 23 2 1 2 6
SS (mg/1) II AVG 79 9 10 25 22
STD 17 2 4 9 4
III AVG 86 6 12 24 15
STD 28 2 4 7 3
I AVG ^
91 89 76 81
REMOVAL (%) II AVG
-90 88 73 75
TABLE 8. AVERAGE BIOCHEMICAL OXYGEN DEMAND PERFORMANCE
PARAMETER STAGE* FEED+ #1 #2 #3 #4
ALUM DOSAGE
,,f;: .
0 26 52 104
(mg/l)
I AVG 175 2 3 2 1
STD 19 1 <1 1 1
B0D5 (mg/l) II AVG 93 3 3 3 2
STD 25 1 1 1 1
III AVG 166 3 4 4 3
STD 16 1 1 <1 1
I AVG ^
99 98 98 99
REMOVAL (%) II AVG
-97 96 97 98
III AVG 98 97 97 98
+ FEED BODS = PRIMARY EFFLUENT BODS + ACETATE FEED BODS
observation is unclear. Turbid effluents from alum units
have also been observed by Barth (1967), and Gray (1976).
Perhaps, a brief period of gentle agitation prior to solids separation should be used, as suggested by EPA (1976), to
promote flocculation and prevent the chemical floe from
disintegrating by mixing. The excellent performance of
suspended solids removal for the control unit has also been shown at the full-scale SBR plant in Culver, Indiana (1985).
In Table 6, significant drops of the average percentages
of mixed liquor volatile suspended solids (VSS) were observed in Stage III (67-75%) compared with Stages I and II (75-85%),
as shown in Figure 6. The lower VSS percentages in Stage III
may due to the longer MCRT, in spite of increased acetate feed, because the higher MCRT leads to more endogenous respiration. If the bound water in aluminum hydroxide is excluded, the percentages of VSS in the alum units would be even lower. Therefore, the VSS percentages in reactors #2
and #3 actually might be lower than the control unit. The reason for the lowest percentage of VSS of reactor #4 in all
stages is not clear, but it might be because the greatest
dosage of alum was fed into reactor #4.
FIG.6 EFFECT OF MCRT ON VSS
90
I/)
88
-86
84 H
82
80 H
78 76 74 72 70 -68 66
64
62 -60
^
2 DAY. Ac-40 mg/l C
II: MCRT-12 DAY. Ac- 0 mg/l C
III: MCRT-25 DAY. Ac-15 mg/l C
~1---r 20 #2 40
T---T-#3 60 80 10idi*^ 120
were obtained in the alum units, as shown in Table 6. These
have also been observed by Eberhardt and Nesbitt (1968),
Barth and Ettinger (1967), and Finger (1973). The effect may
be caused by an increased sludge density or more effective
Effect of Alum Additions on Phosphorus Removal (1) Phosphorus Removal by the Control Unit
The data in Table 9 show that the control unit removed
93, 69, and 83 percent of total phosphorus in Stages I, II, and III, corresponding to acetate additions of 40, 0 and 15 mg/1 carbon, respectively. This result suggests that the strength of acetate feed may be important to BPR. When the acetate feed was discontinued in Stage II, the percentage of TP removal dropped from 93 to 69 percent. In Stage III, the acetate feed was subsequently resumed at one third of the
strength in Stage I, TP removal increased to 83 percent. The importance of acetate on biological phosphorus removal has
also been observed by other researchers (Chiesa, 1986; Gerber,
1986).
Since effluent TP concentrations did not be measured
until day 30, the variation of effluent TP in Stage I, as
shown in Figure 7, can be hardly compared with the other two
stages. If P04-P concentrations at the end of aerobic phase
were used to show the performance of phosphorus removal, as
illustrated in Figure 8, the control unit showed constant low
effluent P04-P in Stage I, constant higher P04-P in Stage II,
and large variations of P04-P in Stage III. Although the
reason for the bigger P variations in Stage III, as shown in
TABLE 9. PHOSPHORUS REMOVAL BY THE CONTROL UNIT
STAGE
PARAMETER I II III
ACETATE ADDITION
(mg/l C) 40 0 15
FEED
TP (mg/l) AVG 5.3 5.3 5.5
STD 1.8 1.4 0.7
EFFLUENT
TP (mg/l) AVG 0.4 2.1 1.4
STD 0.2 0.7 1.3
FIG.7 EFFLUENT TP OF THE CONTROL UNIT
E
43
2
FIG.8 ORTHO-P OF THE CONTROL UNIT
E a. I
4-1
3 -i
2 -J
AT THE END OF AEROBIC PHASE
STAGE I STAGE II
N
\
!(
V
4
\
ͤ
B(---^^^-H—H p---X
10 30
feed was added, the more constantly good P removal was observed. therefore, the importance of acetate feed on BPR can be assured.
When the low average P-release (4.1 mg/l) during the
anaerobic phase was observed in Stage II, as shown in Table
10, poor aerobic P-uptake during the aerobic phase was
observed. This suggests that low P-release during anaerobic
phase could predict poor P-uptake during the aerobic phase. However, when the same range of average P-release during
anaerobic phases were observed (13.4 and 12.7 mg/l in Stages I and III, respectively), the P04-P concentrations at the end
of aerobic phases were significantly different (0.1 and 1.6
mg/l in Stages I and III, respectively). The difference in
P-uptake performances suggests, that high range of P-release
during anaerobic phase does not necessarily guarantee good
P-uptake during aerobic phase and that other factors must be
involved.
For good phosphorus removal, a ratio of BODS to TP
greater than 20 to 25 has been suggested by Tetreault et
al.(1986). The average ratios in these experiments were 37, 17,
and 31 during the three stages, respectively (see Table 10).
TABLE 10. PHOSPHORUS PERFORMANCE OF THE
CONTROL UNIT AT THE END OF ANAEROBIC AND AEROBIC PHASES
STAGE
PARAMETER I II III
ACETATE ADDITION
(mg/l C) m 0 15
ANAEROBIC PHASE
P04-P (mg/l) AVG
STD
13.4 5.2
4.1 12.7 1.5 4.8 AEROBIC PHASE
P04-P (mg/l) AVG
STD
0.1 0.1
2.0 1.6 0.5 1.4
* FEED B0D5/TP AVG 37 17 31
* FEED B0D5 = PRIMARY EFFLUENT B0D5 +
Stage I. In these two stages, the phosphorus loadings were similar (5.3 and 5.5 mg/1, see Table 9) and feed BOD concentrations were also similar (175 and 166 mg/1, see Table 8). The only clear difference is that higher strength of
acetate feed was provided in Stage I (40 mg/1 carbon) than
in Stage III (15 mg/1 carbon). The better BPR performance with higher acetate feed in Stage I suggests that the concentration of acetate may play a more important role on on BPR than
the strength of wastewater. It is also shown in the study of Gerber et al. (1986) that acetate promotes more phosphorus removal than does glucose addition at the same equivalent COD
concentration.
However, the longer MCRT in Stage III may or may not
affect the phosphorus removal performance. If the longer MCRT
is not favorable to phosphorus-accumulating organisms, the acetate strength of 15 mg/1 in Stage III may be enough to
(2) Phosphorus Removal by the Units Receiving Alum
Significantly low average P-releases during the anaerobic phases in Stage II, as shown in Table 11 and Figure 9, were
observed in the alum units as well as the control unit.
This suggests that acetate plays an important part on P-release in the alum units, as well as in the control unit. Significant
average P-releases were observed in the alum units during
anaerobic phase (5.8-10.5 mg/1) in Stages I and III. The more
alum added,the lower theobservedP04-P releasein all stages, but the effect of alum additionson suppressing P-release is
less drastic than the discontinuity of acetate feed in Stage II.
The lower average P04-P concentrations during anaerobic phases in the alum units could be caused by precipitation or
adsorption of released phosphate by Al (III). However, if Al (III) precipitation or/and adsorption is responsible, one
would expect the P04-P concentrations in the liquid of the
alum units during anaerobic phase in Stage II to be much
lower because of the amount of alum present should be enough
to precipitate (or adsorb) the low phosphorus concentration
revealed by the control unit (see Table 11). The P04-P
concentrations in Stage II suggest strongly that the extent
TABLE 11. PHOSPHORUS PERFORMANCE AT THE END OF ANAEROBIC PHASES+
ACETATE
FEED STAGE FEED #1 #2 #3 #4
(mg/l C) ALUM DOSEAGE (mg/1)
0 26 52 104
40 I
0 II
. 15 III
AVG 3.1 13.4 10.1 10.5 7.1
STD 1.1 5.2 3.7 3.8 2.9
AVG 2.7 4.1 3.5 2.7 2.1
STD 0.9 1.5 1.7 1.4 1.2
AVG 3.3 12.7 10.2 8.3 5.8
STD 0.7 4.8 3.7 3.5 3.7
+ ALL VALUES EXPECT ALUM DOSAGES ARE EXPRESSED
FIG.9 EFFECT OF ALUM AND ACETATE ON P-RELEASE
15
a>
E
>^
a.
I
'I-O
0.
^
I : Ac = 40 mg/l C
STAGE III : Ac - 15 mg/l C
STAGE II : Ac - 0 mg/l C
40 *"' 60
ALUM DOSAGE (mg/l)
1---1---1---r
other factors, perhaps the interference of aluminum ions with
the mechanisms of P-release.
From Table 12, the oxidized nitrogen concentrations (NOx-N) at the end of the anaerobic phases were undetectable in all units. This verifies the truly anaerobic condition in this phase. However, these units would be anoxic at the
beginning of anaerobic phase because there would be some nitrate in sludge retained in the system. The presence of
nitrate in the anaerobic phase would inhibit P-release
(Hascoet,1985). However, the concentration of NOx-N at the end of the aerobic phase decreased with increase in alum
dosage. So, the depression of P-release in the alum units by
the inhibitory effect of nitrate would not be a reasonable hypothesis.
Both P-release and excess P-uptakes were observed in
Stages I and III, as shown in Table 11, regardless of what mechanisms caused the lower P-release in alum units. Note that reactor #3 and #4 showed good P-uptake throughout the experiment, even in Stage II, and reactor #2 showed better P removal than the control unit (reactor #1) in all stages. This suggests that the addition of alum could increase the
reliability of BPR processes and that addition of more alum
should decrease the effects of unfavorable BPR conditions
(e.g. reduction in the strength of acetate in wastewater
TABLE 12. OXIDIZED NITROGEN DATA AT THE
END OF ANAEROBIC AND AEROBIC PHASES+
#1 #2 #3 #4
ALUM DOSAGE 0 26 52 104
STAGE NOx-N (ANA.)*
I AVG 0.0 0.0 0.0 0.0
STD 0.0 0.0 0.0 0.0
II AVG 0.0 0.0 0.0 0.0
STD 0.0 0.0 0.0 0.0
III AVG 0.0 0.0 0.0 0.0
STD 0.0 0.0 0.0 0.0
NOx-N (AER.)**
I AVG 5.3 5.1 4.5 3.5
STD 2.0 1.6 1.2 1.3
II AVG 7.2 6.6 3.9 1.5
STD 1.5 1.4 1.9 0.8
III AVG 6.6 6.1 4.1 1.3
STD 1.3 1.3 0.7 0.4
+ ALL VALUES ARE EXPRESSED IN mg/1
From the literature and performance of the control
unit, the P-release in the anaerobic phase is an important
step for BPR during the aerobic phase. Since the relative
importance of BPR and alum precipitation in the alum units is
hard to identify in this study, the P-release during the
anaerobic phase was used as an indication of the activities of phosphorus-removal organisms. Considering the drop in
P-release during Stage II and resumption of P-P-release during
Stage III in all units, additions of alum seem to have no
obvious adverse effect on the activities of
phosphorus-accumulating organisms. This also can be seen from the P
removal performance of reactor #2 because the amount of alum
added in this unit is too small to account for the phosphorus removal. The addition of acetate has greater effect on the BPR performance. The detailed phosphorus performances are given in Appendix A-6 and the effluent TP concentrations may
(3) Effectiveness of Alum Precipitation
For aluminum phosphate (A1P04) precipitation, the
theoretical molar ratio of alum added per mole of phosphorus
removed is one. A molar ratio less than one would suggest a contribution from BPR. In Table 13, the molar ratios of
reactor #2, which are based on the difference of influent TP
and effluent P04-P concentrations, are less than 1.0 for all
stages (0.62, 0.85, and 0.51 in Stages I, II, and III,
respectively) demonstrating the contribution of BPR. The effluent P04-P concentrations were used to approximate
soluble phosphorus concentrations. These molar ratios were
calculated assuming no suspended phosphorus in the effluent to eliminate the interaction effect of effluent suspended solids on TP concentrations because the presence of high
phosphorus-content solids in effluent would increase TP
concentrations.
Since in this experiment constant alum dosages were used
without trying to match influent phosphorus concentrations,
some alum units with very low effluent P could be overdosed.
Therefore, the molar ratios of reactors #3 and #4 greater than 1.0 do not necessarily mean less or no BPR involved, or inefficient precipitation of aluminum phosphate. With nearly 100 percent phosphorus removal in some alum units, the molar
ratios could be overestimated because it could have been
TABLE; 13 EFFLUENT PHOSPHORUS PERFORMANCE
PARAMETER STAGE FEED #1 #2 #3 #4
ALUM DOSE 0 26 52 104
(itig/l)
I AVG 3.1 <0.1 <0.1 <0.1 <0.1 STD 1.1 <0.1 <0.1 <0.1 <0.1
P04-P (mg/l) II AVG 2.7 2.0 1.0 0.4 <0.1
/
STD 0.9 0.5 0.5 0.2 <0.1
. III AVG 3.3 1.6 <0.1 0.0 0.0
STD 0.7 1.4 0.2 0.0 0.0
I AVG ^
-100 -100 -100 -100 REMOVAL (%) II AVG
-52 83 98 100
III AVG —
81 -100 100 100
I AVG ^ ^ *0.62 *1.24 *2.48
+MOLAR RATIO II AVG -
-0.85 1.31 *2.56
III AVG *0.51 *1.02 *2.03
TABLE. 13 EFFLUENT PHOSPHORUS PERFORMANCE (CONT.)
PARAMETER STAGE FEED #1 #2 #3 #4
ALUM DOSAGE 0 26 52 104
(iag/1)
I AVG 5.3 0.4 0.5 0.4 0.3
STD 1.8 0.2 0.1 0.1 0.1
TP (mg/l) II AVG 5.3 2.1 1.1 1.2 0.6
STD 1.4 0.7 0.4 0.4 0.4
III AVG 5.5 1.4 0.5 0.9 0.5
STD 0.7 1.3 0.1 0.4 0.1
I AVG ^
93 91 93 95
REMOVAL (%) II AVG - 69 73 79 87
III AVG ~"
83 91 81 91
I AVG ^ ^ 0.89 1.34 2.61
++MOLAR RATIO II AVG - - 1.98 1.64 2.95
III AVG 1.12 1.27 2.24
It can be concluded that the molar ratios for reactor #3 and #4 in Stages I and III were overestimated because reactor #2, with lower alum dose, also achieved the same performance (see
Table 13). As for the molar ratios of reactor #2 in Stages I
and III, it is possible that they too were overestimated because of the nearly 100 percent P04-P removal in these stages. Since the P04-P removal of reactors #2 and #3 in Stage II are less than 100 percent, the molar ratios were not
overestimated.
In Stage II, the molar ratio of reactor #2 (0.85) is
higher than in Stage I (0.62) and Stage III (0.51), showing
less BPR activities. This was caused by the discontinuity of
sodium acetate feed. However, the extents of BPR and alum
precipitation can not be identify from the molar ratios. The relationships between the concentrations of acetate feed and effluent TP, shown in Figure 10, illustrate the importance of
acetate feed on phosphorus removal.
If influent and effluent TP concentrations were
considered, instead of influent TP and effluent P04-P concen¬ trations, the molar ratios would be higher (see Table 13).
This may due to the effluent suspended biomass, which would be high in phosphorus content after luxury uptake, also, from
the suspended Al-P solids. The solids with high phosphorus
FIG.10 EFFECT OF ALUM AND ACETATE ON EFF. TP
E
g
2.6 2.4 2.2 2.0
1.8
1.6
1.4 1.2
1.0
0.8
0.6
0.4
0.2
0.0
A
\
\
•it-STAGE II : Ac « 0 mg/l C STAGE III : Ac «- 15
mgAe~--STAGE I : Ac - 40 mg/l C —H
20 #2 40 #3 60 80
T---1---r -~i— 120
concentration in TP analyses, making the removal of effluent
suspended solids important. For example, if the effluent
suspended solids of reactor #2 contain 5 percent of
phosphorus, 8 mg/1 of suspended solids would contribute 0.5
mg/1 of phosphorus. This would increase the molar ratio from
0.51 to 1.12, which does not demonstrate the contribution of
BPR in the combined-treatment. Therefore, it would be more
suitable to use effluent soluble phosphorus (or P04-P)
instead of TP concentrations to evaluate BPR technology
because the performance of solids removal would affect the
effluent TP concentrations.
Therefore, the effect of effluent suspended solids on
phosphorus removal could explain why reactor #3 did not show
better performance than reactor #2 (see Figure 10). Under the
SBRoperation with alum additions, a molar ratio of 6.6 was
reported by Ketchum et al. (1987) to obtain acceptable phos¬
phorus concentrations in the effluents. This high value was
based on effluent TP concentrations, so it could be due to
the turbid effluents instead of the inefficient
combined-treatment .
In Table 13, the more alum was added the more
as much as in Stage II. (The worst phosphorus removal of reactor #3 in Stage III may due to the turbid effluent). Therefore, the addition of alum could help to remove
phosphorus when BPR performance fell off, however, when more
BPR involves the alum precipitation would not be as effective
Effects of Alum Additions on Nitrification
With respect to nitrification performances, the average
concentrations of ammonia nitrogen (NH3-N) and oxidized
nitrogen (NOx-N) in effluents are given in Table 14. If poor
nitrification occurs in the system, both the NH3-N removal and effluent NOx-N concentration would be low. According to
Table 14, poorer nitrification was observed in reactor #3 in
the last two stages because higher average NH3-N (3.8-5.8
mg/1) and lower average NOx-N (3.6-5.0 mg/1) were observed
compared with the NH3-N (0.1-0.6 mg/1) and NOx-N (6.0-6.8
mg/1) of reactors #1 and #2. As to reactor #4, much worse
nitrification was observed in these two stages (II and III)
with 10.2-11.7 mg/1 and 1.4 mg/1 of average NH3-N and NOx-N concentrations, respectively. Thus, the poor nitrification in reactors #3 and #4 clearly shows that the additions of alum
caused diminished nitrification.
Since the decreased MLVSS levels of the alum units may not be due to the wash out of solids, as discussed earlier, the poor nitrification in reactors #3 and #4 could be caused by the inhibition of Al(III). This inhibitory effect on
nitrifiers by the addition of alum also has been proposed by Long et al. (1971) and Unz et al. (1975). Although Barth et
al. (1967) concluded that aluminum ion has no adverse effect
TABLE 14. NITRIFICATION PERFORMANCE - COMPARISON OF
EFFLUENT AMMONIA AND OXIDIZED NITROGEN+
FEED #1 #2 #3 #4
ALUM DOSAGE 26 52 104
STAGE AMMONIA NITROGEN (NH3-N)
I AVG 16.6 0.3 0.4 1.0 2.9
STD 5.4 0.6 0.8 1.5 3.8
II AVG 17.0 0.2 0.6 5.8 11.7
STD 2.6 0.1 0.6 4.8 3.0
III AVG 17.0 0.1 0.2 3.8 10.2
STD 3.8 0.1 0.1 2.6 3.9
OXIDIZED NITROGEN (NOx-N)*
I AVG 0.1 5.3 5.1 4.5 3.5
STD 0.1 2.0 1.6 1.2 1.3
II AVG 0.2 6.7 6.0 3.6 1.4
STD 0.2 1.2 1.1 1.4 0.5
III AVG 0.2 6.4 6.8 5.0 1.4
STD 0.2 1.4 1.9 0.6 0.6
* OXIDIZED NITROGEN = NITRATE NITROGEN (N03-N) +