ABSTRACT
Daniel G. Strait. The Evaluation of Various Control
Methods for the Solvent 2-ethoxyethanol in the Production of Foam Pad Packaging. (Under The Advisement of Dr. Parker
C. Reist).
Workers in a foam pad packaging area were exposed to vapors of 2-ethoxyethanol, above the TLV of 5.0 ppm. This study investigated the methods to reduce this exposue through administrative and engineering controls. Sampling
was done using charcoal tube and passive dosimeters. Admin¬
istrative controls reduced exposures typically by 7035 or
more. Some areas required local ventilation to maintain exposures less than 5.0 ppm. The methods used accomplished
these goals without great cost or affecting the plant
production.
key words:
2-ethoxyethanol engineering control
TABLE OF CONTENTS
page
ACKNOWLEDGEMENTS... IV
I. INTRODUCTION... 1-3
II. THE HAZARDS AND CHARACTERISTICS
OF 2-ETHOXYETHANOL
The Chemicaland Physical Properties of
2-ethoxYethanol...4 Toxicology...5-6
III. DESCRIPTION OF THE SOLVENT, INDUSTRY AND PROCESSES STUDIED
Solvent...7-8
General Description of Plant Areas...8-15 Methods of Control Prior to the Study...15-18 IV. SAMPLING
Procedure...19-23
Equipment and Its Use...23-27 Sample Analysis...27-29 V. CONTROL STRATEGIES...30-33 VI. SAMPLING RESULTS...34-47
VII. CONCLUSIONS AND RECOMMENDATIONS
OF THIS STUDY...48-54
REFERENCES...55-56 APPENDIX...57-68
ACKNOWLEDGEMENTS
I would like to thank Mr. Dean DeMasi and Mr. Tim
Martin for their guidance, advice and assistance in making
this report possible.
My additional thanks to Dr. Parker C. Reist, Dr.
David A. Eraser and Dr. Donald L. Fox for their
encouragement personal support throughout the preparation
of this report
I appreciate the assistance given me by Dr. Kenneth G. Sexton, Dr. Harvey E. Jefferies, and Dr. William B. Parker in understanding the operation of word processing.
Most especially my unending gratitude to Julia
Spicer, my friend; Kathryn Johnson, my sister; and my
parents. They provided their typing talents, but more importantly their continual support, encouragement and good humor.
INTRODUCTION
Exposures of working populations are altered by new
process technologies at the workplace as well as by the
information discovered by the scientific community that
adds to or lessens the concern of the worker's environment
on his health. The industrial hygienlst must be responsive
to the protection of the workforce in his charge. He must
also offer solutions that are practical for the company
whose processes are creating the exposure. These
constraints may either be operational and/or financial.
It is desirable that the solutions offered do not
significantly alter the intended production or be so costly
that they put a financial strain on the resources of the
company.
The purpose of this study was to investigate various
control practices in a foam pad production process. These
controls were instituted to reduce employee exposure to the
solvent 2-ethoxyethanol to a level of 5.0 ppm or less.
After the application of these controls at selected
production sites their effectiveness was evaluated by
personal monitoring. These samples quantified the
reductions so recommendations to the plant could be made.
The problem under study was an evaluation of exposures
to workers contacting vapors of 2-ethoxyethanol. These
equipment, were produced, at the point of distribution of
chemicals in the plant. The 2-ethoxyethanol was used to
keep clean the nozzle of the spray gun from which the
reactive foam producing chemicals were sprayed.
Inhalation of the 2-ethoxyethanol vapors by the workers in these foam-in-place (PIP) operations presented a
potential health hazard. This study determined what levels
of solvent concentrations were encountered at the different areas of foam pad production , compared these levels to currently accepted standards, and then evaluated any needs to reduce exposures through administrative or engineering controls. During the time of evaluation, it was announced
that the 8-hour Time Weighted Average (TWA) of the
Threshold Limit Value (TLV) for 2-ethoxyethanol as recommended by the American Conference of Governmental
Industrial Hygienists (ACGIH) was being reduced. This
increased the concern to evaluate the existing exposures
and provide practical solutions for the plant and its labor
force.
The resulting initial samples indicated that there
were consistent values at several FIP sites exceeding the
proposed TLV concentration for 2-ethoxyethanol of 5.0 ppm.
It was concluded that operating procedures should be
changed and engineering controls added to reduce the
exposures. Recommended alterations to working habits, and
practices, and the introduction of additional engineering
of these changes were monitored by taking samples after the
II. THE HAZARDS AND CHARACTERISTICS OF 2-ETHOXYETHANOL
The Chemical and Physical Properties of 2-Ethoxvethanol
2-Ethoxyethanol is a colorless liquid at room temperature with a sweetish odor. Its chemical formula is
C H OCH CH OH and is known by other synonyms, which are
2 5 2 2
Ethylene Glycol Monoethyl-Ether and Cellosolve. It has an OSHA permissible exposure limit of 200 parts per million
3
(ppm) or 740 mg/m . The action level is 100 ppm. The
ACGIH had a recommended TLV of 50 ppm until the summer of 1982 when it published an intended change down to 5 ppm or
3
18.5 mg/m with a skin notation.
2-Ethoxyethanol has a molecular weight of 90.12, a
o
boiling point of 135 C, specific gravity of 0.93 and, at
o
normal conditions, a vapor pressure of 3.7 mmHg at 20 C.
o
The solvent has a flashpoint of 49 C and an autoignltion
o
temperature of 235 C. It is incompatible contacting strong
oxidizers and may result in an explosion. Fires involving
this solvent may produce toxic gases and vapors, predominantly carbon monoxide.
2-Ethoxyethanol is easily soluble in water as well as
organic solvents. It Is widely used in industry for
paints, resins, lacquers, dyes, soaps and cosmetics. NIOSH
has estimated in a 1972-1974 survey that 360,000 workers
were exposed to 2-ethoxyethanol on an occupational basis.
were produced In the United States.
Toxicology
2-Ethoxyethanol may enter an Individual through
Ingestion, Inhalation and absorption through the skin.
Though there are no reports of events attributed to worker
exposures In industrial settings, its hazard potential has long been recognized and studied. The recognized effects as noted in toxlcological studies have been lung, liver and
kidney damage, and eye and lung irritation. It has caused various effects on the blood characteristics in animals, including decreased levels of Immature red blood cells.
Animal tests have concluded that the solvent can be
absorbed through the skin in lethal amounts. These toxic effects had resulted in the ACGIH establishing a TLV of 50
3 3
ppm or 185 mg/m and a STEL of 100 ppm, 370 mg/m .
However, in the summer of 1982, the ACGIH listed a
notification that they were intending to change the TLV of
3
2-ethoxyethanol to 5.0 ppm and 18.5 mg/m . Two toxicologic studies were major contributors to this decision. One by Nagano et al. held that a significant Increase in
testicular atrophy and leukopemla were observed at dosages of 1000 and 2000 mg/Kg/day in mice on a 5 day/week for a 5-week basis. This was via Ingestion, but pointed to Increased effect on the blood system at lower
concentrations and a previously unrecognized reproductive
ppm in rats and rabbits. While at concentrations of 160
and 202 ppm increased incidences of growth retardation,
terata and again embryomortality . These concentrations
were at or below the OSHA PEL, and were alarming to the TLV standards review board who reduced the TLV to a new level
of 5.0 ppm.
When the notice of intended change was published in the
annual booklet of TLVs, it was necessary to modify procedures and controls in the foaming areas to comply with the 5.0 ppm, 8-hour TWA. The normal action level policy for this plant was for an employee 8-hour time-weighted exposure to be one quarter of the TLV, unless this level was impracticable for production process. The corporation philosophy and policy was that the recommended
TLV was to be the ceiling limit of any employee exposure. Any case of an excursion to the TLV from the normal action
level had to be justified.
Therefore, the plant needed to establish the exposure
levels of its affected employees, analyze these concentration levels, reduce these to levels below the TLV if needed, or reduce the exposures to the lowest
practical level by additional control techniques. After
the implementation of any controls, sampling measurements
quantifying their effectiveness on reducing the exposures
of 2-ethoxyethanol were made. Finally, recommendations
were to be made so that use of the solvent in all foam pad
III. DESCRIPTION OF THE SOLVENT, INDUSTRY AND PROCESSES STUDIED
Solvent
2-Ethoxyethanol is utilized in the packaging production process to eliminate the clogging of spray
injection guns which emit two chemicals, polyurethane resin and diphenylmethane diisocyanate, in two liquid
streams. In a container or molded form, the chemicals
react, expand, and become a solid compressible foam pad.
TABLE I
Characteristics of 2-Ethoxyethanol
Formula: C2H50CH2CHOH Molecular weight: 90.12 Specific gravity: 0.93
Vapor pressure: 3.7 mmHg. (at 20*0) Boiling point: 135^C
Flashpoint: 49*0
Autoignition: 235**C
Since small amounts of the chemicals can remain in the barrel of the spray nozzle after spraying, there is a need to keep a foam plug from developing. To eliminate this potential problem, the gun's barrel is submerged in a tray container of 2-ethoxyethanol. The solvent prevents the
two foaming components from reacting and breaks down any
foam as it forms in the gun's barrel.
When the barrel was plugged by foam, the operator used
the 2-ethoxyethanol, along with brushes and scrappers, to
inspection by the worker who typically came within 18 inches of the solvent-wetted gun, brushes, and probes.
The close distance the worker assumed to the solvent
tray where the gun was positioned between injections caused
exposures during normal working procedures. Vapors were also generated due to excess solvent that dripped on the tabletop, floor, gloves, or protective clothing of the worker when removing or replacing the gun in the tray. All of these spills evaporated and added to the continual vaporization from the tray container itself. The amount of spilled solvent varied with each worker due to their personal techniques, but elimination of some exposure was impossible. Because of the volume of pads produced in the high volume area, the solvent at times pooled and collected
on the tray table and evaporated over a much larger surface
area. Solvent disposal and replacement between trays, safety cans, and solvent cabinets also resulted in worker exposure to 2-ethoxyethanol vapors. The transfer of the solvent into trays in unventilated areas and vapors noted
upon opening the solvent cabinets resulted in additional
contact to 2-ethoxyethanol vapors. This was experienced in all of the plant areas sampled.
General Descriptions of Plant Areas
The major products produced at the plant site were component and final assembly of high technology electronic
nature of the products made, proper and secure packaging to
prevent breakage of the products during transportation was
required. Since shock and direct impact could destroy the units, foam packing that conformed to the shape of the specific product eliminated any shifting in the cardboard box container protecting the products during shipment. The foam pad arrangements were made In-house at operations
referred to as foam-ln-place (FIP) sites. Thirty-seven FIP lines were in production throughout the plant. These sites were usually located where final assembly took place
prior shipped the product out of the plant. The sites varied in the volume of pads made, since the items they protected were be produced in small or large numbers.
The FIP sites were classified into two major categories based on the method of foam formation .These two methods were referred to as free foaming and molded foam
areas.
The molded foam pads were made in production areas
where large numbers of a single product type were prepared for shipment. Since the pads had identical configurations, the outside dimensions of a pad could be made rapidly in a molded foam form prior to the product arriving for packaging.
The free foaming type of packaging was specific or
customized to a single product type when it arrived to be
packed for shipment. Work was virtually continuous during
the day at some molded foam sites, whereas fewer pads were
made in the free foam areas, as required by the variable
The High Volume production area, in this study, was at
a mezzanine level 18 feet above the.main plant floor. The area was 180 feet by 25 feet and had a 12-foot overhead. There were four pairs of pad production sites, with a container retaining the 2-ethoxyethanol solvent at each location { see Figure 1). The container, which was 4 inches by 6- inches by 3-1/4 Inches, was fixed to a
tabletop located between the two ventilating hoods. The
table had a one-half inch lip along its upper ledge and was
o
accessible to the worker in an approximate 270 arc about its base. The table was 24 inches high, was 36 Inches
deep, and 25 inches across.
Behind each mold there was a slot hood for local
ventilation of heat, water vapor, and gases produced from the reacting liquid chemicals that produced the foam material. These hoods captured vapors, but were not designed to remove the vapors emitted at the solvent container (see Figure 2). Any ventilation of the solvent
vapors was accomplished originally only by room
ventilation, which consisted of the normal air supplied
throughout the plant plus an additional HVAC vent directed
down toward the floor behind the work area, at a distance
of five feet. This ventilation was not intended to
transport the solvent vapors away from the workers, but
rather to cool the work area (the foaming areas in general
o
were 5-10 F warmer than the normal plant environment).
HIGH VOLUME MOLD FOAM AREA
FIGURE
o
SOLVENT CABINETS
o o
XX] an o
0
rxxi rxxi
ͤ
izn cna
rxxi rxxi
a en en a ® ®
rxx XH n CD ana
[XK aOD ® 0 ®
FIGURE II
rxxi
D
n
I I II
VENTILLATION HOODS SOLVENT GUN TRAYS
MOLDS
USUAL POSITION OF OPERATOR
CONVEYOR
department. These conditions resulted from the chemical reaction producing the pad material, limited air movement, and the elevated location. The air circulation In the high volume area was restricted by walls and partitions. All four sides were partially obstructed compared to the other
production areas which were free from obstructions. A few
of the partitions extended from the floor to ceiling. These obstructions reduced air changes, stagnated vapors, and elevated ambient temperatures and humidity.
The two Lower Volume areas of pad production were on the ground floor of the plant and located in two separate buildings. The ceiling height of each building was 25 feet and both areas were effectively free of walls or obstructions that might constrain the dilution of the solvent vapors emitted in the work area. One of the Low Volume areas used molds , but a much smaller number of products passed through it during a work day. Approximately 140 units In the High Volume area were produced each day compared to 30 to 40 in this Low Volume
area. The other Lower Volume area was a free foaming area
and did not use molds because of the variety of products to be packaged. The free foaming production sites were also
ventilated by a slotted hood intended only to remove vapors resulting from the reaction of the foaming chemicals. The only ventilation for the vapors of 2-ethoxyethanol was the general room ventilation of the plant floor.
The fourth pad production area studied, an Automated
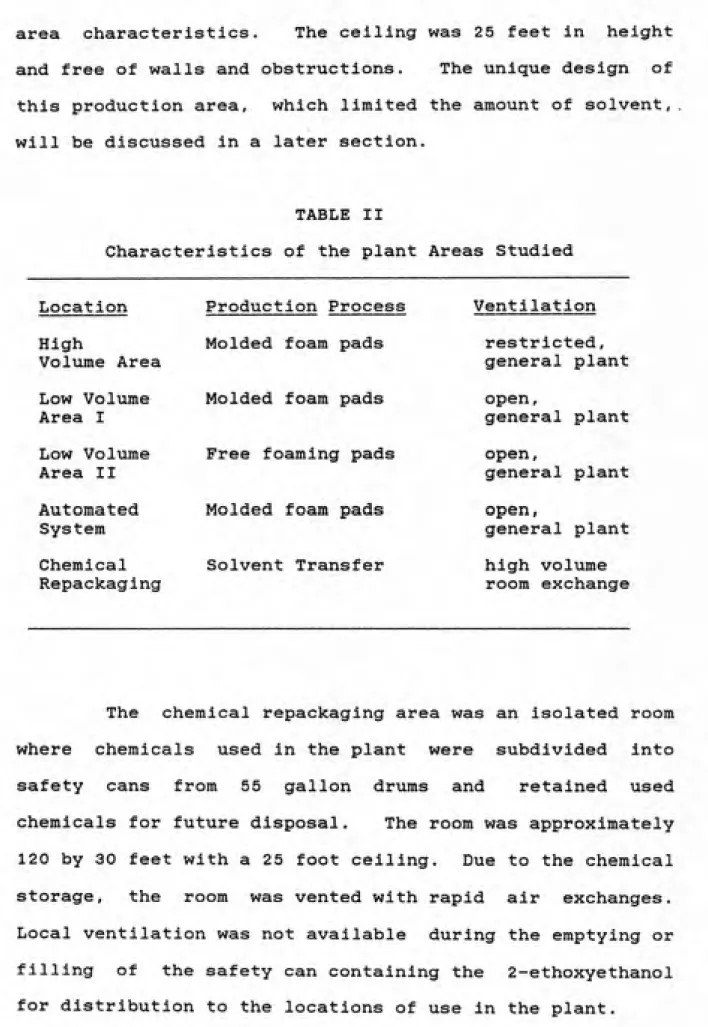
area characteristics. The ceiling was 25 feet in height and free of walls and obstructions. The unique design of
this production area, which limited the amount of solvent,
will be discussed in a later section.
TABLE II
Characteristics of the plant Areas Studied
Location High Voliime Area Low Volume Area I Low Volume Area II Automated System Chemical Repackaging Production Process
Molded foam pads
Molded foam pads
Free foaming pads
Molded foam pads
Solvent Transfer Ventilation restricted, general plant open, general plant open, general plant open, general plant high volume room exchange
The chemical repackaging area was an isolated room where chemicals used in the plant were subdivided into safety cans from 55 gallon drums and retained used
chemicals for future disposal. The room was approximately 120 by 30 feet with a 25 foot ceiling. Due to the chemical storage, the room was vented with rapid air exchanges.
Local ventilation was not available during the emptying or
filling of the safety can containing the 2-ethoxyethanol
The automated pad production area was a conveyor
configuration of molds, periodically passing under jets that • injected the chemicals that generated the foam. The jets were mechanically moved between their injection and standby position, in a horizontal tray containing the
2-ethoxyethanol. Above this tray and the molds was an open-face canopy hood located to remove vapors generated by both
foam formation and the solvent held to soak the jets. The workers spent time in this area at a distance which was
beyond potential exposure to the solvent vapors. At times cleaning a jet or replacing the solvent was necessary. Similar procedures were employed as described previously at other locations. These actions did expose the worker to
2-ethoxyethanol vapors.
The chemical repackaging area created exposures when 2-ethoxyethanol was pumped into 5 or 10-gallon safety cans for future use in the plant or when used solvent was
discharged into waste barrels for temporary storage. Exposures took place in the exchange of pumps from one barrel to another or in holding a pump nozzle into a safety
can mouth.
Local ventilation was not used, but there was a rapid air exchange in the room. The exposures to workers in this
area were short-term exposures, usually 15-30 minutes per
day.
Time and motion studies were subjectively determined
were supplemented with information provided by the workers and management personnel at these lines. The studies were designed to identify any abnormal contact, estimate its frequency, and acquire samples to measure the exposures throughout the plant. Since one of the goals was to measure 8-hour TWA for workers, special work routines were included during sampling, such as exposures from gun
cleaning and solvent pouring. These observations and the
time and motion studies estimated the actual work time
spent in potential contact with the solvent.
Six and one-half hours (390 minutes) was judged to be representative of the time workers were exposed to 2-ethoxyethanol during a normal eight hour work shift. This accounted for time spent at lunch, shift breaks and time
spent in preparing for the next workday and housekeeping at
the end of the day.
Methods of Control Prior to the Study
When this study began, various control procedures were
in place to reduce exposures to employees and to limit safety hazards to the physical plant facility. Based upon
previous routine samples taken in the past ten years, the
controls in place to limit the worker exposures to 2-ethoxyethanol appeared adequate. These controls on the
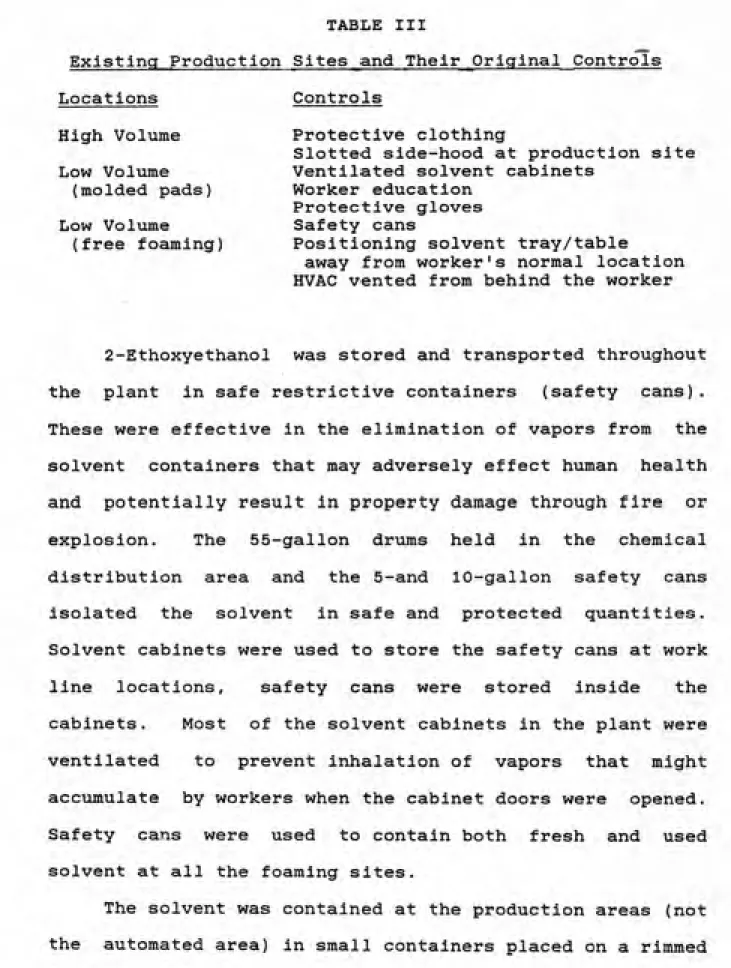
TABLE III
Existing Production Sites^and Their^Oriqinal Controls Locations Controls
High Volume Protective clothing
Slotted side-hood at production site
Low Volume Ventilated solvent cabinets
(molded pads) Worker education
Protective gloves
Low Volume Safety cans
(free foaming) Positioning solvent tray/table
away from worker's normal location
HVAC vented from behind the worker
2-Ethoxyethanol was stored and transported throughout
the plant in safe restrictive containers (safety cans).
These were effective in the elimination of vapors from the solvent containers that may adversely effect human health and potentially result in property damage through fire or explosion. The 55-gallon drums held in the chemical distribution area and the 5-and 10-gallon safety cans isolated the solvent in safe and protected quantities. Solvent cabinets were used to store the safety cans at work line locations, safety cans were stored inside the
cabinets. Most of the solvent cabinets in the plant were
ventilated to prevent inhalation of vapors that might
accumulate by workers when the cabinet doors were opened.
Safety cans were used to contain both fresh and used
solvent at all the foaming sites.
The solvent was contained at the production areas (not
the automated area) in small containers placed on a rimmed
confined to the tabletop. The pooling of the solvent
produced additional vapors generated by the continual
evaporation of solvent from the solvent tray and tabletop. Worker education by the Industrial Hygiene Department was conducted for employees prior to working in the foam packaging areas in the plant. During these sessions,
workers were instructed on the various hazards that could
be encountered during normal operational procedures. Guidelines expected to be carried out in handling, proper care and use of the 2-ethoxyethanol solvent, and recognized dangers were anounced. Workers were warned of skin contact, its flammability and any unnecessary inhalation of solvent vapors.
The workers were provided with personal protective clothing to eliminate skin contact of 2-ethoxyethanol. Foaming spray gun operators were required to wear goggles, a half-length smock, and gloves. The smocks were made of Dupont Tyvek, and gloves were made of Neoprene. These materials give excellent protection against skin contact and subsequent absorption through the skin. The substances of the smock and gloves gave the longest breakthrough protection available. Each work area required new smocks and gloves to be exchanged twice a day.
As previously mentioned, the ventilation at all manually operated foaming sites was initially limited to
general room ventilation and additional local cooling
vented into the immediate area for temperature comfort.
exposure of the workers to the 2-ethoxyethanol vapors. The only local ventilation available was the slot hoods at each site designed to remove the vapor produced in the foam pad-generating process. The range of capture of these hoods could not remove any vapors produced at the solvent containers. This was shown by smoke tube testing of the
IV. SAMPLING
Procedure
In this Investigation, 2-ethoxyethanol was sampled using the NIOSH approved and recommended method, S-361.
This method was selected because the measurements were to
be used as a basis for deciding potential courses controlling the solvent if exposure levels were excessive and to document that the exposures were within OSHA and company guidelines. The method is easily performed to give
sensitive and reliable results to the concentrations
encountered in workplaces, and it is suitable to measure the exposure of employees within the breathing zone. Samples were also obtained on a comparison basis by using passive dosimeters. The dosimeters were sampled within the breathing zone of the exposed employee. They served to verify the values of the charcoal samples and to provide an actual test of the dosimeters' accuracy for future sampling when routine monitoring of work sites was required.
3
o
23 to 23.5 C and atmospheric pressures of 757.1 to 770.3 mmHg using a six liter sample volume. The actual samples
o
were taken at a temperature range of 21.1 to 26.7 C and an atmospheric pressure range of between 745 to 765 mmHg. The actual sample volumes ranged from 2.45 to 6.05 liters.
These variations about those of the tested NIOSH validation
are not significant in altering the validity of the samples in this study.
Using Method S-361, a known volume of air is drawen through an activated charcoal tube by means of a sampling pump, absorbing the 2-ethoxyethanol vapors upon the
charcoal. The charcoal is then removed from the tube,
placed in a vial, and the solvent is desorbed into solution for injection and analysis by gas chromatography. The
response of the gas chromatograph to each sample is
compared to a calibration of standards and the amount of 2-ethoxyethanol collected in the samples is reported by weight (mg). This value is then used to quantify the concentration of the sample period in parts per million
(ppm).
All sampling done for this study was accomplished by using personal sampling at the breathing zone of the employee. Area sampling was not representative of actual exposures encountered by employees in their normal work practices and handling of 2-ethoxyethanol. The previous description of the time and motion studies of the employees
involved in these operations indicated a great variance in
the employees were exposed to varying amounts of the
solvent vapors because of their individual work practices.
Due to this non-uniform characteristic of the solvent
exposure, area samples were not taken. Personal samples,
however, were used to monitor the extent of employee
exposures on a real-time basis. This sample type was used
to account for the variable volume of foam pads made at
different production lines and the time spent at the
solvent containers where vapors were emitted. Personal samples also addressed individual work practices with the solvent such as pouring, gun cleaning, or spillage in the removal and replacement of the gun from the solvent
container. This monitoring best evaluated any modifications
to either work practices or new controls that may reduce the levels of exposure. Since one of the points of concern
was whether the revalued 8-hour TLV could be met, the
personal monitoring scheme documented specific exposures to a worker (or group of workers) and measured the effect
of controls introduced for later comparison.
The personal sampling pump was hung on the employee's
belt with the sampling line run over the back and shoulder.
The charcoal tube was contained in a protective holder and
clipped to the employee's smock collar. Any duplicate
charcoal tube samples or passive dosimeters used were
attached in a similar manner to the opposite smock collar.
to allow the atmosphere to be drawn into the charcoal tube.
These tubes were hung in a vertical position to prevent a
channeling of the exposure atmosphere. Passive dosimeters
were hung so the exposed open face was unobstructed. Immediately before beginning the sampling, the glass ends
of the charcoal tubes to be used were broken off and the
protective facing over the passive dosimeter was removed. During each sampling day, a blank charcoal tube was opened and capped, as was a passive dosimeter blank. These blanks accompanied the actual samples to which they corresponded to offset any background response detected
that would be added in error to a reported exposure value
taken during a particular day. These blanks were
immediately capped and received no exposure to the
2-ethoxyethanol.
The charcoal tubes were attached to the sampling
lines, and the pump's analog counter number was recorded,
as was the sample start time. The pumps were turned on
and the sampling was observed. At the conclusion of
sampling, the counter number and finish time were noted,
the pump was turned off, and the samples were sealed with plastic end caps. The passive dosimeters were handled in a
similar manner and matched with individual charcoal tube
The samples were never stored for more than one week and typically for only two or three days.
During sampling, temperature and psychometric readings were made to note temperature and relative humidity. These
o
levels never exceeded 80 F or 653$, respectively. Each
sample was given an individual sample number to denote the sequence in which it was taken, a date, and an operational
area. The specific foaming areas within an operation were
recorded by the exhaust hood number at the site. Each
employee used in sampling was noted by a specific individual number so time-weighted averages could be calculated.
Observations of the samples were made so the occurrence of any abnormalities affecting the employee's exposure would be known. These observations allowed notation of the work practices occurring during the sampling and, thus, indentifled samples taken during high exposure practices, such as solvent pours, gun cleanings, and spills. When control procedures were begun, notes were
also taken on whether the proceedures were followed and their effectiveness evaluated.
Equipment and Its Use
The equipment used in the sampling procedures for
2-ethoxyethanol conformed to the requirements of Method
S-361. The use of passive dosimeters followed the recommended
guidelines supplied by the manufacturer, the 3-M Company.
used In this study. The performance characteristics of the two pumps did not substantially differ. The pumps had
internal piston stroke counters and were flow compensating.
They were powered by internal rechargeable batteries and
had an operational lifetime longer than the uses of this
study. The nominal calibration flowrate of 0.050 liters/minute was well within their Intended flow range of 0.005 to 0.3 liters/minute.
The SKC charcoal tubes were approximately 6 cm long and had a 4-mm inner diameter. They had a 100-mg front section of charcoal separated by a small portion of urethane foam from a rear section of charcoal containing 50 mg. The ends of each tube were plugged with glass wool. The charcoal was 20/40 mesh activated coconut charcoal. Three different lots of tubes were used for these samples,
but the tubes from different lots were never mixed.
A Bendix battery powered psychrometer was used to determine the relative htimldity at the sample sites. It was also used to record the ambient temperature at the sites by reading the dry bulb thermometer.
Passive dosimeters were 3-M 3500 Organic Vapor Monitors. Their effective sampling rate determined for
2-ethoxyethanol of 0.032 liters/minute, established by 3-M.
Prior to and immediately after each day of sampling, the pumps used were calibrated to document their flow rates and evaluate their performance. The flow rate for each sample was an average of the two calibration flows.
acquired from the same lot used during the sample taken that day. The pressure drop across the tube was measured
with a water manometer. These values varied between 0.3
and 0.55 inches of water at a flow rate of 0,05
liters/minute. An NBS traceable 50 cc bubble flowmeter was used to measure the volume a bubble traversed, timed by a
Chronus stopwatch accurate to one-hundredth of a second. Three timings of a 500-cc volume were taken at each calibration and averaged. This time was divided into the
volume measured to obtain the flow rate. The temperature
was recorded during calibrations, but volumes were not corrected to a standard for temperature and pressure since
the corrections proved insignificant.
During each of the three timings, the initial and final pump strokes, as indicated by the pump's internal
counter, were recorded. When the number of strokes counted
was referenced to the time measured, a back-up calibration
in strokes per minute was established in the event that a
pump temporarily stopped and had to be restarted. All the conditions observed and the values taken during calibration were recorded in a notebook permanently kept
for the plant.
Several methods of quality control were used in the calibration and sampling processes. Multiple timings of
each calibration and calibrations prior to and after each
sampling periods. Flows varied by plus or minus five percent, but this variation did not invalidate any of the samples taken. On the one occasion when a pump stopped during sampling, the pump's internal counter was used to calculate the volume of the sample taken. Since the pump immediately restarted when it was turned on and the recalibrated flow rate approximated the previous rate, the sample was considered accurate and valid, and it was analyzed using the volume calculated by the strokes counted.
As previously discribed a blank charcoal tube and passive dosimeter were Included with each day's samples These blanks were not identified to the laboratory prior to analysis, to verify that only actual samples showed significant concentrations of 2-ethoxyethanol. All blanks
were reported at undetectable values.
The observation of the samples taken, estabished another form of quality control. Abnormal exposures of the samples were noticed and evaluated. The investigator observed the sampling process greater than 959J of the sampling time during this study. Employee cooperation was high and although several accidents invalidated samples the investigator firmly believes that during the unobserved
periods, the employees did nothing to jeopardize the samples.
The use of the 3-M 3500 organic vapor passive dosimeter was originally begun as a quality control check.
dosimeter would closely reflect those taken by the charcoal
tubes. Two side-by-side charcoal samples were also made to verify the accuracy of the entire sampling procedure through the final laboratory analysis.
Sample Analysis
Two different outside laboratories analyzed the charcoal tube samples and passive dosimeters. Both labs were AIHA approved and the analyses followed requirements
set forth in Method S-361. Hager Laboratories of Denver, Colorado, analyzed the first four samples taken. The Research Triangle Institute (RTI), Research Triangle Park, North Carolina analyzed the remaining fifty-seven samples.
This change in laboratories was primarily made because of the close proximity of RTI to the plant, which made it
possible to hand carry samples to the lab, leaving them in a frozen state from the storage at the plant to storage at the laboratory. Sample integrity was thus maintained to a
greater extent.
Method S-361 requires analysis of the charcoal tube samples by gas chromatography, with a flame ionization
detector. Gas chromatography is used to physically separate a sample into its chemical components by passing an injected aliquot through a column. The column individualizes the components on the basis of their retention time as they move through the column. After passing through the column the components are burned in a
then collected on an electrode. The response is measured on
a recorder that integrates the peak (resulting from the response) area. Comparing that area to the areas of standards to ascertain the amount of the component in the aliquot. The procedure is described in detail in NIOSH Method S-361.
The gas chromatograph used to analyze the samples at
RTI was Hewlett-Packard HP-5880A Level-Four gas
chromatograph, with auto-sampler and internal calibration capabilities programmable to report values of the analyses.
The 20-foot column was 1/8-inch stainless steel packed with
loas FFAP stationary phase on 100/120 mesh Supelcoport. The desorbing reagent was 5% methanol in methylene chloride. Actual desorbing coefficients were determined for each day's samples and analyzed with respect to that days the charcoal tube samples. The stated manufacturer's desorbing coefficient by 3-M Company was used when analyzing the
passive dosimeter values.
The investigator reported to the laboratory other
there had been any breakthrough in the front section and if
saturation of the sample had occurred.
The laboratory at RTI calibrated the gas chromatograph prior to each batch of samples analyzed. The calibration was accomplished by injections of three known standards ranging from 5 to 25 ppm. The internal calibrator extrapolated the calibration curve above and below these levels for any samples analyzed at those levels. Fresh standards were prepared at the time of each batch analyzed.
Standards were injected at the end of analysis to ensure that the gas chromatograph remained constant in its reported values of the amount of 2-ethoxyethanol detected; therefore, all samples run between this and the original calibration were accurate measures of the sample injected
into the gas chromatograph.
Typically, the analyses done at the RTI laboratory were made within three days after receiving the samples from the investigator. As previously mentioned, samples were kept cold during storage at the plant, hand
V. CONTROL STRATEGIES
As the result of the analysis of the initial samples during the study, the plant sought new methods to reduce the exposure levels below that of the new TLV (5.0 ppm).
This was attempted from two basic control strategies, administrative procedures and engineering devices.
A third method was under investigation during this sampling study, substitution of an Alternative solvent for 2-ethoxyethanol. This method was to be evaluated on the basis of the substitute's effectiveness in the production process (that is, did it keep the spray gun free of obstructions) and any health and safety effects unique to
the solvent to be substituted.
The management of the plant desired to continue to use the solvent 2-ethoxyethanol because of its history of good performance in the production area. It was expected that maintaining the exposures with the TLV reduced to 5.0 ppm would be difficult, requiring greater care, although it
could be accomplished with perhaps less effort and expense
than switching to an alternative substance. Therefore, it was necessary to devise various methods and combinations of further controls that would effectively reduce the
exposures below the 5 ppm TWA and do so without
without entailing great expense.
Administrative controls were immediately tried to reduce exposures. First, a review of the hazards to which
the workers were exposed to daily by this solvent was conducted to spur careful work practices by the employees. It was emphasized to the workers and management that care in the handling of the solvent and use of any personal or
engineered protection would be necessary in all future operations in these areas. The managers of these
production areas were made aware of the revised controls, because production managers are the first line of responsibility to enforce the health and safety procedures required in the plant's structure of responsibilities.
Another administrative control was a change in the procedure for pouring solvent to or from the container and a change in the proceedure for cleaning the foaming gun if it became clogged. Prior to this study, there were no recommended locations for these tasks, subsequently,
locations were identified where local ventilation hoods
might remove the extra vapors inhaled by the worker in these types of operations. The top of the foam molds with
their slot hoods were the first areas denoted. When the
solvent tables were vented, this area was prescribed.
Four measures were introduced to the High Volume
production area to reduce the exposures by engineered
controls. An automated foam pad machine was evaluated from
a health exposure prospective. The solvent cabinets used
tray tabletops were drained so the solvent could not collect. The tray tabletops were ventilated with a slotted vent to remove vapors generated from the solvent container or tabletop.
For production purposes, the plant, was considering the use of an automated foam pad producing machine. With the new concerns of solvent exposures in the manual production process, the measured exposures to personnel operating the automated system might increase the attractiveness of this type of system. A limitation with
the automated system was that it was practical only for
high volume areas where the pads could be molded, and it
was not applicable to the free foaming production areas.
Therefore, if the production of pads was successful from a
production and investment standpoint, the automated system
could relieve a significant portion of exposures if the
measured solvent exposures at this prototype were
satisfactory too.
Solvent cabinets in the High Volume area were actively vented to pull any vapors of the solvent that might acctimulate and be inhalable when a worker opened the doors
of the cabinet. This action resulted in a noticeable
A slot hood ventilating the tray tabletop and solvent container was built at one production site in the High Volume area and used experimentally to attempt to quantify the levels of reductions that might be observed using this method. The High Voliime area was picked because, if its relatively higher exposure levels could be reduced, the Low Volume areas would measure exposure values that were at least as low as those in the high volumn areas.
The slot hood was 14 inches in length, with a 1.5 inch
slot pulling 1800 feet per minute. Additional side panels
were placed down the sides of the tray tabletop to constrict the flow and capture the vapors more efficiently.
This slot hood was tested with smoke tubes to evaluate its
capture of vapors. It proved to be adequate in ventilation of the entire table and container arrangement.
The rims around the tray tabletops caused the solvent to pool because of drips and spills that occurred. These were drained with a half-inch hole approximately six inches from the end of the longest length of the tabletop. The top was also slanted to force the free-flowing solvent to
the drainhole. A flexible line connected this drain hole
to a safety can containing the waste solvent and eliminated
any further vaporization in the working area, as well as
safety or fire hazards.
Each control method was expected to result in some
measurable reduction of exposure. Through a progression of
installation, measurement and combination, a complete
VI. SAMPLING RESULTS
Sample measurements were taken in the High Volumn
Area, the two Low Volume Areas, and the chemical storage area, establishing the levels of exposures to the workforce
prior to the implimentation of any controls to reduce vapors and contact of the workers to the 2-ethoxyethanol.
Each area was sampled to the extent representing the normal employee exposure for the areas. Measurements were then made in specific working sites where controls had been
implemented singularly or in combination to measure reductions in exposures (if any occurred).
The Chemical Repackaging area was sampled on August 23, using a single charcoal tube. This was a sixteen minute sample taken during the entire time that the employee was exposed to the 2-ethoxyethanol solvent.
The employee moved the pump from one 55-gallon drum to
another and filled six safety cans with the 2-ethoxyethanol. This procedure was very representative of normal employee duties in this area. The sample concentration was 0.67 ppm. This area was judged an area
of short-term exposure. The standard STEL values permit a
maximum concentration of 10.0 ppm. The level was less than
1035 the STEL and, therefore, no further sampling was done,
On May 27, the molded form Low Volume production area was sampled using charcoal tubes. Two samples were acquired
sampling one employee's exposure to the solvent. The
samples did not include either solvent pouring or gun
cleaning operations. The total sampling time was 179
minutes, representing one-half of an employee workday. The
two samples were analyzed to have concentrations of 4.8 ppm
and 7.1 ppm, respectively. The 8-hour TWA for this
employee was 4.8 ppm.
Sampling was conducted at the other Low Volume area in
the plant on August 2, 3, and 4. This was a free foaming
site in of the plant's production area. Samples were acquired using one employee and a full eight hour sample
was measured. Both charcoal tubes and a passive dosimeter
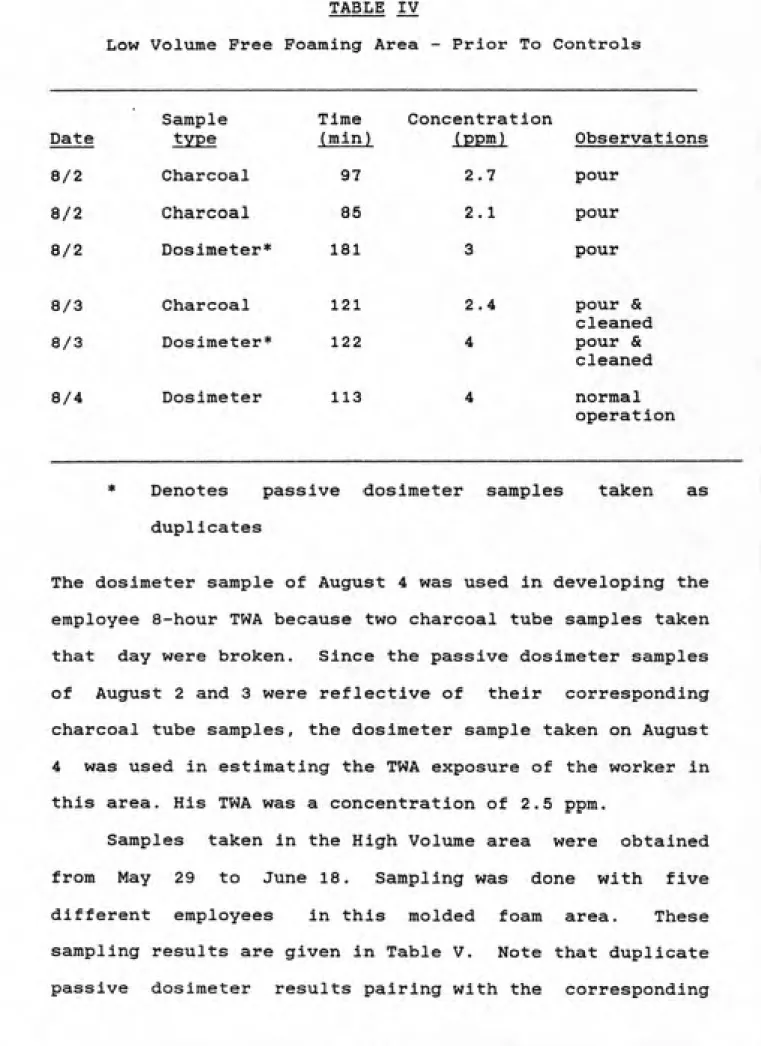
TABLE IV
Low Volume Free Foaming Area - Prior To Controls
Sample Time Concentration
Date type (min) (ppm) Observations
8/2 Charcoal 97 2,7 pour
8/2 Charcoal 85 2.1 pour
8/2 Dosimeter* 181 3 pour
8/3 Charcoal 121 2.4 pour &
cleaned
8/3 Dosimeter* 122 4 pour &
cleaned
8/4 Dosimeter 113 4 normal
operation
* Denotes passive dosimeter samples taken as
duplicates
The dosimeter sample of August 4 was used in developing the employee 8-hour TWA because two charcoal tube samples taken that day were broken. Since the passive dosimeter samples of August 2 and 3 were reflective of their corresponding charcoal tube samples, the dosimeter sample taken on August 4 was used in estimating the TWA exposure of the worker in this area. His TWA was a concentration of 2.5 ppm.
Samples taken in the High Volume area were obtained
from May 29 to June 18. Sampling was done with five
different employees in this molded foam area. These
charcoal tube sample.
TABLE V
High Volume Molded Foam Area -Prior to Controls
Sample Time Concentration
Date type (min) (PPm)
5/29 Charcoal 69 60.3
5/29 Charcoal 93 61.0
6/1 Charcoal 73 14.0
6/1 Charcoal 58 35.0
6/15 Charcoal 86 37.0
6/15 Dosimeter 85 49.0
6/15 Charcoal 81 34.0
6/15 Dosimeter 83 21.0
6/16 Charcoal 120 27.0
6/16 Dosimeter 115 11.0
6/16 Charcoal 119 13.0
6/16 Dosimeter 125 22.0
6/17 Charcoal 62 43.0
6/17 Dosimeter 62 19.0
6/17 Charcoal 49 35.0
6/17 Dosimeter 49 32.0
6/18 Charcoal 94 32.0
6/18 Dosimeter 94 24.0
6/18 Charcoal 90 12.0
6/18 Dosimeter 90 7.7
Observation pour pour pour pour gun cleaned gun cleaned gun cleaned gun cleaned
The results of the uncontrolled exposures in the High
Volume area indicated two points. First, there were high
exposures, regularly in excess of the 5 ppm TLV. Second,
when employees either poured solvent (fresh or waste) or
cleaned the foaming guns, they experienced significantly higher exposures than during periods when only foam was
shot and cast into the molded forms. The concentrations to
which workers were exposed to were variable, from 12.0 to 61.0 ppm for the charcoal tube samples. These were all well above the 5.0 ppm level. Yet, both Low Volume areas were very near this TLV level. The only reasonable differences found were that the workers in the High Volume area spent more time in close proximity to the solvent container and that this working area in general was more, confined with restricted air movement. 8-hour TWAs for the High Volume
areas were 31.0 ppm, 20.2 ppm, and 23.2 ppm.
The results in the High Volume area prompted the need
to find solutions to reduce work exposures to 2-ethoxyethanol. It was thought that, if solutions could be found to reduce the exposures in the High Volume area, then similar steps taken at the low volume areas would result in lower exposures as well. This would produce a margin of
safety at all foam work places.
Samples were taken on one employee maintaining the prototype automated foaming machine process. The results are shown in Table VI. Note that the samples are listed in
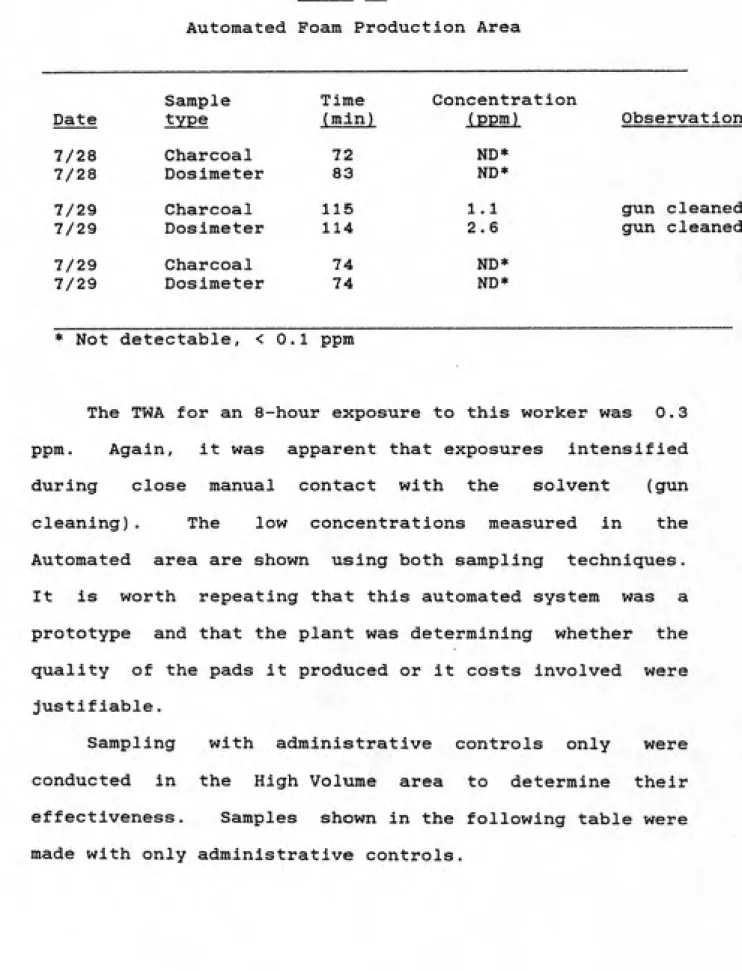
TABLE VI
Automated Foam Production Area
Sample Time Concentration
Date type (min) (ppm) Observation
7/28 Charcoal 72 ND*
7/28 Dosimeter 83 ND*
7/29 Charcoal 115 1.1 gun cleaned
7/29 Dosimeter 114 2.6 gun cleaned
7/29 Charcoal 74 ND*
7/29 Dosimeter 74 ND*
ͣ
* Not detectable, < 0.1 ppm
The TWA for an 8-hour exposure to this worker was 0.3 ppm. Again, it was apparent that exposures intensified during close manual contact with the solvent {gun cleaning). The low concentrations measured in the Automated area are shown using both sampling techniques. It is worth repeating that this automated system was a prototype and that the plant was determining whether the quality of the pads it produced or it costs involved were
justifiable.
Sampling with administrative controls only were conducted in the High Volume area to determine their
TABLE VII
High Volume Area - with Administrative Controls
Sample Time Concentrat ion
Date type (min) (ppm) Observations
9/15 Charcoal 108 9.5 pour & clean
10/11 Charcoal 106 6.4 gun cleaned
10/13 Charcoal 83 1.7
10/13 Charcoal 105 4.1
These controls were: (1) reemphasizing to the workers the importance of care in their work practices and (2) conducting solvent pours or gun cleaning only in front of ventilation. This was done at one fixed foaming site with one employee participating in the measurements.
The TWA for the worker was 5.6 ppm. In general, the results shown here, illustrate the large reduction made over the previous, uncontrolled conditions in the High Volume area, even with only the application of administrative controls. The samples again showed the direct relationship between higher exposures obtained when the foam gun was cleaned or when solvent in the tray
container was exchanged.
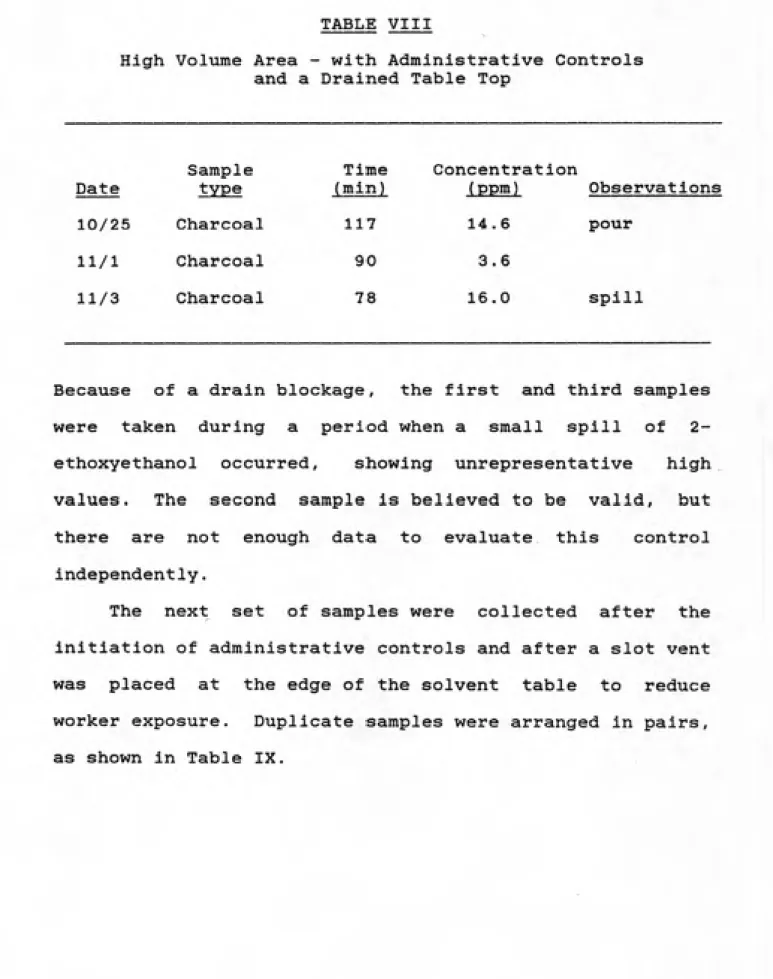
TABLE VIII
High Volume Area - with Administrative Controls
and a Drained Table Top
Date
Sample
type 10/25 Charcoal
11/1 Charcoal
11/3 Charcoal
Time Concentration
(min) (ppm) Observations 117 14.6 pour
90 3.6
78 16.0 spill
Because of a drain blockage, the first and third samples were taken during a period when a small spill of 2-ethoxyethanol occurred, showing unrepresentative high values. The second sample is believed to be valid, but there are not enough data to evaluate this control independently.
The next set of samples were collected after the
initiation of administrative controls and after a slot vent
was placed at the edge of the solvent table to reduce
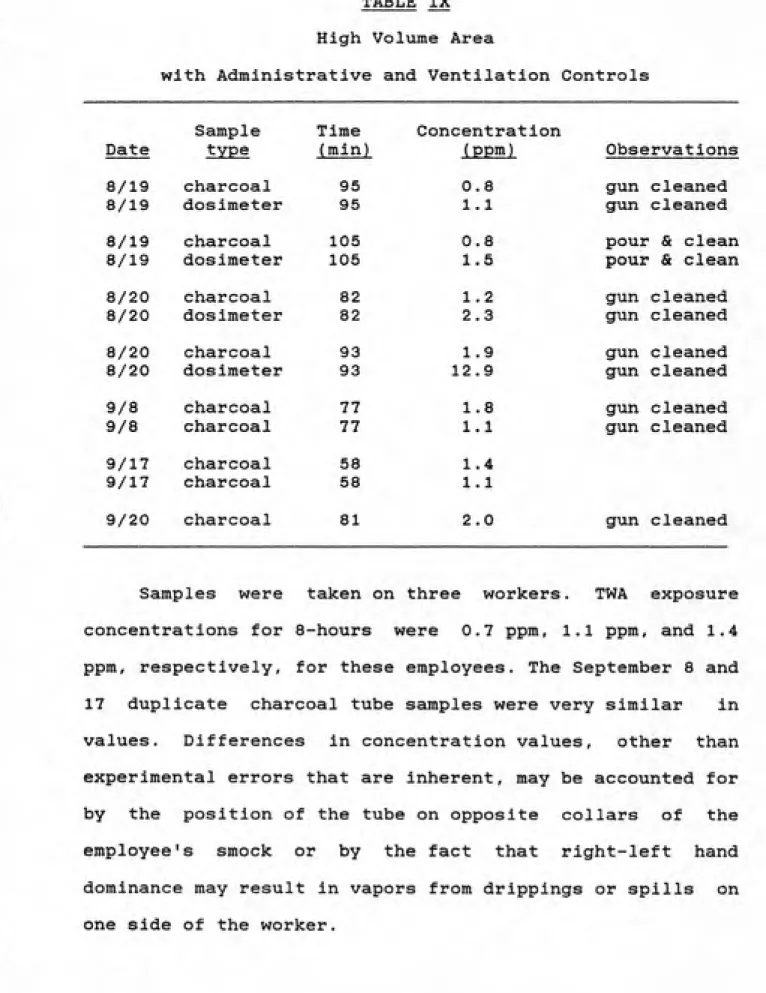
TABLE IX High Volume Area
with Administrative and Ventilation Controls
Sample Time Concentration
Date type (min) (ppm) Observations
8/19 charcoal 95 0.8 gun cleaned
8/19 dosimeter 95 1.1 gun cleaned
8/19 charcoal 105 0.8 pour & clean
8/19 dosimeter 105 1.5 pour & clean
8/20 charcoal 82 1.2 gun cleaned
8/20 dosimeter 82 2.3 gun cleaned
8/20 charcoal 93 1.9 gun cleaned
8/20 dosimeter 93 12.9 gun cleaned
9/8 charcoal 77 1.8 gun cleaned
9/8 charcoal 77 1.1 gun cleaned
9/17 charcoal 58 1.4
9/17 charcoal 58 1.1
9/20 charcoal 81 2.0 gun cleaned
Samples were taken on three workers. TWA exposure
concentrations for 8-hours were 0.7 ppm, 1.1 ppm, and 1.4 ppm, respectively, for these employees. The September 8 and 17 duplicate charcoal tube samples were very similar in
values. Differences in concentration values, other than
experimental errors that are inherent, may be accounted for by the position of the tube on opposite collars of the employee's smock or by the fact that right-left hand dominance may result in vapors from drippings or spills on
The last group of samples in the High Volume area were taken using all three methods of control: administrative
controls, draining of the solvent, table, and ventilation
of the tabletop as well as found in Table X.
TABLE X
High Volume Area - with All Controls
Sample Time
Date type (min)
10/11 charcoal 110
10/13 charcoal 67
10/13 charcoal 97
10/13 charcoal 58
Concentration (PPm)
0.9
0.7
ND*
0.9
Observations
gun cleaned
* Not detectable < 0.1 (ppm)
One employee was sampled during these measurements. No duplicate samples were taken. The TWA exposure concentrations for 8-hours was 0.5 ppm under these conditions. The samples taken represented the lowest values sampled, with the exception of the automated system. They were consistent in their measured concentrations and controlled exposures when the foam gun was also cleaned.
Comparison of charcoal tube samples with the dosimeter sample results indicated two trends. The dosimeter measured slightly higher concentrations when the exposures were in
the range of 0 to 10 ppm. Higher exposures resulted in a
reversal of this relationship, with the dosimeters usually
is illustrated in Graphs One and Two. The differences between the sample measurements were not significant until the concentration was over 10 ppm, when the lower dosimeter values were too large to be acceptable. Graphs Three and
Four illustrate this point.
Variation of results was expected to some extent because the samples were taken from opposite sides of the workers' shirt collars. Since the solvent tray and table were positioned predominantly to the workers' right or left, this may account for some of the differences noted. Several investigators of passive dosimeter performance have noted, that in areas of high humidity, a decrease as much as 10% occures. Temperatures in the range of 5-35 degrees Celsius do not seem to present more than a 596 positive error and temperture was not a factor in this study. Air velocity, also appears to have no significant effect on the
dosimeters' performance. Field testing by Langhorst noted that charcoal tube samples were 7% higher in reported
values versus passive dosimeters. All of these conditions
do not account for the large error noted in the
concentrations above 10 ppm, however, these contribute to differences reported in this study.
The trend of higher reported values by dosimetry, at
exposures below 10 ppm, support the experiences of others'
field testing the badges. Dosimeters generally lose
sensitivity at low concentrations for short sampling
I
2
Graph 1: Lower Range
COMPARISON OF a!EEASUKEMSU>JTS
CHASCOAL TUSS DATA — perfect fit
i
2
50
45
-COJCPARISON OF MEASUREMENTS
CHASCOAL TUHE DATA
t
I
3.5
2.S
o.s
-Graph 3: Low Concentration
SJLOP3J:=1.477, INT=0.175, H2=O.BB2
Z.4,
QiBixconl Tiite (ppm.)
a DATA --- LEAST SQUARES FIT
VTx <a.j./xx 'Jr. xxx,^xx v^ vyxxv-^c^xx^^-x <3. cxv./xx
SLOPE=O.Sei, INT=e.eB, R2=0.24S
t I
\
r
have better performance if sampling times are lengthened.
It should be noted that a 259S error between the two types
of sampling would not be unusual.
It is curious that the results show a shift in the error trends of the dosimeter versus charcoal tube
sampling, but the magnitude of the error does not defeat
the extent of the dosimeter results. The dosimeter should
be used as a first cut in sampling and the charcoal tube
VII. CONCLUSIONS AND RECOMMENDATIONS OF THIS STUDY
The results of the uncontrolled samples in the Low Volume areas, prior to any controls, were below the TLV of 5.0 ppm. However, they could become higher if practices in the work area or the volume of foam pads produced increased. This would result in more contact with the 2-ethoxyethanol. Levels measured in the High Volume area were well above the 5 ppm TLV and some means to reduce the employees' exposures had to be developed if the use of
2-Ethoxyethanol was to continue.
The samples taken in the High Volume area after administrative controls were instituted produced a marked
reduction in the 8-hour TWAs. These results showed a
reduced exposure of 75-80^ of their previous values. Despite this significant reduction, exposures were still higher than the 5.0 ppm TLV. Two of the samples fell below the TLV, but two others were over 5.0 ppm. Engineering controls, at this point, were added to further reduce the exposures. Since the Lower Volume areas had measured concentrations just below the TLV of 5.0 ppm, the
introduction of the administrative procedures used in the
High Volume area are expected reduce the exposures in the
Low Volume areas with a margin of safety.
The measurement results of the samples taken with the
easily plugged within 15-30 minutes and pooling of the
solvent resulted in measured exposures that increased
significantly over previous values. The drain opening in the tabletop needed to be increased to a diameter of about three-quarters of an inch to allow the splashed solvent and small particles of foam to freely flush into the drain and down into the safety can collecting the waste solvent. Because of this complication, sampled values taken with
both the drained tabletop and administrative controls were
suspected as invalid.
The results on the use of administrative controls coupled with the local ventilation attached to the solvent tabletop markedly reduced the TWAs encountered by the workers in the High Volume area. If these controls were used in the Low Volume areas, it would be expected that exposure levels would be at or below the highest values
measured in the High Volume area. The TWA was cut to approximately 1.0 ppm, a level that would provide the
margin of safety the plant sought for its employees.
A large reduction in the concentrations measured
resulted from using all three controls: (1) the change of work procedures, (2) venting of the tabletop, and (3) adequate draining of the tabletop. When all three
procedures were used, the TWA was reduced to 0.5 ppm (from
1,0 ppm), indicated that, when the drain of the tabletop was kept free and clear, a further reduction in
results certainly furthered the opinion that
2-ethoxyethanol exposures in the High Volume area could be reduced well below the 5.0 ppm level and that its
production use could be continued.
The Automated area sampling measurements showed that, if the automated foam pad production machine that the plant was testing could be successful from a production
viewpoint, its related employee exposures would be minimal
and well below the 5.0 ppm TLV. It should be emphasized that the automated machine would be practical in areas only of high volume foam production, leaving many low volume sites through the plant in the need of control by other
means.
Based upon this study, the investigator cites several recommendations to the plant with respect to
employee exposures to 2-ethoxyethanol.
The results of the samples taken in an uncontrolled condition, whether high or low volume
areas, require some additional controls to ensure
that the 8-hour TWAs do not exceed 5.0 ppm.
The exposures in the Chemical Repacking area were found to be sufficiently low, so that further control is not necessary. Periodical monitoring on a semi¬
annual basis would be prudent to ensure that ex¬
posures continue to remain at this low concentration. Should the automated pad machine pass quality standards set by manufacturing and production
molded foam pad areas in the plant. This would
eliminate the vast majority of exposures that are exceeding the 5.0 ppm TLV level, although it
could not substitute for the low volume sites or
sites where free foaming occurs. The automated
system may not be practical for all high volume
areas of production either.
The first corrective control that should be instituted is administrative controls at all
in-house foaming sites. The results of the study
clearly show marked reductions are gained when
more care in work practices are taken. The cleaning of foaming guns and the charging and discharging of solvent containers, where ventilation exists to carry vapors away from the workers, requires no capital expense and little additional time lost by either workers or supervisory personnel. This
action alone could reduce the TWA concentrations in the Low Volume areas below the TLV with a
significant margin of safety, and reductions
in the high production areas by potentially 70^ or
more have been documented.
The use of drainage tables should be studied
further. If the drain hole is sufficiently large so
that blockages are infrequent, less vaporized material
will evolve. Since 2-ethoxyethanol is water soluble,
splashed and dripped solvent might increase the effectiveness of this control. Changing the tabletop would require little cost to implement, would reduce some housekeeping, and improve safety conditions, preventing solvent spills. The true values of this control is admittedly still
somewhat unknown and measurements of its
effectiveness following implementation should be
made.
The use of the slot vent at the solvent tray as an
engineering control initially should only occur in the High Volume production areas. If the previously suggested controls do not significantly reduce the measured exposures in the low volume areas, then ventilation of the tabletops in these areas is also
recommended. The use of local ventilation will
reduce the TWA exposures in the High Volume areas well below the 5.0 ppm level. This control plus administrative controls are the minimum approach needed to reduce exposures to an acceptable level in these areas. Certainly the use of drained
tabletops would be helpful.
The use of 2-ethoxyethanol in the foam pad production
areas of the plant may be continued under safe exposure
reflected charcoal tube sample results at low concentrations (presumably levels that will be measured
after controls are instituted throughout the plant), they
might be used to make first-cut assessments of employee
8-hour TWAs with the controls in place. This could reduce the time and costs of sampling or, combined with charcoal tube sampling, thoroughly establish plant conditions. Charcoal tube samples should be taken in areas where
exposures are critical or where accidental contact with the
solvent might occur, invalidating the dosimeter measurements. Passive dosimeters may be used to sample the general work area or of worker transient through a foam site location. To highten their sensitivity, sampling should occur for periods of time in excess of 4 hours
unless saturation is anticipation.
Although the plant can continue to use 2-ethoxyethanol at production sites with confidence, a better and ultimate solution might be to investigate alternative solvents for the process. The substitution of another solvent that can give the necessary production results with a lower health risk (via toxicology, vapor pressure, concentrations, etc.)
might eliminate the need to proceed with or continue these recommended controls.
The continued use of 2-ethoxyethanol in this production process will require both administrative and
engineering controls. All areas should require the workers
study. This will reduce exposures in the low volume areas
below the 5.0 ppm TWA. However, in order to maintain the
TWA in the High Volume area, a slot hood at each tray table
should be constructed and in conjunction with the
administrative controls. This engineering control could be
accomplished for less than $5,000. Both of these methods
can be undertaken without alterations to the production
References
1) A.C.G.I.H., TLVs Threshold Limit Values for Chemical
Substances in the Work Environment, Cincinnati Ohio, 1985.
2) A.C.G.I.H., Documentation of the Threshold Limit
Values, 4th Ed., 1980.
3) Andrews, F.D. et. al., Teratological Assessment of
Ethylbenzene and 2-Ethoxyethanol, for NIOSH, Contract No.
210-79-037, January 1981.
4) Doull, John, Klaassen, Curtis D., and Andur, Mary 0.,
Casarett and Doull's Toxicology, The Basic Science of
Poison, 2nd Ed., Macmilllan, New York, 1980, pp 484.
5) Graef, H. R., Advisement to customers, E. I. DuPont de
Nemours and Company, June 1981.
6) Hickey, John L. S., American Industrial Hygiene Association Journal, Vol 42, Number 4, April 1981, pp.
264-267.
7) Langhorst, Marsha L. American Industrial Hygiene Association Journal, Vol 45, Number 6, June 1984, pp.
416-424.
8) Martin, Tim, and DeMasi, Dean, Personal communication.
May to October 1982.
9) Nagamo, K.; Nakayama, E.; Koyono, M. et. al., Japanese Journal of Industrial Health, Vol 29, 1979, pp.
29-35.
10) NIOSH, NIOSH Manual of Analytical Methods, 2nd
11) NIOSH / OSHA, "Occupational Health Guideline
2-Ethoxyethanol" Occupational Health Guidelines for Clinical
Hazards, Volumn E-0, September 1978.
12) Rose, Vernon E., American Industrial Hygiene
Association Journal, Vol 3, Number 8, August 1982, pp.
605-621.
13) Rowe, V. K., and Wolf, M. A., Patty's Industrial
Appendix A 2-EthoxYethanol
Analyte: 2-Ethoxyethanol Method No. S361
Matrix: Air Range: 340-1460 mg/cu m
OSHA Standard: 200 ppm (740 mg/cu m)
Precision (CV ): 0.059
T
Procedure: Adsorption on charcoal, desorption with methonal/methylene chloride GC-FID
Validation Date: 3/17/78
1. Principle of the Method
1.1 A known volume of air is drawn through a charcoal
tube to trap the organic vapors present. The sampling tube consists of a front adsorbing section and a backup section.
1.2 The charcoal in each tube is transferred to a vial and the 2-ethoxyethanol is desorbed with a solution of 5% methanol in methylene chloride and analyzed by gas
chromatography.
1.3 The area of the resulting peak is determined and compared with areas obtained from the injection of
standards.
2, Range and Sensitivity
2.1 This method was validated over the range of 337-1459 mg/cu m at atmospheric temperatures of 23,5 and
o
23.0 C, and atmospheric pressures of 757.1 and 770.3 mm Hg
than two-thirds of the 5% breakthrough capacity determined at 905g relative humidity when sampling a test atmosphere at 2 times the OSHA standard. This method is capable of measuring much smaller amounts if the desorption efficiency is adequate. Desorption efficiency must be determined over
the range used.
2.2 The upper limit of the range of the method is dependent on the adsorptive capacity of the charcoal tube. This capacity varies with the concentrations of 2-ethoxyethanol and other substances in the air (see Section
5.2) .
3. Interferences
3.1 When two or more compounds are known or suspected to be present in the air, such information, including their suspected identities, should be transmitted with the sample.
3.2 It must be emphasized that any compound which has the same retention time as the analyte at the operating
conditions described in this method is an interference.
Retention time data on a single column cannot be considered
as proof of chemical identity.