ABSTRACT
WILLIAM S« M'COY. Use of The Flavor Profile Method To Solve Taste and Odor Problems In Water Supplies. <Under the Direction of DR-FRAWCIS A. DIGIANO)
The Flavor Profile Method (FPM) was evaluated for use as
a practical tool to aid water managers in controlling
taste and odor in water supplies. A sensory panel using
students was organised and trained. Water samples from
throughout the Orange Water and Sewer Authority water
system were analysied by the sensory panel using the FPM.
The FPM is useful in investigating the source of taste
and odor problems and in monitoring the effectiveness of
treatment processes in removing tastes and odors. The
FPM is effective in eliminating the influence of outside
odors on the results. A trained sensory panel using the
FPM is able to detect presence of musty and chlorinous
odorants in water samples in concentrations above a
threshold value. Results from the sensory analysis of
samples indicate an enhancement of the chlorinous flavor
Ill
TABLE OF CONTENTS
Page
List of Figures v
List D-f Tables vi i Acknowledgements viii Chapter 1: Introduction 1 Chapter 2s Literature Review
Physiology and Chemistry of Taste and
Smell 5
Occurrence and Control of Taste and Odor In Water Supplies
Causes of Taste and Odor S
Earthy-Musty and Chiorinous Odorants 11
Control of Taste and Odor 15
Sensory Methods Used ESy Water Utilities 19
The Flavor Profile Method 20
Taste and Odor F^esearch Being Conducted Efy DreKel University 36 Chapter 3: Experimental Method and Design
Preparation For Panel Session 38 Panel Training 40
Panel Calibration 41 Application of the FPM to the Orange
Water and Sewer Authority 42
Chapter 4: Results and Discussion
Panel Training 51
IV
Page Application To OWASA 61
Effect of Musty Odorant On Chi orinous
Flavor Intensity 78 Manpower Ftequired To Implement The FPM 81
Chapter 5: Conclusions and Recommendations 84
References 87
Appendix A: Typical Flavor Descriptions and
Abbreviations Al
Appendix Bs Results From Training Sessions Bl
Appendix Cs Results From Regular Panel Sessions CI
LIST OF FIBUF^ES
Page
Ic The anatomy of smell 6
2: The anatomy of taste 9
3: The structure of MIB and geosmin 13
4s Correlation of earthy flavor intensities with
MIB concentrations 14
5: Concentration-versus-sensory response curves
for hypochlorous acid 16
6: Continuous odor monitor 21
7s Example of panel session results 35
8s University Lake sample location (plan view) 44
9s OWASA Water Treatment Plant process diagram
with possoble points of chemical addition 45
10: OWASA distribution system sample locations 46
11: Panel calibration with MIB standards 56 12: Panel calibration with free chlorine
standards 59
13: Odor descriptions and intensities for water
source on 7/19/85 66
14: Odor descriptions and intensities for water
source on 8/14/95 67
15: Odor descriptions and intensities through
water treatment on 7/11/85 69 16: Odor descriptions and intensities through
water treatment on 8/6/85 70 17: Odor descriptions and intensities through
water treatment on 9/4/S5 71 18: Odor descriptions and intensities through
vi
LIST OF FIGUF'ES (cont.)
Page
19: Odor descriptions and intensities through
water distribution on 7/24/85 74 20: Bench-scale treatment of raw water with 15
and 30 ppm powdered activated carbon 76
21: Bench-scale treatment of raw water with 30and 60 ppm powdered activated carbon 77 22: Field samples and standards chlorinated with
musty odorant present 79 23: Comparison of samples chlorinated with and
VI 1
LIST OF TABLFiS
Page
1: The seven primary odors 7 2x Typical causes and descriptions of odors 10
3» Taste reference standards 24
4: Odor reference standards 25
5« Flavor intensity scale 32
6: List of samples 49 7: Results of first training session <5/29/85) 52
3: Panelists used to conduct the F'PM 54
9: Panel response to taste and odor free water 62
"^"^B^S^-VI 1 1
ACKN0WLED(3EMENTS
I would like to thank the members of my committee for
their time and assistance; especially Dr. Francis A.
DiGiano, my research advisor, for his guidance and
suggestions. Also, thanks to the members of the sensory
panel 5
Wendy Fuscoe Ruthy Deer Bill Dowbiggi n
Anne Caston
Pam Reitnauer
Ronnie Karanjia
Without their time this research would not have been
possible.
Thanks to Stuart Krasner of the Metropolitan Water
District of Southern California for answering my
questions on the FPM, providing literature, and
performing a closed-loop stripping analysis on a raw
water sample from Chapel Hill, Thanks also to Irene
Taylor of the Philadelphia Water Department for allowing me to observe their sensory panel session and to Jeroen Bartels of Drexel University for providing me with
literature on taste and odor. Also, I appreciate OWASA
allowing me access to their facilities and the
Chapter 1
INTRODUCTION
Objectionable taste and odor is one of the primary water quality problems facing water managers. Numerous
episodes of taste and odor outbreaks e;-;tending across the world are cited in the literature, with the earthy-musty
odors produced by actinomycetes and blue-green algae
being by far the most common. Utilities have found these outbreaks difficult to predict and the cause of the taste
and odor hard to prevent and treat.
The American Water Works Association (AWWA) Research
Foundation has included minimizing taste and odor in drinking water as one of 18 major research topics in
their 5 Year Plan (1). Other indicators of the problem's
importance include sessions dedicated to taste and odor
at the 1984 AWWA Water Quality Technology Conference and the 1985 AWWA Annual Conference.
Among the many methods used by utilities to measure the intensity of the odor, the Threshold Odor Number (TON)
method as described in Standard Methods (2) is the most
It. has been noted to give inconsistent and sometimes
inaccurate results. Moreover, it is not a practical tool
for pinpointing a taste and odor problem because it
cannot be used to identify and distinguish one source of
taste and odor from another (3,4,5,6).
Problems with the TON method prompted the Metropolitan
Water District of Southern California (MWDSC) to search
for a new method that would aid in identifying and
solving taste and odor problems throughout their system.
MWDSC in conjunction with Arthur D. Little, Inc. modified
the Flavor Profile Method (FPM) for use by the water
industry as a replacement for the TON method. The FPM
had been used for years by the food, beverage, and
pharmaceutical industries (3).
The FPM is a descriptive method and is influenced by the
total fleaver of a sample, which includes taste, odor, and
feeling factors. A group of trained panelists
individually analyses samples for aroma and
flavor-tay~mout.h under controlled conditions. The panel
discusses the; individual findings, resolves any
conflicts, and agrees to a flavor profile for the sample.
This flavor profile is a description of all flavors, the
order that they were perceived, and the intensity of each
The FF-'M is a sensory technique and, as a result, is
subjective. The Method's purpose is not to determine
concentrations of odorants and be used as a replacement
for our analytical instruments, but to detect, presence of
an odorant and to aid in evaluating water treatment
effectiveness.
Use of the FPM by the water industry is limited at this
time to a few of the larger utilities and a research
project at Drexel University. MWDSC uses the FPM
extensively for routine monitoring throughout their system and as an aid in solving specific taste and odor problems <3,a,9)„ Drexel University is using the FPM as
part of a research project on taste and odor. The Drexel
project includes use of the F"PM by the Philadelphia Welter Department, The Philadelphia Suburban Water Company, and the Societe Lyonaisse des Eaux et de I'Eclairage
(1,8,10).
This research was undertaken to obtain some practical
experience with the FPM. The following objectives were
established:
to evaluixte use of the Flavor Profile Method by
water managers £is a detector of and as an aid in controlling earthy-musty and chlorinous odorants
in water supplies. Thiis objective was
accomplished with samples taken from selected locations in the Orange Water and Sewer
Chapter 2
LITERATURE REVIEW
E\tlYsiglggi;:_and_Chemi_str;y:_gf_Taste_an
Flavor is a combination o-f taste -from the tongue, odors
from the nose, feeling factors from the mouth and nose,
and aftertastes. When a sample is tasted, we evaluate
its flavor. When the? sample is smelled, we assess only
its odors and feeling factors from the nose. Feeling
factors include burning, cooling, gritty, numbing,
astringent, etc. i7).
Odor is perceived when air is drawn through the nostrils
to the olfactory area (Figure 1). According to the
stereochemical theory of odor as presented by Amoore
(11), this area contains nerve endings and receptor
sites. A primary odorant fits into a receptor site,
similar to the site specific enzyme reaction, and
triggers a nerve signal through the olfactory bulb to the brain.
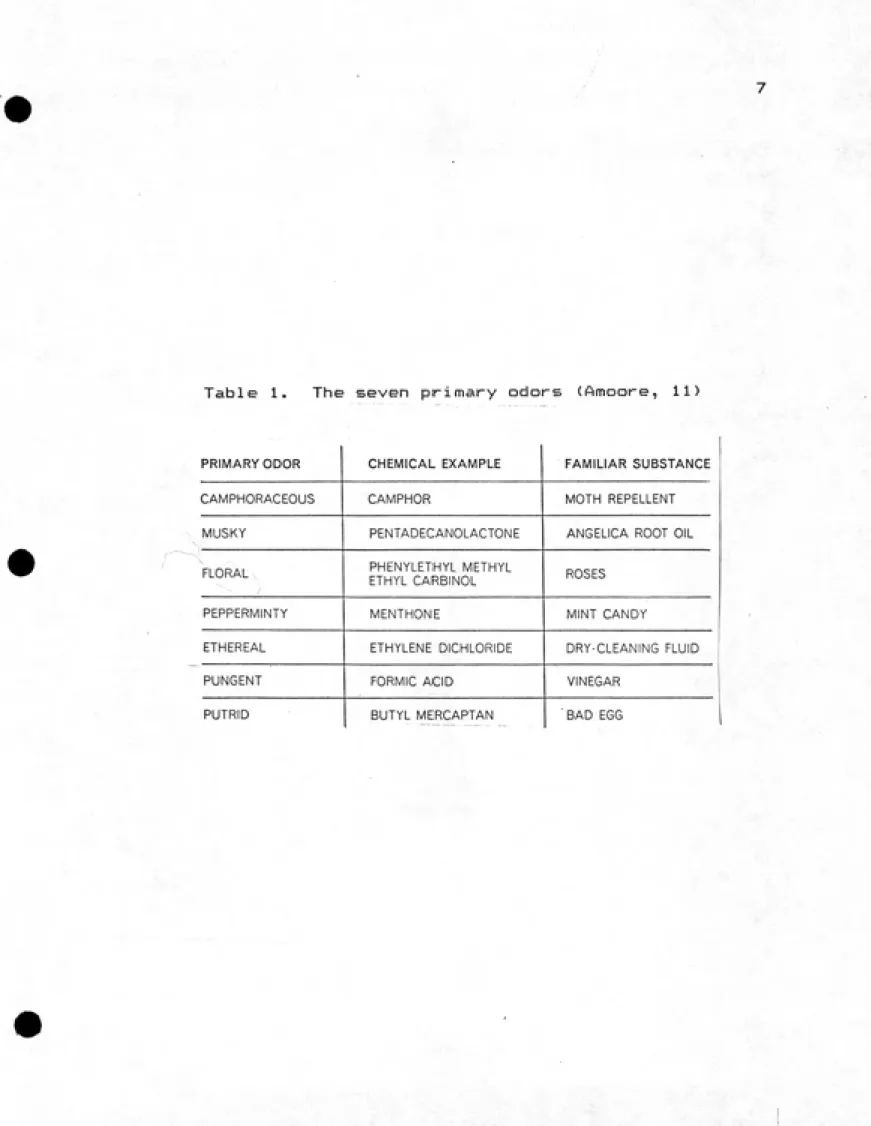
The seven primary odorants ars listed in Table 1. All
OLFACTORY BULB OLFACTORY AREA TURBINATE BONES
TONGUE
«o
Table 1. The seven primary odors (Amoore, 11)
PRIMARY ODOR CHEMICAL EXAMPLE FAMILIAR SUBSTANCE
CAMPHORACEOUS CAMPHOR MOTH REPELLENT
MUSKY PENTADECANOLACTONE ANGELICA ROOT OIL
FLORAL PHENYLETHYL METHYL
ETHYL CARBINOL ROSES
PEPPERMINTY MENTHONE MINT CANDY
ETHEREAL ETHYLENE DiCHLORIDE DRY-CLEANING FLUID PUNGENT FORMIC ACID VINEGAR
8
more primary odorants- To be an odorant, a molecule must
be volatile to reach the olfactory area. Odor is
perceived during tasting because volatiles rise behind
the tongue to the olfactory area. An odorant must be water soluble to penetrate the moist skin of the
olfactory area. Finally, an odorant must be soluble in
lipids to reach the nerve endings (11).
Taste is influenced by only four factors: sweet, sour, salty, and bitter. These taste factors »re perceived when specific taste buds on the tongue are chemically
stimulated (Figure 2) (3).
QE£yrX§D£l...§Qd..CDntgl _of _TastB_ and^Odor„In_Wa
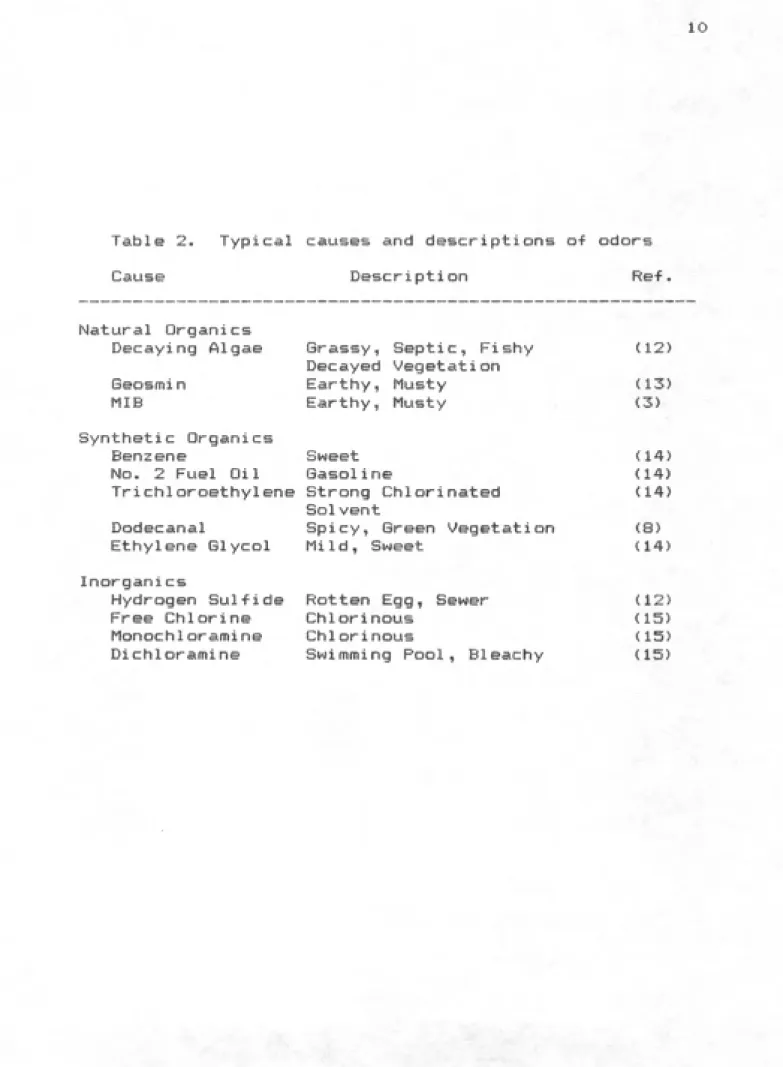
Causes of Taste and Odor. The sources of taste and odor
may be divided into three groups: natural organics,
synthetic organics, and inorganics (Table 2)- Odor from
natural organics may be produced by the decay of
organisms, by metabolites, or by organic chloramines.
Industrial discharges or spills are usually the source of
odor from synthetic organics. Odor producers in the last
^*'^sr'
SnvA.r
S=.H
1
oar
S:^H
/
Suj^^i"
10
Table 2. Typical causes and descriptions o-f odors
Cause Description Ref
Natural Organics
Decaying Algae Grassy, Septic, F-ishy (12)
Decayed Vegetation
Geosmin Earthy, Musty (13) MIB Earthy, Musty (3)
Synthetic Organics
Benzene Sweet (14) No- 2 Fuel Oil Gasoline (14)
Trichloroethylene Strong Chlorinated (14)
Solvent
Dodecanal Spicy, Green Vegetation (S) Ethylene Glycol Mild, Sweet (14)
Inorganics
Hydrogen Sulfide Rotten Egg, Sewer (12)
Free Chlorine Chlorinous (15) Monochloramine Chlorinous (15)
11
such as salts and metal ions may cause objectionable
taste (12).
When two or more odorants are together in a sample, we
may perceive an odor description and intensity entirely
di-f-ferent from what we detect with the individual
odorants. The odor intensity will change by one of three
phenomena (16):
1. Additivity- sum of the individual intensities
2. Synergism - more than the sum of the individual
intensiti es
3. Antagonism- less than the sum of the individual
intensities
Earthy-Musty and Chi orinous Odorants. The earthy-musty
odor seems to be the most prevalent cause of taste and
odor problems throughout the world: from here in the
United States to The Netherlands (17), Japan (18), Israel (19), and Finland (20). These odors can be produced by
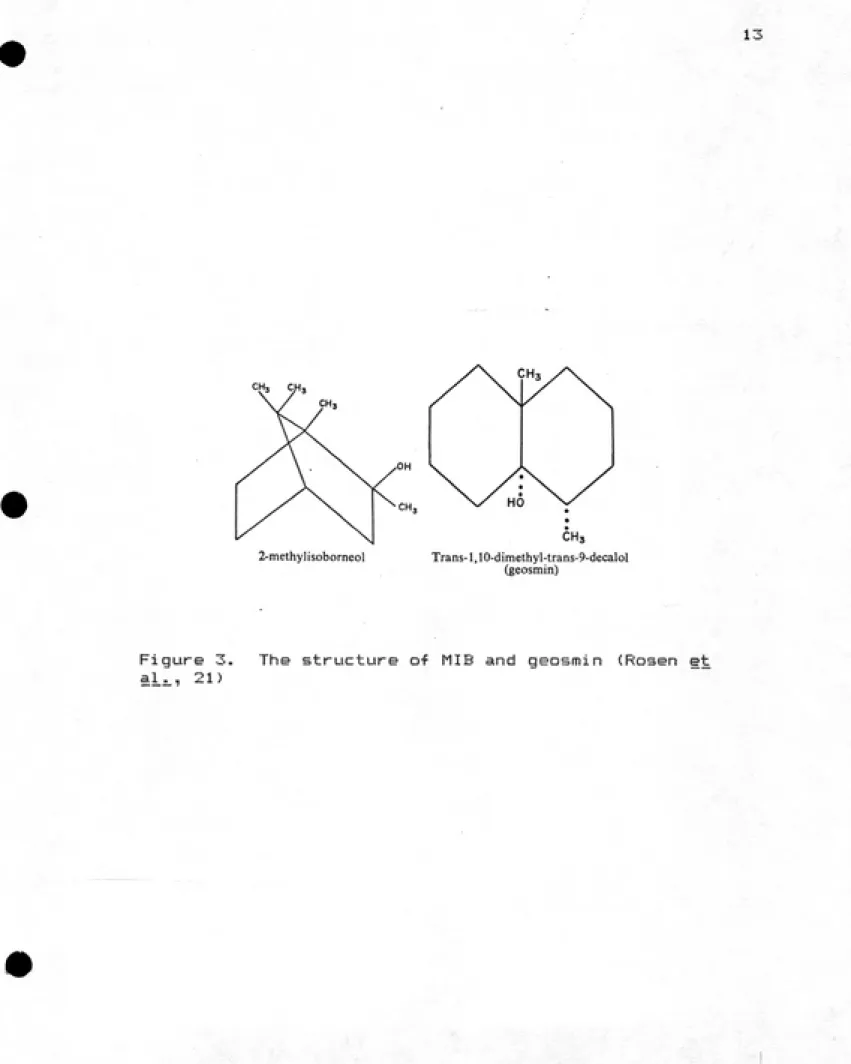
any one of five compounds (21,221):
MIB (2-methylisoborneol)
geosmin (trans-1,10-dimethyl-trans-9-decalol)
IPMP (2-isopropyl-3~metho;;ypyra2ine) I BMP (2-isobutyl~3-metho;;ypyra2ine)
TCA (2,3,6-trichlorDanisole)
MIB and geosmin are the most common of the earthy-musty
odoraints. Of the five, they are the only compounds
12
is a metabolite of actinomycetes (genus Streg.tDmyces) and blue-green algae (genera Qsclllatoria, Lyngbya, Sy.mBl_9£.§;? and Anaisaena) . MIE< is also a metabolite of StreBtgmyces
and blue-green algae (genera Qsci_l,l,atgri.a and Lyngbya)
(23,18). Both compounds are saturated cyclic tertiary
alcohols (Figure 3) (23).
The ability of the senses to detect MIB and geosmin at
very low concentrations is one of the reasons these
compounds are so troublesome- Figure 4, which is based
on work performed by Krasner et_a_l^ (3) at liWDSC, shows
a sensory panel's perceived intensity of earthy-musty
odor at various MIB concentrations. Intensity as a
function of the logarithm of concentration is a straight line relationship as predicted by the Weber-Fechner Law
(5). This is an empirical law and, interpreted, means that as the concentration of an odorant increases, the
perceived intensity of the odor will be less than that
predicted by a linear relationship. From the graph, we
see that 1 to 3 ng/1 of MIB in taste and odor free water
can be perceived by the human senses. Even in the
samples, which contain background odorants, 3 to 5 ng/1
MIB is detected. Researchers have found geosmin to have
13
2-methyl isoborneol Trans-l,10-dimethyl-trans-9-decalol (geosmin)
14 100 80 60 50 40 30 20 O) c^ 15 -J O LU 2 CC O m 10 o CO _J >- B X H-LU s w 6
§
q
D MIB STANDARD O SAMPLE
1 11/2 2
EARTHY FLAVOR INTENSITY
2 1/2
15
Chlorinous odors are a concern, especially in the United
States, due to the widespread use of free chlorine and
inorganic chloramines as drinking water disinfectants.
Krasner and Barrett (15) found monochloramine to be
relatively non-odorous: concentrations up to 3 mg/1 as C12 had a slight intensity at most. Concentrations of monochloramine above 3 mg/1 contained significant amounts
of dichloramine, a strong odorant. They found that
dichloramine above 0.5 mg/1 as C12 had an objectionable
bleachy, swimmimg pool-like odor. The odor intensity of
free chlorine falls in between the two chloramines. The
threshold odor concentration for free chlorine was found
to be about 0,3 mg/1 as CI2. Figure 5 is a plot of intensity vs. concentration for one component of free chlorine, hypochlorous acid. Hypochlorite exhibited the
same chlorinous odor and similar intensities.
Control of Taste and Odor, Water utilities use a variety
of methods to treat taste and odors at the plant. Some
methods ares chemical oxidation with chlorine,
chloramines, chlorine dioxide, ozone, or potassium
permanganate; adsorption with powdered or granular
activated carbon; and stripping by aeration. The best
treatment to use depends on the situation, but, in
16
3 r
2Va >• 09 Z UJ lU (O z o 0. V3 Ui cc I >• cc o (0 z m 03 r/j O AROMA D FLAVOR
FLAVOR
U Z 1
oc o X c )( 0.1 AROMA
0.2 0.5 1 2 5
HYPOCHLOROUS ACID AS CI2 (mg/L)
10
Figure 5« Goncentratlon-versus-sensory response curves for
effective (8). Retahun et__al.._ (24) found that
chlorination reduced the earthy-musty odors produced by
cultures of Qsci.l^iatoria, but. many studies of natural
waters note an intensification of the odor (25,24,4).
McBuire et_al.i. <4) suggest that chlorine effectively
oxidises other odorants in the sample leaving
earthy-musty as the predominant odorant.
Treatment at the plant may be the best method of control
for a large water supplier, such as Cincinnati, whose
source is difficult to protect- But for other utilities
there may be a more cost effective solution. The cost of
treatment is illustrated in the following example. A
30-mgd water treatment plant experiencing problems with
earthy-musty odors from MIB and geosmin spent #150,000 in
1981 on powdered activated carbon (PAC) and potassium
permanganate (KMn04) just to reduce the odor level. This
cost was 50'/. of their total chemical costs for the year
(26). This utility and others having control over their
source water may benefit by attending to the cause of the
problem in addition to treatment at the plant.
Numerous methods exist to control the cause of natural
18
destrati-fication. Algalcides such as copper sul-fate will destroy blue-green algae which is a source of food for another producer of earthy-musty odors, Streptgmycetes
(27). Biological oxidation involves the application of
Bacil^lus species to consume the odorous compounds produced by actinomyces (27,28). The objective of
reservoir destratification is to interupt the life cycle of planktonic taste and odor producers. For producers attached to the bottom, this method is not effective
(8) .
Bood watershed and water storage system management can be very effective in reducing taste and odor- Control of industrial discharges and organic and nutrient loads into source waters will reduce synthetic and natural odor
producers, respectively. Reservoirs that cause taste and odor problems may be bypassed temporarily so raw water to
the treatment plant is of good quality (S).
MWDSC has a unique and very effective approach to solving
taste and odor problems. They combine sensory
evaluation, analytical measurements, microbial culturing and analyses, and field sampling and observations to identify the odorant and the cause (4). Sensory
19
the closed loop stripping analysis (CLSA) with BC/MS. This sensitive instrumental method is necessary to detect the low concentrations of many odorants. Many of MWDSC's
solutions focus on the odor's cause and have included:
treatment of an Qsci_l.l.atori.a bloom with copper sulfate <29) and implementing a new procedure for repair of fabric-covered reservoirs (9).
Sensory„MethQds_ysed_BY_Water_Ut j^l.lti^
The Threshold Odor Number (TON) method has been the most
frequently used sensory technique in the water industry. The method involves repeated dilutions of a sample until the tester can barely detect the faintest odor
(threshold odor) (2). Due to the Method's design, the
most intense odor will control the result. This is
acceptable in instances of gross contamination, but often
we are concerned with a less intense odor that is more
objectionable or with multiple odorants. Other problems
with the TON method aire the alteration of odor ant
characteristics with dilution and inconsistent results, since one person can conduct the test but each person's
odor sensitivity is different (3,4).
20
monitoring. One example is a method used by the Atlanta Water Works. Air is bubbled through a vessel containing raw water (Figure 6), the odor is stripped out, and exits
through the top -for sensory evaluation (25), This
"continuous odor monitor" is located at the plant, so the sensory evaluation is performed by under uncontrolled conditions. Background odors in the plant would make
detection difficult. One would expect that the results
from this method are inconsistent and unreliable.
Ibii„Eli(V9!r...£!I2f-il?_dgthDd
The FPM is a versatile sensory technique that applies
well to the water industry- The Method is descriptive in
that it characterizes the entire flavor of the sample,
not just the most outstanding intensity as with the TON method. Description of the flavor helps the water
manager identify its cause and reporting the entire
flavor allows treatment of a less intense but more
objectionable odor. The Method lends itself well to
assessing the^ impact to taste and odor by treatment
processes or any other stimulus. Since it is based on the use of a trained panel, the Method is consistent and
21
Odor Driven Off
O
o
o '^ o o
O O c> O
O O ^ ^ Q
fashion consumers ingest the product: in contrast to the
TON method, which alters the sample through dilution.
Cairncross and Sjostrom (30) developed the FPM in 1949
and since then it has been used in the food, beverage,
and pharmaceutical industries. Being dissatisfied with
the TON method, MWD and Arthur D. Little, Inc., a consultant having eKtensive experience in the flavor evaluation field, adopted the FPM for use in the water industry (3). The principle of the Method is that a
sample is analysed by a trained panel for aroma or odor
and for flavor (by mouth). Each panel member describes
all flavors and notes the intensity of every
description-The panel discusses the individual results, resolves any
discrepancies, and arrives at a composite flavor profile
for the sample (7). A description of each important
e?lement of the FPM follows!
1. Selection of The Panel.
A minimum of four panelists is required, but at least six
people should be trained in case of absences. Panel
members are motivated, intelligent, and have normal
flavor sensitivity. They may be selected from employees
or volunteers or may be hired specifically for this
23
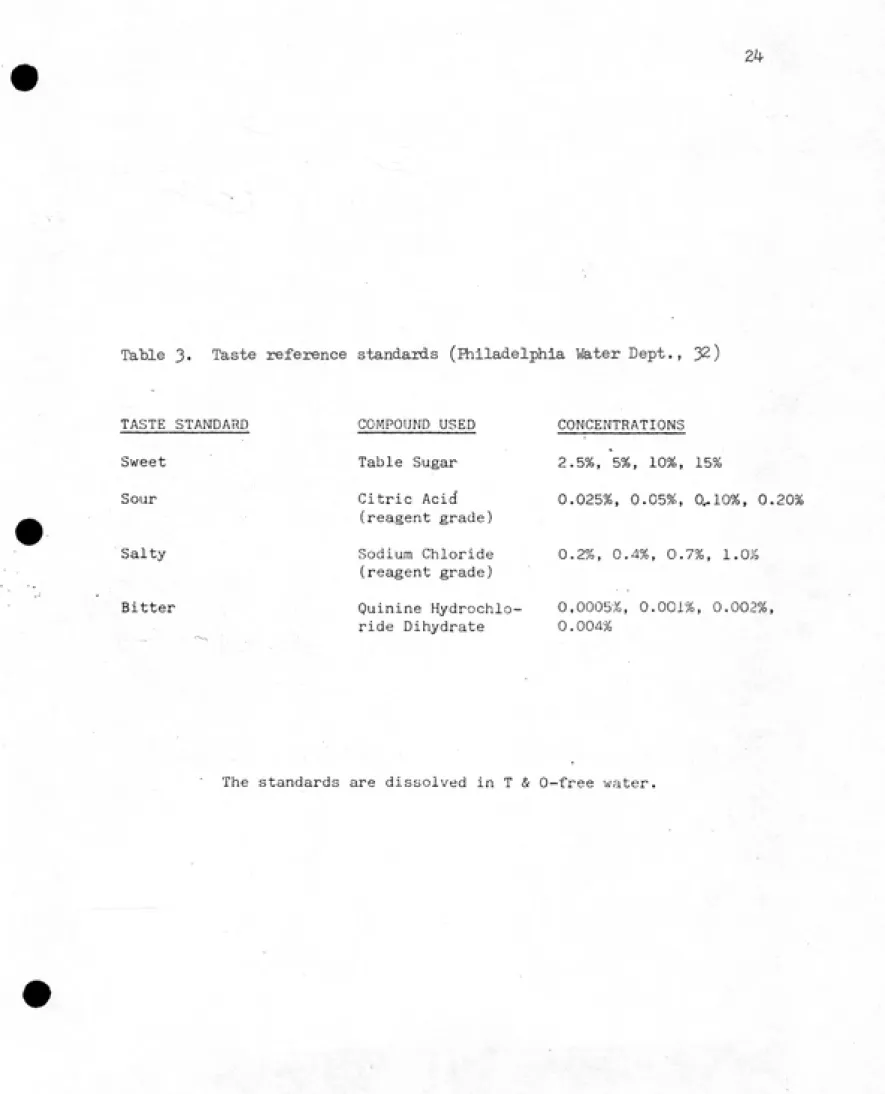
Members &rs selected by a screening process consisting of
three steps. First, they are tested for taste
recognition. The chemicals listed in Table 3 are
dissolved in taste and odor free water and presented to
the prospective panelists in odorless plastic cups. An
acceptable result is recognition of all four basic
tastes. Flavor intensity depends on temperature, so it is important for all samples to be at a consistent
temperature (7). The Philadelphia Water Department
substitutes the taste recognition test with a
standardised scratch and sniff test that detects
olfactory problems instead of taste sensitivity - The test is called the University of Pennsylvania Smell
Identification Test (UPSIT) (31) and is available from
Bensonics, Inc. (408 S. 47th St., Philadelphia, PA 19143, tel. 215-471-4117) (32).
Second, the prospective panel members s.re tested for odor recognition (32). A series of odor reference standards Bre presented to the panel for identification. The standards used by the Philadelphia Water Department are
listed in Table 4. The chemicals and concentrations used as standards should be checked against references on
chemical toxicity for the protection of the panelists. A scoring system as that developed by Caul (7) may be
zi^
Table 3. Taste reference standards (Hilladelphla Water Dept., 32)
TASTE STANDARD
Sweet
Sour
Salty
Bitter
COMPOUND USED
Table Sugar Citric Acid'
(reagent grade)
Sodium Chloride
(reagent grade)
Quinine Hydrochlo¬ ride Dihydrate
CONCENTRATIONS
2.5%, 5%, 10%, 15%
0.025%, 0.05%, 0^10%, 0.20%
0.2%, 0.4%, 0.7%, 1.0%
0,0005%, 0.001%, 0.002%,
0.004%
25
Table ^
ͣ
. Cdor reference standaids (A¥WA, 8)
PHILADELPHIA WATER DEPARTMENTTASTE AND ODOR PANEL
Odor reference standards are used to train the panelists and develop consistency among the panel. Specific quantities of a pro¬ duct or chemical are placed in a 500 ml. Erienmeyer, usually with 200 ml. of odor free water, and sniffed at room temperature.
ODOR DESCRIPTIVES Almond, sweet Bleach, sweet Chlorinous Cucumber Cucumber
Earthy, musty, potato Fruity, sweet Garlic Geranium Grassy Grassy Hay, straw Hexanal Medicinal, sweet Moth balls
Musty, earthy, peaty
Onion
Pepper, musty
Perfumy, sweet
Rubber hose
Rubber hose, shoe polish
Septic
Septic, sludge
Spicy
Vegetation, decomposing Varnish, paint
ODOR REFERENCE STANDARDS
500 ppb benzaldehyde
monochloramine (60 ppm chlorine,
20 ppm ammonia) 2 ppm free chlorine 75 grams of cucumber 200 ppb nonenal 25 ppt geosmin 200 ppb nonanal 75 grams of garlic
geranium flowers or leaves 2 grams of fresh grass 500 Rpb 3-Hexen-1-ol
dry hay
2,000 ppb hexanal 500 ppb m-Xylene
several crystals of p-Dichlorophenol
50 ppt 2-raethylisoborneol 75 grams of onion
75 grams of green pepper
1,000 ppb methylisobutyl ketone water that was heated with rubber
hose in it
500 ppb cumene
2 grams of grass after several days
paper mill sludge
3-^ cloves
2 grams of grass after several days
industrial varnish plant effluent
5 points for e^act identification
4 points for association (vinegar for acetic acid) 3 points for description (fishy for cod liver oil) 2 points for vague description (cooling for camphor)
Using 20 odor standards, a score of 70 is desirable.
Fewer odor standards may be used.
Third, an odor intensity test is given. Various
concentrations of an odor reference standard in taste and
odor free water Arm smelled by the prospective panelists
using the procedures for evaluating odor described later
in this section. The samples should contain several
concentrations in the threshold range. A response very
much different from the known threshold value would be
unacceptable (32).
The prospective panelist may be interviewed before a
final decision is made (7). The interview is used to
find out if the person is motivated and intelligent.
Also, he or she cannot be dominating or must be willing
to assume an equal voice with the other panel members,
and he or she must be in good health (7).
The selected panelists are trained before they begin the
first assignment. Training includes classroom
0"7
mechanics of the FPM- Using the FPM procedure described
later in this section, the panel spends several sessions
producing flavor profiles of the taste standards, odor
standards, and water samples from local supplies.
Prior to beginning a FPM assignment, the panel must be
oriented to the nature of the taste and odor problem
being investigated. The results should be more thorough
if the panel knows the types of tastes and odors to
expect (7). Krasner (33) found that prior knowledge of
the sample identity did not significantly bias the
panelist's response.
2. The Panel Leader
The panel leader, an equal member of the panel, should be a regular employee with a knowledge of chemistry. The leader makes all the preparations for the panel sessions
to includes scheduling the panel, cleaning the
glassware, collecting the samples, preparing the standards, purchasing needed supplies, preparing the samples for the panel, moderating the panel discussion,
presenting the results to management, and selecting and
28
other panelists, but. he or she is responsible for
ensuring individual parti cipc*ti on (7).
3. The Testing Area
The area, used to conduct, the sessions must be clean, quiet, well lit, free of outside odors, and temperature controlled, A board to record the results and a large table to seat all the panelists is necessary. Members of the panel must not eat or smoke 15-30 minutes prior to testing. To ensure that no outside odors are present, panelists camnot wear perfume, cologne, or any cosmetic with a significant odor; and they must wash their hands with odor-free soap (Ivory) (3).
4. Sample Collection and Preparation
Glassware must be odor-free. One of the following two cleaning procedures is recommended: 1) wash in warm tap water and detergent, rinse five times with warm tap
29
distilled, deionized, carbon-filtered water. Bottles cleaned using the first procedure should be filled with
100-200ml of taste and odor free water before storage <3,34) . _* , '".;
Samples are collected in glass bottles with Teflon-lined
caps. If the sample is from a tap; remove aerators, let
it run for five minutes, then rinse the bottle several times from the spigot. Samples must be kept on ice or refrigerated @ 4 degrees C until tested. The
refrigerator should not be used for chemical storage.. Samples must be tested no more than 24 hours after col lection (3).
The FPM specifies that all analyses be performed on samples at room temperature (25 degrees C). The
Philadelphia Water Department modified the procedure for
odor analysis so the sample is heated to 45 degrees C.
The reason for heating the sample is to enhance the odors
as happens during cooking and bathing. The sample is analysed from a stoppjered flask to contain the odors. If odor analysis is performed on samples at room
temperature, then 2 ounces of the liquid is given to the
panelist in an odorless plastic cup and covered with a
watchglass. Taste is also analyzed from plastic cups and
30
analysis, only if both taste and odor samples are at room
temperature (3,34).
Duality control of sample collection, sample preparation, glassware cleaning, and the panel calibration consists of
a taste and odor free water sample, a duplicate sample, and an odor reference standard sample of certain
concentration, all included with the set of "unknown" samples. If odor is analyzed from heated samples, then two sets of samples are used so no more than three
panelists use each flask. Odor intensity will diminish after continued use. The number of samples analysed during each session should be limited so as not to cause fatigue or extend beyond one hour.
5. Analysis of Odor
For samples to be analyzed at room temperature? the cup is swirled, the watchglass is removed, then the panelist sniffs the sample a few times with their hands below the table. The senses become fatigued after a few sniffs so additional smelling will not detect the odor. The
31
After each sample is smelled, the descriptions of all odors in the order they are perceived and the intensity of each description are noted. Flavors perceived first and last are usually the most important. Descriptions or "character notes" s.rB agreed upon and listed by the
panel. If a panelist detects a character note that is not listed and the other members of the panel do not
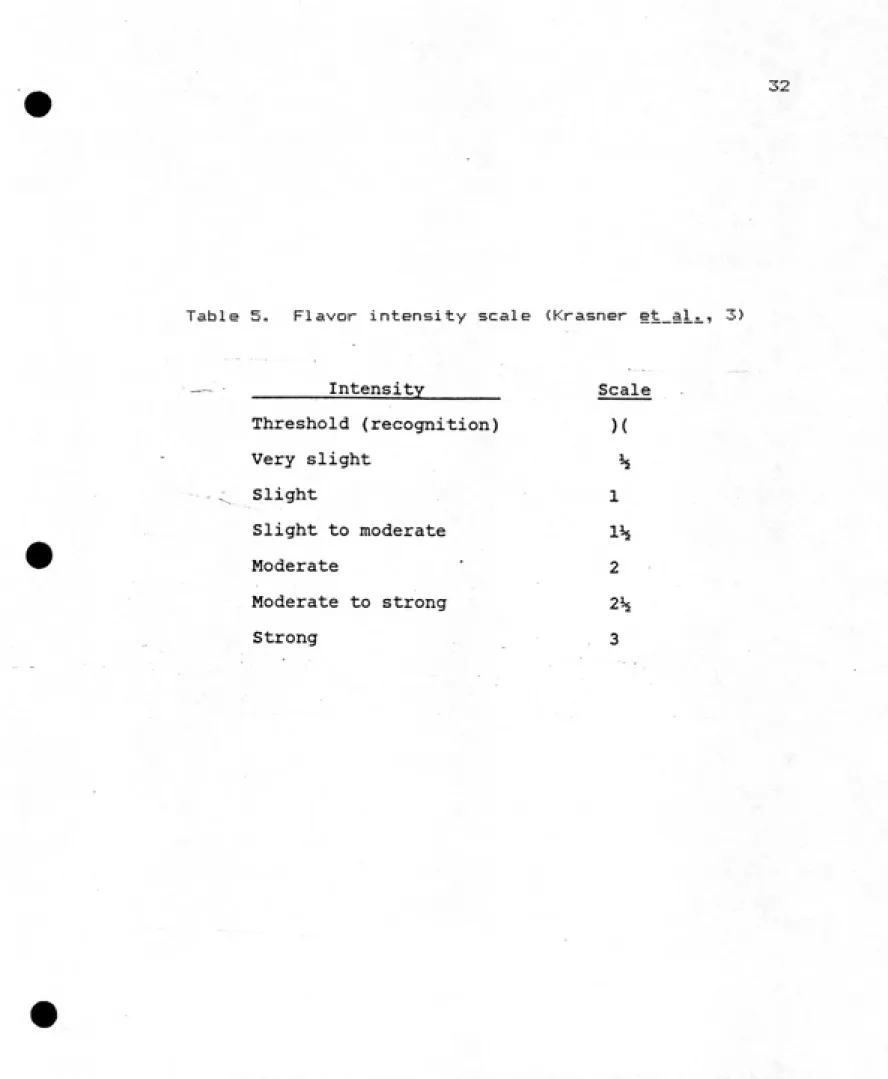
perceive it, then that person must bring in a reference standard for the new note. This system will expand the flavor vocabulary of all panelists. The character notes used by the Philedelphia Water Department (34) are listed in Appendi;-; A. The intensity scale is listed in Table 5. An intensity rating corresponds to a specific
concentration of a reference standard as determined by
the panel
(3)-Eietween samples the panelists should clear their senses by sniffing taste and odor free water- Strong flavors can dull the senses so samples should be analyzed
beginning with the least flavorful to the most flavorful
(3). ' .
Table 5n Flavor intensity scale (Krasner et_al_i., 3)
Intensity Scale
Threshold (recognition) )(
Very slight h
- ^.. Slight 1
Slight to moderate IH
Moderate 2
Moderate to strong 2H
touching the flask's neck, it is shaken vigorously to
release the aromatics? the stopper is removed; and, while
holding the bottom of the flask, the sample is sniffed a
f ew t i mes (34).
6. Analysis of Flavor
Samples are always analysed for flavor after odor
analysis. This order is helpful because the odor
analysis will alert the taste-tester of what to expect in
the flavor (.7). Water that may contain pathogens should
not be tasted. The panel should agree on what type of
waters are safe.Flavor is analysed by sipping the sample, rolling it over
the entire tongue to contact, all taste areas, and then
swallowing. The liquid should be "slurped" to release
aromatics to the olfactory area. One or two more sips
are taken; then the panelist writes down all descriptions
in the order perceived, with intensities. The senses are
cleared between samples with taste and odor free water
rs4
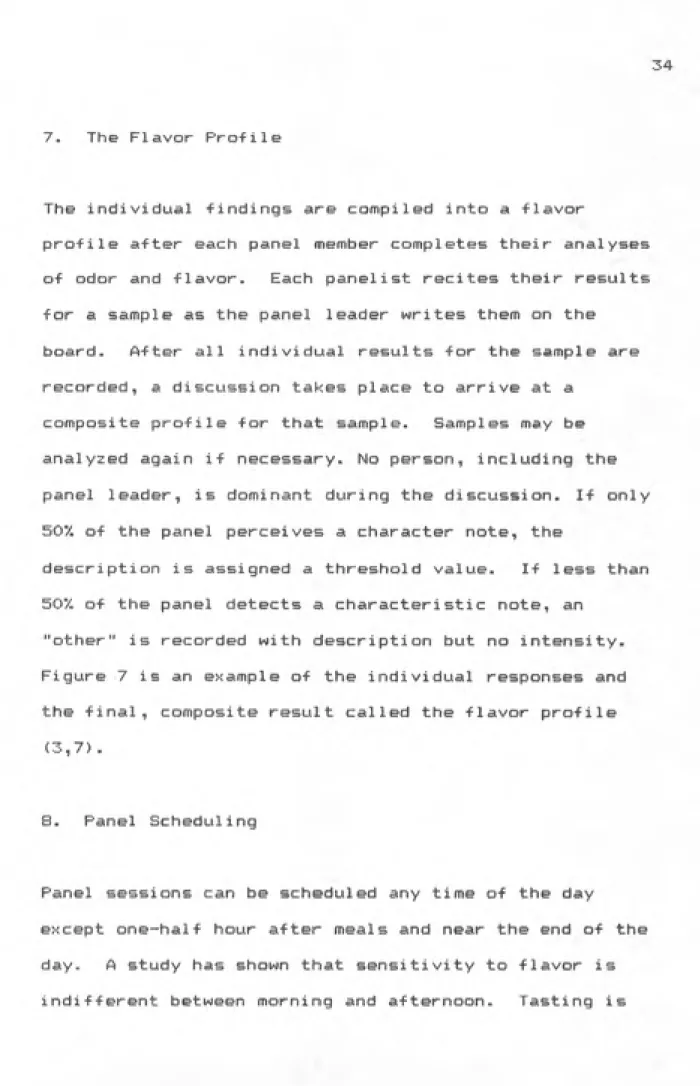
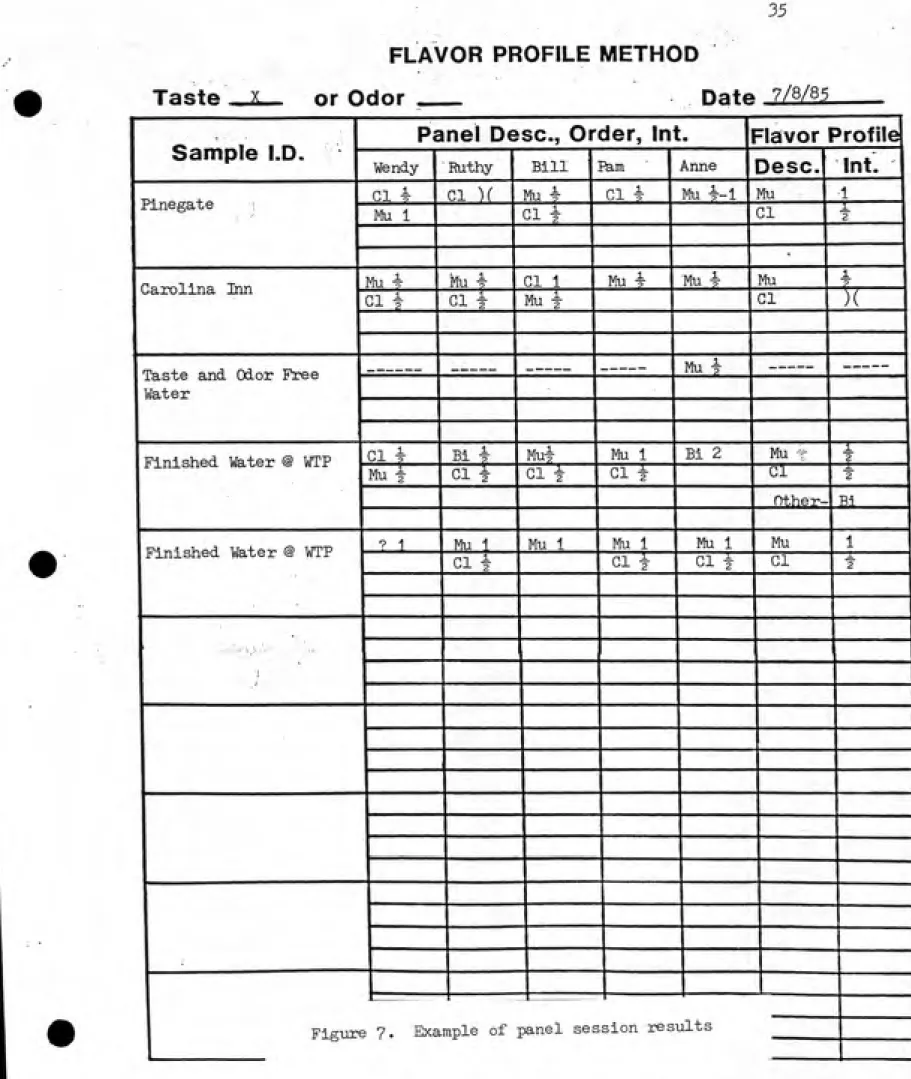
7. The Flavor Profile
The individual findings e^re compiled into a flavor
profile after each panel member completes their analyses of odor and flavor. Each panelist recites their results for a sample as the panel leader writes them on the
board. After all individual results for the sample e^re recorded, a discussion takes place to arrive at a
composite profile for that sample. Samples may be
analyzed again if necessary. No person, including the
panel leader, is dominant during the discussion. If only
507. of the panel perceives a character note, the
description is assigned a threshold value. If less than
507. of the panel detects a characteristic note, an
"other" is recorded with description but no intensity.
Figure 7 is an example of the individual responses and
the final, composite result called the flavor profile
(3,7).
8. Panel Scheduling
Panel sessions can be scheduled any time of the day
except one-half hour after meals and near the end of the
day., A study has shown that sensitivity to flavor is
35
Taste —i
FLAVOR PROFILE METHOD
or Odor ____ Date-ZZMl
Panel Desc, Order, Int. ||
Flavor Profile
Sample I.D.
Wendy Ruthy Bill I^m ͣ Anne
Desc. Int.
CI 4 CI )( Mu 4 CI 4
Mu 4-1 Mu -1
fanegate i
Mu 1 CI i
Gl i
2
ͣ
Carolina Inn Mu 4 Mu -5- CI 1 Mu 1- Mu 4 Mu 1
cii CI i Mu i CI 1 )(
Taste and Odor P^e Water
_______
Mu
y-Finished Water @ WTP CI 4 Bi4 Mul- Mu 1 Bi 2 Mu -T 12
Mu f CI t Gli CI t Cl 2
nther- Bi
Finished Water @ WTP ? 1 Mu 1. Mu 1 Mu 1 Mu 1 Mu 1
Clf cit CI t Gl 2
ͣ
::-'-ͣ>.::;ͣ.•ͣͣ,:, ͣ/ͣ^, ͣ
...:"- .- .,
3&
not appeal ling after meals and work pressure may be a
problem at the end of the day (7). Frequent testing is
necessary to keep senses sharp; the MWDSC panel meets
three days per week (8). '
Iaste_and._gdor_Re5earch_Bei^ng_Conducted_By_
UQlyiCllty
Dre;;el , in association with the Philadelphia Suburban
Water Company (PSWCo), the Philadelphia Water Department
(PWD), and the Societe Lyonaisse des Eaux et de
I'Eclairage (SLEE) is conducting a project dealing with taste and odor. The objectives arei 1) to identify taste
and odor producing compounds, 2) to evaluate the
effectiveness of various treatment processes in removing
these compounds and publish the results in a manual, 3) to develop odor reference standards for use with the FPM, and 4) to make an inter-laboratory comparison of the FPM
To identify taste and odor producing compounds? PSWCo,
PWD, and SLEE are performing the FPM sensory analysis on
water samples from local supplies. The samples were also analysed by CLSA and simultaneous distillation extraction
(SDE). Compounds identified from the instrumental
37
analysis are being correlated using the statistical
method of factor analysis. The result will be a listing
of odor descriptions and the compound(s) that may cause
that odor (8).
That portion of the research dealing with treatment of
taste and odor is aimed at developing a manual for use by
utilities with taste and odor problems. Drexel is
evaluating the effectiveness of coagulation and
filtration, chlorination, chloramination, oxidation with
chlorine dioKide, oxidation with potassium permanganate,
adsorption with PAC, adsorption with GAC, and air
stripping on a wide range of synthetic and natural
odorous compounds; all of these methods are being
evaluated on a bench scale. Preliminary results, which do not include treatment by GAC, show PAC adsorption to
be the most effective (3,10).
The results of this study are to be presented at the 1986
AWWA Annual Conference. The project director is Dr. I.
Chapter 3
EXF^'ERl MENTAL METHOD AND DESI6N
E\C§Bi!!ri§ti9D._.Zor...Panel__Se5siDn
The work required prior to conducting a panel session
includes: washing glassware, gathering other materials, collecting samples, mixing standards, and preparing all samples -for presentation to the panel. The glassware used -for collecting samples and mixing standards were 32 D2. flint glass bottles w/ screw cap (Fisher Scientific #
02-aS3EE). The caps were Teflon lined. For odor
analysis, 500 ml Wheaton 900 amber glass bottles w/ ground glass stoppers (Fisher Scientific #02-91SB) were used. These stoppered bottles helped to contain the volatile odorants. Tinted glass is not necessary; clear bottles could be used instead. Plastic cups were covered
by watch glasses (75 mm diameter).
39
then rinsing three times with taste and odor free water. The detergent used was Sparkleen -from the Fisher
Scientific Co. and a Scotch-Brite Kitchen Scrub-Sponge
from the 3M Corp. was used to scrub the outside of the
glassware. The inside of the bottles were scrubbed with
a tube brush. The taste and odor free water used
throughout the project was Spring Water from Rainbow Water Service, Durham, NC. Several brands of locally available spring and distilled water were tasted by the panel and the Rainbow Spring Water was found to be the
most pleasing.
The analysis of taste was performed from 3-1/2 02. yellow plastic cups (Solo Cup Co. # F^35A) , The Solo cups, with the exception of the clear type, are considered the only brand that do not impart an odor (34). To keep track of the sample identity during tasting, the cups were placed
in a numbered circle on a cardboard mat. For odor
analysis, the stoppered bottles were numbered with a
yellow china marker. The bottles containing samples for odor analysis were placed in two water baths 20 minutes prior to testing. These baths were filled with taste and
odor free water and kept the samples at 45 degees C.
40
Ivory brand soap. The salt -free crackers used to clear the senses between tasting were Keebler Seax Toast.
E'.§.D.§'.L._Ir.§;i.ni.ng
Prospective panelists were recruited through notices posted in the School of Public Health and were offered payment of *4»00 per hour. A limited number of people responded and we were well into the warm weather when the earthy-musty odor is predominant. Therefore, the
screening and training processes were combined into three sessions. Those people without normal olfactory and taste sensitivity would be identified during these combined sessions.
The first training session involved classroom instruction
and identification of odor and taste reference standards.
The classroom instruction covered the project objectives,
the physiology of taste and smell, and the mechanics of the FPM. Next, panelists identified reference standards. Odor reference standards used were: 2 mg/1 hexanal
(Aldrich Chemical Co. # 11,560-6) as leafy, 0.5 mg/1 trimethyl amine (Aldrich # T7,272-9) as rotten fishy, 0.5
mg/1 benzaldehyde (Fisher Scientific # B-240> as almond,
41
mg/1 cumene (Aldrich # 18,579-5) as rubber hose, 17. cod liver oil (Hain Pure Food Co., Los Angeles, CA) as fishy,
375 g/1 garlic as garlic, 25 ng/1 geosmin (US
Environmental Protection Agency, Cincinnati, OH) as
earthy-musty, 50 ng/1 MIB (US Environmental Agency, Cincinnati, OH) as earthy-musty, and 1 mg/1 as C12 free chlorine (prepared from NaOCl, Eastman Kodak Co. # 18309)
as chlorinous. Taste reference standards used were: 0.1%
citric acid (Aldrich # C8,315-5) as sour, 0.002X quinine
monohydrochloride dihydrate (Aldrich # 14,592-0) as
bitter, 0.7% salt as salty, and 10% sugar as sweet. All
chemicals were diluted in taste and odor free water.
The second and third training sessions were used to
develop the panel's sensitivity to different intensities
of odor reference standards. The standards used were MIB
and free chlorine and concentrations ranged from 1 to 80 ng/1 for MIE^ and from O. 1 to 5 mg/1 as CI2 for free
chlorine.
Panel„CalibratLon
The intensity vs. concentration curve for a reference
standard need not be the same for two different panels.
42
results cannot be compared to those obtained by a
di-f-ferent panel serving another utility. The panel will seek its own intensity vs. concentration curves, but must
remain consistent to these curves -from session to
session.
-The calibration of the panel was checked using odor
reference standards, A known concentration of either MIB
or free chlorine was included as a sample during both flavor and odor analyses at each session. MIB was not measured, so the concentration was calculated from
dilutions of a known quantity from a 1 ml vial. The MIB
stock solution was stored at 4 degrees C. If the panel
was well-trained and had good sensitivity, the plot of
intensity vs. logarithm of concentration for each
standard would yield a staight line.
6EEii£§ti9D_Qf_£he_FPM_tD_the_Orange_Water_and_Sew
Bk'tbQLity
The FPM was applied to the Orange Water and Sewer
Authority (OWASA) water system in a manner similar to how
a utility would use the Method to aid in solving taste
and odor problems. OWASA delivers approximately S mgd of
43
raw water supply is University Lake, which is a protected
source that holds 630 million gallons and has a surface
area of 210 acres. The sample location from University
Lake is shown in Figure 8. Samples were taken at depths
above and below the thermocline with a Kemerer
bottle-The raw water is pumped to the OWASA Water Treatment
Plant where it undergoes conventional treatment and
disinfection with free chlorine. The plant is designed
to treat 10 mgd. A process flow diagram is shown in
F'igure 9 and includes possible points of chlorine
addition. Raw water and finished water samples from the treatment plant were taken from remote taps in the
plant's laboratory. Settled water samples were taken
from the end of the sedimentation basins. Over filter
samples were taken from off the top of the filters, which
is immediately after pre--filter chl orination- The
purpose of taking a settled water and over filter sample
was to determine the effect of chlorination on taste and
odor. Filtered water samples were taken from a tap off
the filtered water effluent piping.
An outline of the OWASA water distribution system is
shown in Figure 10. The two sample points are the
44
Unlvcrs'i+y IfK^e
J
r\. lOm
OWAs/\
D^^A
Rapid Mix Flocculation Sedimentation Filtration
From
University
LakeAlum
Chlorine
Caustic PAC
KMn04
Polymer
¥
Chlorine
Polymer
Y
Flouride Phosphate
Caustic
Chlorine
To
Clearwell
\
46
^
II
I
\^
I/IDURHAI
f
O/o
CHAPEL
HILL
Water Treatment
Ptanl-UNIVERSITY LAKE
chatham-countT
scale in miles
Pinegate
V
y
Carolina Inn
[40
CORPORATE LIMITS
PRESENT WATER SERVICE AREA
EXISTING WATER SYSTEM
47
Hill and near the water treatment plant and Pi negate is at the edge of the distribution system. Neither of the two locations is on a "dead end" line.
To evaluate use of the FPM with bench-scale jar testing,
several raw and settled water samples were dosed with
powdered activated carbon (PAC) and chlorine in the
laboratory. The PAC used for the jar tests was Watercarb (Husky Industries) and was obtained from OWAGA. The PAC was dried overnight at 102 degrees C before weighing.
The water samples were measured into 500 ml wide mouth amber glc*5s bottles w/ Ti?f lon~l ined caps including a
control sample that would not be dosed with PAC. The
ap)propriate amount of PAC was added to each sample. All samples were mechanically rotated for the specified time; including the control, which rotated for 70 minutes. All samples were then centrifuged and the liquid decanted. After centrifuging, appropriate samples were dosed with
chlorine and placed in the dark for two hours before
measuring free chlorine residual,
SJensitivity of the panel to chlorinous flavors was
determined by plotting intensity vs. free chlorine
concentration. Sources of chlorinous odors other than
ͣͣͣ^-^!ff^^^;-:'
48
the free chlorine standards, or present in insignificant
concentrations. Measurement of monochloramine in OWASA
drinking water at the School of Public Health found only 0.13 mg/1 as C12. Taste and odor free water containing 3
mg/1 as C12 of free chlorine had only 0.10 mg/1 as C12 of
monochloramine. These monochloramine concentrations are well below the flavor and odor thresholds (38). Theother possible source of chlorinous odor, chlorinated phenols, should not be present in the OWASA water system. Since the water supply is protected and receives no
industrial discharges, it would not contain phenols.
Table? 6 lists all samples collected and subjected to sensory analysis. Chlorinated samples and the chlorine reference standard were analysed for -free chlorine
concentration. All measurements of free chlorine and
monochloramine were made using the DF'D Ferrous
49
Table 6. List of samples
Date Sample
7/8/85 Raw Water & WTP (O), Finished Water © WTP (D),
Carolina Inn, Pi negate
7/11/85 Raw Water ® WTP (0), Settled Water d WTP (D), Filtered Water @ WTP, Finished Water @ WTP, 5 ng/1 HIB Standaxrd
7/19/85 Raw Water @ WTP (0), University Lake @ Im depth (0), 2m depth (0) (D), and 3.5m depth
(0), 0.5 mg/1 as C12 Free Chlorine Standard
(D)
7/24/85 Finished Water @ WTP, Carolina Inn, Pi negate (D), 3 ng/1 MIB Standard
8/6/85 Raw Water @ WTP (0), Settled Water @ WTP (O), Filtered Water @ WTP, F'inished Water @ WTP
<D>, 0.9 mg/1 as C12 Free Chlorine Standard
8/14/85 Raw Water @ WTP (0), University Lake @ Im depth (0) (D), 2m depth (0), and 3.5m depth
(0), 25 ng/1 MIB Standard (D)
8/21/85 Raw Water & WTP (0) (D), Raw Water S WTP treated w/ 15 ppm PAC for 40 min (0), 15 ppm PAC for 90 min (0), 30 ppm PAC for 40 min (0), 30 ppm PAC for 90 min (0), 2.9 mg/1 as C12
Free Chlorine Standard (D)
9/4/85 Raw Water @ WTP (0), Settled Water @ WTP (O), Over Filter @ WTP <0), Filtered Water @ WTP
<0) <D), 5 mg/1 as C12 Free Chlorine Standard
<D)
9/11/85 Raw Water & WTP (0), Raw Water @ WTP treated w/ 30 ppm PAC for 40 min (0>, 30 ppm PAC for 90 min (O), 60 ppm PAC for 40 min (0), 60 ppm PAC for 90 min (0), 9 ng/1 MIB Standard (O)(D)
Note: (D)- this sample was also a duplicate.
50
Table 6 (cont.>
Date SamplE?
9/18/85 Settled Water @ WTP (0), Settled Water
treated w/ 5 mg/1 as C12 Chlorine (0), Settled
Water treated w/ 60 ppm PAC for 90 min (0), Settled Water treated w/ 60 ppm PAC for 90 min then 5 mg/1 as C12 Chlorine (0), 25 ng/1 Beosmin Standard (0), 25 ng/1 Geosmin
Standard treated w/ 1 mg/1 as C12 Chlorine (O), 0.9 mg/1 as C12 Free Chlorine Standard
(0)
9/25/85 Raw Water d WTP (0), Raw Water treated w/ 5 mg/1 as C12 Chlorine (0), Raw Water treated w/ 60 ppm PAC -for 90 min (0> , Raw Water
treated w/ 60 ppm PAC for 90 min then 5 mg/1 as C12 Chlorine (0), 25 ng/1 Geosmin Standard
<0), 25 ng/1 Geosmin Standard treated w/ 1 mg/1 as C12 Chlorine (0>, 1.0 mg/1 as C12
Free Chlorine Standard (0)
10/2/85 0.3 mg/1 as C12 Free Chlorine Standard, 0.9 mg/1 as C12 Free Chlorine Sitandard (D> , 2 ng/1 MIB Standard, 5 ng/1 MIB Standard, 15 ng/1 tilEf Standard
Motes (D)-- this sample was cilso a duplicate.
Chfiipter 4
F-i:ESULTS AND DISCUSSION
E'.§:Qsl.„Irai_ni.ng
In the first training session, the prospective panelists were given taste and odor reference standards for
identification. The results of this session 3.re shown in Table 7. The panel had no problem identifying the taste reference standards, although the bitter, sour, and salty
standards could not be swallowed because of their
strength.
The panel was able to identify the more familiar odor reference standards, such ass cod liver oil, garlic, geosmin, MIB, and chlorine. The other odor standards, which are used by the Philadelphia Water Department (see Table 4), were very difficult to describe, 3--he;;Bn-l-ol at the recommended concentration did not have a
perceptable odor. E^ensaldehyde at the recommended
52
Table 7„ Results of first training session (5/29/85)
ODOR
Reference Standard Anne
Response
Wendy Pam Bill
He;-! anal (leafy)
Tri methyl amine
(rotten fish)
Bensaldehyde
(almond)
3-he!!en-l-ol
(grassy)
sweet grass candy fruit
fish fish glucose bad
chemical paint rubber chemical
thinner
bland
Cumene (rubber hose) chemical varnish plastic chemical
cement
Cod liver oil
(fishy)
Garlic (garlic)
Geosmi n
(earthy,musty,dirty)
MIB
(earthy,musty,dirty> dirty
fish fish cod
f i sh
kitchen
garlic garlic garlic onion
dirty dirt geosmin musty
dirt paper musty
Chlorine (chlorinous) slightly chlorine chemical chlorine
flourinated
TASTE
Citric Ac i d (sour) Quinine (bitter) Salt (salty) Sugar (sweet) 1 emon jui ce bitter sal ty sugar 1 emon sour bitter salty sweet
sour 1 emon
juice bitter bitter
salty salty
difficulties in the first session seemed to be due to
some poor odor reference standards and not. to any
abnormal olfactory sensitivity.
The results of the second and third training sessions are
shown in Appendix B. In these sessions the panelists
were given various concentrations of the reference
standards MIB and free chlorine to evaluate odor and
flavor (by mouth)- The objective was to ensure that the panel's response for intensity was consistent with the
known threshold values of these standards. Using the
results of Krasner and Krasner and Barrett (Figures 4 and
5) as a guide, the results show our panel to be very
sensitive to low concentrations of these reference
standards.
Additional training would be desirable, but, as mentioned previously, time was limited and the regular sessions had
to begin. Based on the three training sessions, all
prospective panelists were considered to have normal
j4
Table 8. Panelists used to conduct the FF'M
Name Age
be;-Occupation
Anne Caston P a m R e i t n a u e r
Bill Dowbiggin Wendy Fuscoe f-i:u.t hy Deei'- (part
R o n ri i e h:! a ran. j i a
28 F Student
30 F Student
23 M Student
28 F Student
ͣ
time) 28 p Student
E'.ilOgl_..Q^i.ibClt..i..Dn
The panel responses to the MIB standard a.re shown in Figure 11. Each point represents the composite flavor
profile for that sample. The solid lines are the lines
of best fit. The results show that the panel is
sensitive to changes in MIB concentration. Also, the
panel response follows the Weber-Fechner Law very
closely, since the linear regression model is a function
of the logarithm of concentration. The regression models
are shown in the figure; Y is the panel response and X is
the sample concentration. For odor, a better fit of the
data was found with a regression model having response as
a function of concentration squared. The reason for this
deviation from the Weber-Fechner Law was the influence of
the point at X=25 and Y=2. If this point is removed, the
regression model shown in the figure is the best fit.
The results in Figure 11 also show that the panel's taste sensitivity to MIB is equal to its odor sensitivity. A
test for equality of slopes and intercepts and for
coincidence found that the two best fit lines are
statistically the same lines.
56
2 1/2
2 h
c
•£ 1 1/2
(0
1/2
)(
O Odor Y = 0.530(In X)-0.171 RsO.SS
•—...90% Prediction Interval
D Taste Y=0.578(ln X)-0.167 R=0.94<
---90% Prediction Interval y^''
^•>"
GD
J—I I I I J---L
10 15 20 25
'VMIB in ng/I
57
to include the entire flavor of the sample; i.e. tastes,
odors, feeling factors, and aftertastes.
The dashed and dotted lines in Figure 11 are the bounds
for the 907. prediction intervals. Appendix D contains an
esiplanation of how these prediction intervals were
calculated. With these prediction intervals, a person may
predict, with 907. confidence, the upper and lower limits
of the intensity response for a single flavor profile (a
single point on the graph), given the odorant
concentration. The more commonly used confidence
intervals predict the limits of response for the mean of
many identical samples. The prediction intervals, as
opposed to the confidence intervals, were plotted because
in a taste and odor investigation many times a utility
will produce a single flavor profile for many different
samples rather than take the extra time and expense of
producing many flavor profiles for each sample and using
the mean response value. Thus, the variability of a
single flavor profile result will be of more concern to a
uti1ity.
The prediction intervals reinforce an important point
made in Chapter 1, that is, the FF'M is a subjective
58
intensity unit. This is a large amount of variability
considering the entire intensity range spans only three
units. The results in Figure 11 a.re very similar to those
obtained by MWDSC for MIB (Figure 4).
The results indicate a threshold odor and flavor for MIB
of 2 ng/1. This value may not be accurate, because only
the concentration of the 1 ml vial of MIB was known with
certainty; errors in dilution could have occurred. Also,
the concentration of the MIB stock solution may have been
reduced by biological activity during storage, even
though it was kept at 4 degrees C.
The results for the free chlorine standard are shown in
Figure 12. The pH of the free chlorine standards ranged
from 6.5 to 6.9. Therefore, hypochlorous acid was the
predominant species of free chlorine. The panel has a
very low odor sensitivity to changes in free chlorine
concentration, since the odor points are scattered and
the correlation coefficient for the best fit line is low.
As a result, the 90% prediction interval spans 1-1/2
intensity units. The panel could not discern different
concentrations of free chlorine through taste. The best
fit line is horizontal, indicating no influence of
ly M
2 1/2
(0
c o
c 1 1/2
CO 3 O
C
^
o
JZ
1 O
59
O Odor Y=0.358(In X) + 0.643 R=0.59
...90% Prediction Interval
D Taste Y=0.25 R=0
o
Odor
k
e-
J___I___I___I I 10.3 0.5 1 2
Free CL2 in mg/l
ͣ
»
C)
60
Although the results given in Figure 12 show that the
panel cannot distinguish one level of chlorination from
another, the panel could distinguish presence of chlorine
from control samples containing no chlorine. The panel
was able to detect presence of free chlorine in
concentrations above 0.3 mg/1 as C12, With the exception
of one point at 3 mg/1, the panel gave positive
responses. The panel's inability to detect changes in
free chlorine concentration made it impossible to
determine the threshold odor or flavor concentrations.
DreKel University's panels have started to analyze free
chlorine standards and also report problems with panel
sensitivity to concentration changes. However, MWDSC's
panel developed good sensitivity to various
concentrations of hypochlorous acid (Figure 5), and even
found taste to be more sensitive than odor. More
extensive training with the free chlorine standards than
was possible in this research should develop the panel's
sensitivity, as it did at MWDSC.
Qther__Qua]^i^ty_Assur ance Samgl BS
61
sessions a blank o-f taste and odor -free water and a
duplicate sample. Listed in Table 9 are the panel
responses to the blank. Except -for two responses, one
being 1/2 intensity unit and the other a note with no
intensity, the panel consistently found no flavor. Even
though the pamel was insensitive to varying
concentrations of free chlorine, as shown in Figure 12; they are able to detect presence, or, as demonstrated in
Table 9, absence of the chlorinous odorant.
Table 10 lists a comparison of samples and their
duplicates- In all cases, the description of the sample
and its duplicate are identical. Except for one sample, on 7/7/85, all pairs vary by no more than 1/2 intensity
unit.
The quality assurance samples also served as a check on the cleanliness of materials. Based on the results, it was assumed that the glassware cleaning, sample
preparation, and sample analysis procedures were
effective in eliminating outside odors.
A.EBLl£§t.i.9Q_lQ™QWASA
62
Table 9. P^-nel response to taste and odor free water
DATE ODOR TASTE
7/8/85 None
7/11/85 None
7/19/85 None
7/24/85 None
8/6/85 None
8/14/85 None
8/21/85 None
9/4/85 None
9/11/85 None
9/18/85 None
9/25/85 None
10/2/85 None
None
None
None
None
Bitter
Bitter 1/2
None
None
None
None
None
63
Table 10« Patnel response to duplicate samples
Response
Date Sample
_
7/7/85 CI* 1-1/2
h1u*^«- 1
CI 1/2 Mu 1/2
7/11/85 Mu 1 CI ) (
Mu 1 CI ) (
7/19/85 Mu 1-1/2
Bitter )(
7/24/85 CI 1 Mu 1/2
CI 1/2 Mu 1/2
8/6/85 CI 1-1/2 Mu 1/2
CI 1 Mu ) (
8/14/85 Mu 1
Dii-•t 1-1/2
8/21/85 Ea*** 1-1/2
CI 1/2
______________^__„„ ._„
Duplicate
CI 1-1/2 <C3dDr)
Mu ) (
CI Mu 1/2 1 (Taste) Mu CI 1 1/2 (Odor) Mu 1 Mu 1 (Taste)
Mu 2 (Odor) Bitter )( (Taste) CI 1/2 (Odor)
(Taste)
CI 1 (Odor)
Mu
CI 1 (Taste) Mu ) (
Mu 1 (Odor)
Dirt 2 (Taste)
Ea 1- -1/2 (Odor)
(Taste)
______________
* CI = Chi orinous
64
Table 10 (cont.)
Response
Date
9/4/85
9/11/85 9/1S/S5 9/25/85 10/2/85
Sample
CI 1-1/2 CI ) ( Mu 1 CI 1/2 CI 1 CI ) ( CI ) (
Dupli cate
CI 1 CI ) ( liu 1/2 •CI ) ( -CI 1/2 CI 1/2 CI ) (
(Ddor) (Taste) • 1 (Odor)
sensitive to changes in the MIB standard concentration. However, this is not sufficient proof that the panel could detect, quantitatively, a musty odorant in the
presence of other odorants. The effect of one odorant on
another in olfactory response is not known in most cases.
As seen in Figure 4, liWDSC found the panel to be
sensitive to changes in MIB concentration in natural
waters, which contain background odorants. However, it
was not possible in this research to determine whether the panel could detect changes in MIB concentration in natural waters, because closed-loop stripping analysis of the actual MIB concentration was not available.
The FPM was applied to samples from the OWASA water system strictly as a tool to detect presence or absence
of an odorant and to perceive tastes and odors; in
effect, the FPM was used to simulate the response of consumers of OWASA water. Figures 13 and 14 show the
panel response to samples taken at various depths in
University Lake and a sample of raw water after being
pumped to the plant. The musty odor is present
throughout the oxygenated layer of the lake. It may also
have been present in the deoxygenated hypolimnion, but
was masked by the strong hydrogen sulfide odor found
66
Raw Water
at WTP
University L.
1m Depth
University L.
2m Depth
University L.
3.5m Depth
Musty
Thermocline
)( 1/2 1 11/2 2 2 1/2 3
Odor Intensity
6?
Raw Water at WTP
University L.
1m Depth
University L.
2m Depth
University L.
3.5m Depth
Musty
Thermocline
)( 1/2 1 11/2 2 2 1/2 3
Odor Intensity
68
change in character or intensity as water is pumped to
the plant.
The presence o-f a musty odorant in the lake was con-firmed
about a month after these samples were taken. One sample
o-f raw water from the treatment plant was sent to MWDSC •for closed-loop stripping analysis. The water contained 2 ng/1 MIB and 4 ng/1 geosmin. The concentrations o-f MIB
and geosmin in the lake were probably higher earlier in
the summer, since the musty odor intensities reported by
the panel were greater.
The method of sampling at various depths and using the
FPli could be used by utilities with adjustable intakes as
an additional parameter when deciding -from what level to
draw water.
Figures 15-17 exhibit the flavor profiles for samples from the water treatment plant on three different days.
Points of chlorine addition are also shown. The results
2 1/2
(0
c 0
S 1 1/2
o
ͣ
D
O
1/2
)(
t
PAC-7 ppm
KMn04- 1 ppm
CL2
Musty
t
-^
Raw Water ^ Settled Water % Filtered Water Finished Water
CL2 CL2
Figure 15. Odor descriptions and Intensities through water treatment on 7/II/85
2 1/2
c
0)
JE 1 1/2 o
O
1/2
)(
--&
Musty
CL2
No PAC
KMn04- 2ppm
Raw Water Settled Water A Filtered Water Finished Water
f
CL2
Figure 16. Odor descriptions and intensities through water treatment on 8/6/85
2 1/2
2
-(0
c 1 1/2
o
O ^
1/2
)(
-Musty
Raw Water A Settled Water i Above Filter Filtered Water
I
t
No PAC
KMn04- 0.5 ppm
CL2 CL2
72
panel's response to musty odor and replaces it by a response to chlorinous odor. Thus, chlorine is either oxidising or masking the musty odorant. Figures 15-17
also show the concentrations of PAC and potassium permanganate added in the rapid mi>; basin. These
treatments did not appear to be effective, since the musty odor did not decrease between the raw and settled
water points.
The results presented in Figures 15-17 illustrate the
usefulness of the FPM in practice. A utility could
perform sensory analysis by the FF'M on samples from
throughout their treatment plant to aid in evaluating process effectiveness in removing tastes and odors.
The results in Figures IS and 19 track the flavor profile from the water treatment plant through the distribution system. Both earthy-musty and chlorinous odors ars persistent to the far end of the distribution system. Free chlorine measurements in mg/1 as C12 are shown in Figure 18. Even though the free chlorine residual drops
to 0.1 mg/1 as C12 the panel response to chlorinous
intensity is high- This tends to confirm the panel's insensitivity to changes in chlorine concentration, or,
Odor Intensity
lO lO lO CO 3 !-»• J3 oo 0) • t o^
H 0) li+ (D M ^ O hi H» •d C+ t-^ ois ͣn
3 P B. 55' hj- o c+ Q. (D !3 CO
^
0) H- c* (D (D cn 11 ^ H o(g ͣ
r^-g O0)
d--n (D 4 O d-3 c+ ^^ 1 3 3 3 <+ p] y P< P- H-0) c»-4
or ͣD
ͣ ., S' H» <D o 3 (O 0) o 3 <D -o ;;0 CD U^ lO -r T"
0.8 mg/l as CL2
Free Chlorine
c 0)
0.6 mg/l as CL2
Free Chlorine
O
I-ro
6o.1 mg/l as CL2
Free Chlorine
1' \
i 1 I.., i
?
1-u