Sharif University of Technology
Scientia IranicaTransactions A: Civil Engineering http://scientiairanica.sharif.edu
Development of predictive models for shear strength of
HSC slender beams without web reinforcement using
machine-learning based techniques
A. Kaveh
a;, T. Bakhshpoori
b, and S.M. Hamze-Ziabari
ca. Centre of Excellence for Fundamental Studies in Structural Engineering, Iran University of Science and Technology, Narmak, Tehran, P.O. Box 16846-13114, Iran.
b. Department of Civil Engineering, Faculty of Technology and Engineering, University of Guilan, Rudsar-Vajargah, Iran. c. School of Civil Engineering, Iran University of Science and Technology, Narmak, Tehran, P.O. Box 16846-13114, Iran. Received 30 March 2017; received in revised form 20 July 2017; accepted 11 September 2017
KEYWORDS High Strength Concrete (HSC); Slender beams; Shear strength; Machine learning; GMDH;
MARS.
Abstract. Shear failure of slender beams made of High Strength Concrete (HSC) is one of the most crucial failures in designing reinforced concrete members. The accuracy of the existing design codes for HSC, unlike the Normal Strength Concrete (NSC) beams, seems to be limited in predicting shear capacity. This paper proposes a new set of shear strength models for HSC slender beams without web reinforcement using conventional multiple linear regression, advanced machine learning methods of Multivariate Adaptive Regression Splines (MARS), and Group Method of Data Handling (GMDH) network. In order to achieve high-delity and robust regression models, this study employs a comprehensive database including 250 experimental tests. Various inuencing parameters, including the longitudinal steel ratio, shear span-to-depth ratio, compressive strength of concrete, size of the beam specimens, and size of coarse aggregate, are considered. The results indicate that the MARS approach has the best estimation in terms of both accuracy and safety aspects in comparison with regression methods and GMDH approach. Moreover, the accuracy and safety of predictions of MARS model is also remarkably more than the most common design equations. Furthermore, the robustness of the proposed models is conrmed through sensitivity and parametric analyses.
© 2019 Sharif University of Technology. All rights reserved.
1. Introduction
In the last 30 years, the application of High Strength Concrete (HSC) has remarkably increased due to sig-nicant development in building and materials technol-ogy. Several advantages, including better mechanical
*. Corresponding author. Tel.: +98-21-77240104; Fax: +98-21-77240398
E-mail addresses: [email protected] (A. Kaveh); [email protected] (T. Bakhshpoori); [email protected] (S.M. Hamze-Ziabari) doi: 10.24200/sci.2017.4509
properties, structural eciency, and economic benets, in terms of both structural and aesthetic aspects have made the HSC a widely used material in the construc-tion of high-rise buildings and long-span bridges in all over the world. The denition of HSC has changed par-allel to the development of its properties in recent years. HSC can be dened as a concrete with compressive strength which is signicantly beyond and more than double from what is used in normal practice (normal strength concrete, NSC). Dierent design codes and researchers proposed dierent limits for compressive strength of concrete to set a demarcation line between NSC and HSC materials. The present study follows
the denition of HSC by ACI 363R-10 [1], which is dened as a concrete with compressive strength more than 40 MPa.
One of the most crucial failures in reinforced structures made of HSC or NSC materials is the shear failure. Failure due to the shear in beams with HSC is brittle and occurs suddenly without warning. Several researchers have investigated experimentally and analytically to evaluate shear carrying capacity of reinforced concrete members. It has been found that several mechanisms, including the shear transfer in the compression zone, aggregate interlock across crack face, stirrups crossing the shear crack, and dowel action of longitudinal reinforcing bars crossing the crack, can be involved in providing shear resistance of Reinforced Concrete (RC) beams [2]. In beams without web reinforcing stirrups, crossing the shear crack mechanism cannot be considered as an internal force that contributes to shear resistance. It is un-derstood that the shear failure mechanism in concrete members reinforced longitudinally, yet without trans-verse reinforcement under bending, varies signicantly, and the size of member and shear span-to-depth ratio are the two main parameters that inuence the shear failure mechanism. In fact, the shear span-to-depth ratio (a=d) determines the failure modes of RC beams and divides them into deep beams (< 2:5) and slender beams (> 2:5). For deep beams with a=d approxi-mately less than 2.5, arch action occurs [3]. For slender beams with a=d greater than 2.5, the shear strength of reinforced member with longitudinal steel bars is a function of a=d, too. For these members, a=d represents the interacting eect of the moment and shear at a section on the shear strength. Accurate prediction of the shear behavior of the RC beams, unlike exural behavior that can generally be predicted well, is a challenging work due to the complexity of the shear transfer mechanism.
Furthermore, there are remarkable dierences between NSC and HSC beams without web reinforce-ment [4-10]. According to reports, the fracture surface in HSC beams is smooth and develops along the transition zone between the matrix and aggregates, whereas it is rough in NSC beams. In addition, internal shear transferring mechanisms contribute dierently to dierent concrete strengths. At higher concrete strength, the aggregate interlocking does not con-tribute greatly because of the smooth fracture planes and the straight cracks, which do not go around the aggregate particles [11,12].
Shear strength prediction of HSC slender beams without web reinforcement is still contentious. There is no unied rational theory explaining the interaction of the three internal forces contributing to shear re-sistance, especially for HSC. Various design equations are available to estimate shear strength of reinforced
concrete beams without stirrups. Their accuracy, how-ever, seems limited for slender reinforced HSC beams, as these equations are empirically developed using predened forms with experimental data, generated mainly for a limited number of inuencing parameters. Recently, machine-learning approaches have been successfully employed to overcome these limitations in many dierent problems of civil engineering (e.g., [13-25]). In this regard, particularly, Elsanadedy et al. [12] very recently applied regression models and Articial Neural Networks (ANN) to predict the shear strength of HSC slender RC beams without stirrups. Their results showed that ANN approach generally provided better predictions than regression approach did, in terms of accuracy. However, ANN implementation suers from several drawbacks. The major disadvan-tage of this approach is that the ANN training process is achieved through a gradient descent algorithm on the error space, which can be very complex and may contain many local minima. Furthermore, trial-and-error processes are required to determine the network structure. In addition, ANN method does not give enough insight into the generated models and is not as easy to be used as the empirical formulas.
Considering these drawbacks and the existing unsatisfactory equations, Kaveh et al. [26] very recently successfully used M50 algorithm as one of the
model-tree based algorithms used in developing predictive and simple formulas to estimate the shear strength of HSC slender beams without stirrups. This paper illustrates the potential of two more ecient alternative machine-learning-based approaches to this problem. Among soft computing approaches, the Group Method of Data Handling (GMDH) network and (multivariate adaptive regression splines) MARS algorithms are known as self-organized and non-parametric methods to model and discover the behaviors of unknown or complicated systems based on given input-output data points [27-29]. The main advantage of GMDH and MARS methods in comparison with ANN method is that the dependencies between input parameters and output parameter are represented in parametric form as an equation, while these dependencies are hidden within neural network structures in ANN method.
To develop new predictive models based on GMDH and MARS, a comprehensive existing database was employed very recently, used by Elsanadedy et al. [12], that contained 250 experimental tests. The developed GMDH model related shear capacity to the longitudinal steel ratio, the shear span-to-depth ratio, compressive strength of concrete, the size of the beam specimens, and the size of coarse aggregate. The results of the developed GMDH and MARS were compared to the most common existing equations and to multiple nonlinear regression (MNLR) approach developed in this study through statistical error indicators. Results
conrmed that the developed GMDH and MARS models outperformed the existing equations and the developed regression-based equations in terms of both accuracy and safety aspects. The relative importance of signicant parameters dealing with shear strength was also investigated through sensitivity analysis. The robustness of the proposed models was also veried through a parametric analysis.
This paper is outlined as follows: The existing design equations and their limitations are given in the following section. The GMDH and MARS algorithms are described next in Section 3. The applied dataset and modeling process are presented in Section 4 fol-lowed by the results and discussion section. Finally, the summary and conclusion are presented in Section 6.
2. Design equations for shear strength 2.1. Design equations
The existing equations for estimating shear capacity of RC beams (V ) are presented in Eqs. (1) to (8). A signicant gap exists in the process of selecting the main parameters and their eects on V , because these equations have been empirically derived. In the following equations b is beam width; d is the eective depth of beam; h beam depth; dveective shear depth;
f0
c specied compressive strength of concrete; fck
char-acteristic compressive cylinder strength of concrete; a shear span; ag specied nominal maximum size of
coarse aggregate; Es modulus of elasticity of steel; As
area of tension steel; longitudinal steel ratio; Muand
Vu factored moment and shear force, respectively; Mf
and Vf factored moment and shear force, respectively;
MEdand VEddesign moment and shear force; factor
accounting for concrete density (units are N and mm). ACI 318-11 [30]:
V =
0:16pf0
c+ 17VMud u
bd 0:29pf0
cbd: (1)
CSA A23.3-04 [31]: V = pf0
cbdv;
where:
= (1 + 500"0:4
x)
1300 (1000 + sze);
"x=Mf2E=dv+ Vf
sAs 0:003;
sze=15 + a35dv
g 0:85dv: (2)
Fib Model Code [32]: V = kv
p fckbz
where:
kv= 1 + 1500"0:4
x
1300 1000 + kdgz;
"x=MEd2E=z + VEd
sAs 0:003;
kdg= 16 + a32
g 0:75;
z = 0:9d: (3)
Eurocode-2 [33]: V = 0:18kp3 100f
ckbd 0:035
p
k3fckbd;
where: k = 1 +
r 200
d 2: (4)
CEB-FIP Model Code [34]:
V = 0:153
s 3 a=d3
p
100fckbd;
where: = 1 +
r 200
d (5)
AS 3600-2009 [35]: V = 123p3fcvbd;
where: 1= 1:1
1:6 1000d
;
2= 1:0 for beams without axial force;
1 3=a=d2 2;
fcv = 3
p
fck 4 MPa: (6)
JSCE Guidelines [36]: V = dpfvcdbd;
d = 4
r 1000
d 1:5; p= 3 p
100 1:5;
fvcd= 0:23
p
fck 0:72 MPa: (7)
Cladera and Mari [37]: V = 0:225p100f0
c0:2bd;
where: = 1 +
r 200
0:9d 2:75; 0:02
1 + fc0
100
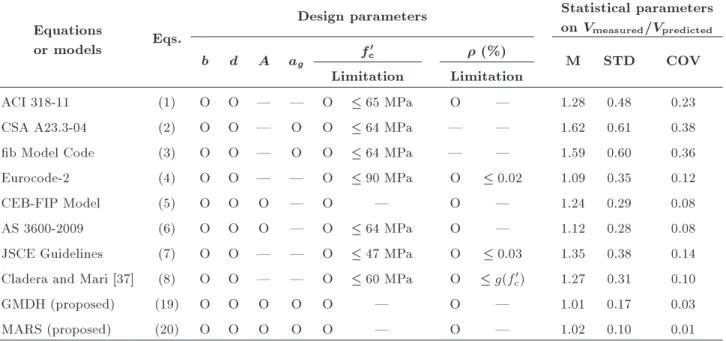
Table 1. Details of existing design equations and their performances in predicting shear strength of slender HSC beams. Equations
or models Eqs.
Design parameters Statistical parameters on Vmeasured=Vpredicted
b d A ag fc0 (%) M STD COV
Limitation Limitation
ACI 318-11 (1) O O | | O 65 MPa O | 1.28 0.48 0.23
CSA A23.3-04 (2) O O | O O 64 MPa | | 1.62 0.61 0.38
b Model Code (3) O O | O O 64 MPa | | 1.59 0.60 0.36
Eurocode-2 (4) O O | | O 90 MPa O 0:02 1.09 0.35 0.12
CEB-FIP Model (5) O O O | O | O | 1.24 0.29 0.08
AS 3600-2009 (6) O O O | O 64 MPa O | 1.12 0.28 0.08
JSCE Guidelines (7) O O | | O 47 MPa O 0:03 1.35 0.38 0.14
Cladera and Mari [37] (8) O O | | O 60 MPa O g(f0
c) 1.27 0.31 0.10
GMDH (proposed) (19) O O O O O | O | 1.01 0.17 0.03
MARS (proposed) (20) O O O O O | O | 1.02 0.10 0.01
2.2. Limitations
Table 1 summarizes the main design parameters in-cluded in Eqs. (1) to (8). According to this table, all design equations put maximum limitation on f0 c
except CEB-FIP [34] model. Most of these maximum limitations are around 65 MPa, while f0
c for HSC
slender beams without web reinforcement has been recorded notably more than the aforementioned value in eld or laboratory. The statistical error parameters in terms of average (M), Standard Deviation (STD), and Coecient Of Variation (COV) between the stan-dardized ith predicted and measured values of V are presented. It can be expected that the performance of these equations for slender beams made of HSC be limited, as is clear in Table 1.
In addition, there is inconsistency between the existing equations for predicting shear strength. For example, the portions of longitudinal steel reinforce-ment contributing to V are given by 1=3 in equations
of Eurocode-2 [33], CEB-FIP [34] model code, AS 3600 [35], and JSCE [36], whereas its contributions to study of Cladera and Mari [37] and ACI 318-11 [30] are proportional to 1=2 and , respectively. Furthermore,
some codes (Eurocode-2 [33], CEB-FIP [34] model, AS 3600 [35], and JSCE [36]) consider the shear strength of HSC beams proportional to f01=3
c , while other
codes (ACI 318-11 [30], CSA A23.3-04 [31], and b model [32]) consider it to be proportional to f01=2
c . This
proportion was also reported as f0kkk0:2
c by Cladera
and Mari [37].
Furthermore, according to Table 1, some impor-tant parameters were not incorporated in most of these design codes. For example, the inuence of the nominal
maximum size of coarse aggregate only was considered in CSA A23.3-04 [31] and level II approximation of the b model [32] code, whereas dependency of HSC shear strength on this parameter was reported by Muttoni [38]. Only CEB-FIP [34] model and AS 3600 [35] consider the eect of shear span-to-depth ratio on shear strength of slender HSC beams. In addition, ACI 318-11 [30] does not consider the eect of depth, d, whereas other design equations show notable sensitivity to the change of parameter d.
To take full advantage of the HSC RC beam, gen-erating new models to predict the shear capacity to ob-tain both reliability and accuracy is indispensable. Re-cently, machine-learning approaches have been widely applied to engineering problems. The main advantage of these approaches can be mentioned as they consid-ered all possible relations between input and output parameters and checked dierent combinations of input parameters for estimating output parameter, unlike the regression approaches. In the following section, Multi-variate Adaptive Regression Splines (MARS), Group Method of Data Handling (GMDH) network, and Multiple Nonlinear Regression methods (MNLR) are introduced in this study to predict the shear strength of HSC slender beams without web reinforcement.
3. Soft computing approaches
Recently, the soft computing approaches, such as Ar-ticial Neural Networks (ANN) and Adaptive Neuro-Fuzzy Inference System (ANFIS), have been employed as useful tools for modeling and forecasting complex structural engineering problems. Among these meth-ods, the Group Method of Data Handling (GMDH)
network and Multivariate Adaptive Regression Splines (MARS) have not yet been applied widely in structural engineering. The main advantage of GMDH and MARS methods in comparison with ANN method is that the dependency between input parameters and responses is represented in parametric form as an equation, while these dependencies are hidden within neural network structures in ANN method. Besides, ANN methods need an essential time for learning; therefore, it is dicult to apply it for modeling and forecasting under real-time systems. The descriptions of the GMDH network, the MARS, and Multiple Nonlinear Regression methods (MNLR) are discussed as follows.
3.1. Multivariate adaptive regression splines Multivariate Adaptive Regression Splines (MARS) is a nonlinear and nonparametric intelligent computing re-gression algorithm that models the nonlinear responses between the inputs and outputs of a system using a series of piecewise linear or cubic segments (splines). The resulting piecewise equation is known as Basis Functions (BFs). The slope of regression function is allowed to change from one segment to the next. The end points of each segment are called knots. A knot marks the end of one region of data and the beginning of another. Unlike the well-known parametric linear regression analysis, MARS provides greater exibility to explore nonlinear relation between a response vari-able and predictor varivari-ables. In addition, MARS also searches for possible interactions between variables by checking all degrees of interactions. Because it allows for all functional forms and interactions, MARS is able to track the complex data structures from high-dimensional datasets. The general MARS function can be expressed using the following equation:
~
f(x) = 0+ M
X
m=1
mm(x); (9)
where ~f(x) is the predicted response, 0 and m are
constants, which are estimated to yield the best data t, and M is the number of basis functions included into the model. The basis function in MARS model can be either one single spline function, or a product of two or more spline functions for dierent predictor variables. The spline basis function, m(x), can be
specied as follows:
m(x) = km
Y
k=1
[skm(xv(k;m) tk;m)]; (10)
where kmis the number of knots, skmtakes either 1 or
-1 and indicates the right/left regions of the associated step function, v(k; m) is the label of the predictor vari-able, and tk;m is the knot location. MARS generates
basis functions by searching in a stepwise way. An adaptive regression algorithm is used to select the knot locations. An optimal MARS is developed through a two-stage forward and backward procedure. In the forward stage, MARS overts data by considering a great number of basis functions. In the backward stage, to avoid overtting, redundant basis functions are deleted from Eq. (9). MARS adopts Generalized Cross-Validation (GCV) to delete the redundant basis functions. The expression of GCV is given as follows:
GCV =
1 N
N
P
i=1
h
yi f(x^ i)
i2 h
1 C(B)N i2 ; (11) in which N is the number of data, and C(B) is a complexity penalty that increases with the number of Basis Function (BF) in the model. It is dened as follows:
C(B) = (B + 1) + dB; (12) where d is a penalty for each BF included into the model, and B is the number of basis functions [24]. 3.2. Group method of data handling
Group Method of Data Handling (GMDH) is a learning machine based on the polynomial theory of complex systems [22]. From this network, the most signicant input parameters, the number of layers, the number of neurons in middle layers, and optimal topology design of the network are dened automatically. The structure of the GMDH network is congured through the training stage with polynomial model, which pro-duces the minimum error between the predicted value and observed output. The formal denition of the system identication problem is to nd an approximate function, ^f, that can be used to predict actual output, ^y, or a given input vector, X = (x1; x2; ; xn), as
close as possible to actual output, y. Therefore, n observations of multi-input-single-output data pairs are considered as follows:
yi=f (xi1; xi2; xi3; xin) ; i=1; 2; ; M: (13)
The general relationship between input and output variables can be expressed by a complicated discrete form of the Volterra function as a series in the form of:
y = w0+ n
X
i=1
wixi+ n
X
i=1 n
X
j=1
wijxixj
+Xn
i=1 n
X
j=1 n
X
k=1
wijkxixjxk+ ; (14)
which is known as the Kolmogorov-Gabor polyno-mial [39]. In the present study, a quadratic polynopolyno-mial of the GMDH network is used that is written as:
Quadratic: ^y = w0+ w1xi+ w2xj+ w3xixj
+ w4x2i + w5x2j: (15)
The weighting coecients of Eq. (14) are calculated using regression techniques such that the dierence between actual output, y, and the calculated value, ^y, for each pair of xi and xj as input variables is
minimized. In this way, the weighting coecients of quadratic function Gi are obtained to optimally t the
output to the whole set of input-output data pairs, dened as follows:
E =
M
P
i=1[yi Gi()] 2
M ! min : (16) In this study, the GMDH network is improved using a back propagation algorithm. This method includes two main steps:
1. Weighting coecients of the quadratic polynomial are determined using the least squares method from the input layer to output layer in the form of a forward path;
2. Weighting coecients are updated using a back-propagation algorithm in a backward path. This procedure may continue until the error of the training network (E) is minimized.
3.3. Multiple nonlinear regression method Let y be a dependent variable and have a nonlinear relation with n independent variables as x1; x2; ; xn.
The nonlinear relation between them can be expressed as:
y = a0xa11xa22 xann: (17)
By applying logarithmic transformation, the following equation can be obtained as follows:
log y = log a0+ a1log x1+ a2log x2+
+ anlog xn; (18)
where coecients a0; a1; , an can be determined by
applying the least squares method, similar to Multi-Linear Regression (MLR) method.
4. Model development
4.1. Model inputs and outputs
Five variables were presented to the MARS, GMDH, and MNLR as model inputs including the eective depth (d), the shear span-to-depth ratio (a=d), the compressive strength of concrete (f0
c), the aggregate
size-to-depth ratio (ag=d), and the longitudinal steel
ratio (). The single model output is concrete shear capacity, vu.
4.2. Data division and pre-processing
The data used to calibrate and validate MARS, GMDH, and MNLR models obtained from the liter-ature include a series of 250 concrete shear capacity tests, compiled by Elsanadedy et al. [12] from 33 exper-imental studies performed between 1957 and 2013. All selected beams are without stirrups, and they were lon-gitudinally reinforced with non-prestressed steel rebars. Only slender beams with a=d 2:5, whose failures primarily occur due to shear, were considered. The specimens were monotonically loaded using either one or two concentrated loads until failure. Details of the data used can be found in [12].
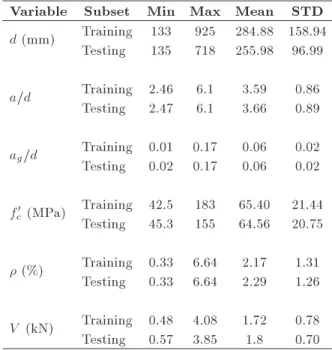
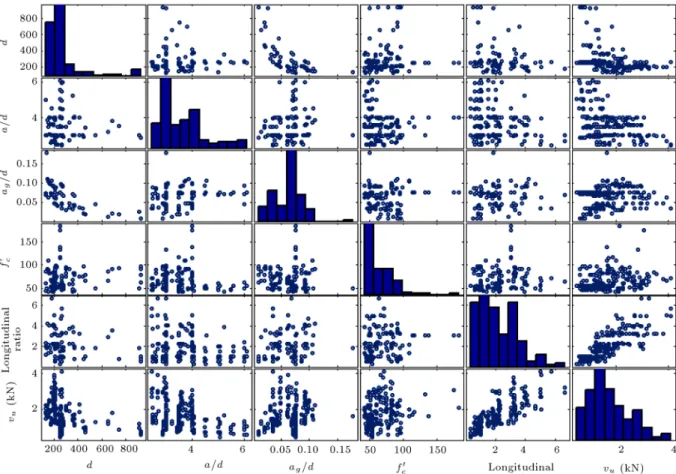
The available data were randomly divided into two sets: a training set for model calibration and an independent validation set for model verication. The validation dataset was used to specify the gen-eralization capability of the models to new data with which they had not been trained. In other words, the testing data were applied to measure the performance of the models obtained by the proposed algorithms when applied to dataset, which played no role in building the models. The statistics of the data used in the training and validation sets are given in Table 2, which include the mean, standard deviation (STD), minimum, and maximum. For more visualization, a matrix-plot of input and output parameters is repre-sented in Figure 1. This plot presents all possible scatter plots of input and output parameters one by one. The plots in the diagonal of this matrix are the histograms of input and output parameters for the whole data points. As shown, most of data points are concentrated in the ranges of d 400 mm, f0
c
Table 2. Ranges of input and output parameters for training and testing sets.
Variable Subset Min Max Mean STD d (mm) Training 133 925 284.88 158.94
Testing 135 718 255.98 96.99 a=d Training 2.46 6.1 3.59 0.86 Testing 2.47 6.1 3.66 0.89 ag=d Training 0.01 0.17 0.06 0.02 Testing 0.02 0.17 0.06 0.02 f0
c (MPa) Training 42.5 183 65.40 21.44 Testing 45.3 155 64.56 20.75 (%) Training 0.33 6.64 2.17 1.31 Testing 0.33 6.64 2.29 1.26 V (kN) Training 0.48 4.08 1.72 0.78 Testing 0.57 3.85 1.8 0.70
Figure 1. Matrix plot of input and output parameters.
100 MPa, and 4 (%). It should be noted that the derived model could be more reliable in these ranges.
Out of the 250 tests, 200 data vectors (80%) were taken for the training process. The remaining 50 data vectors (20%) were used to test the models. It should be noted that, like other empirical models, the proposed models are only valid for the ranges in which they are trained and show better performance in those ranges in which data are denser.
4.3. Derived models
Following data division, training dataset was presented to GMDH, MARS, and MNLR algorithms for model training. The MARS model returned the following equation for concrete shear capacity:
vu (kN) = 5:4 3:5 BF1+ 22 BF2+ 41
BF3 0:079 BF4+ 0:078 BF5 0:049
BF6+ 0:054 BF7 0:54 BF8+ 38
BF9+ 0:096 BF10 0:47 BF11 3:6
BF12+ 31 BF13+ 700 BF14 4100
BF15 16 BF16 15 BF17+ 1:7
BF18+ 4:3 BF19 0:09 BF20 0:79
BF21 23 BF22 0:15 BF23+ 0:48
BF24+ 17BF25+ 0:093BF26+ 6:810 5
BF27+ 2:4 BF28: (19)
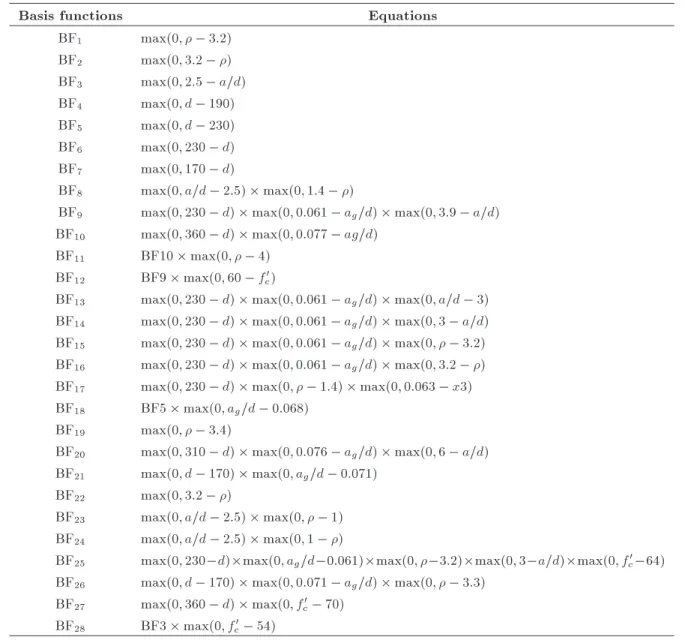
Table 3 lists the BFs and their corresponding equations. It should be noted that, based on Table 3, 28 BFs and 19 BFs with interaction terms are integrated in this model, indicating that the model is not simply additive and that interaction terms play a signicantly important role. The nal model of MARS (Eq. (19)) is achieved via GCV obtained from forward selection and backward deletion process. As observed, one of the advantages of MARS algorithm is that it not only captures complex relationships between independent and dependent variables, but also does not require additional eort to verify a priori assumption about the relationship between the set of independent variables and dependent response variable. The latter feature becomes more important as the dimension of the problem increases.
Table 3. Basis functions of the developed MARS model.
Basis functions Equations
BF1 max(0; 3:2) BF2 max(0; 3:2 ) BF3 max(0; 2:5 a=d) BF4 max(0; d 190) BF5 max(0; d 230) BF6 max(0; 230 d) BF7 max(0; 170 d)
BF8 max(0; a=d 2:5) max(0; 1:4 )
BF9 max(0; 230 d) max(0; 0:061 ag=d) max(0; 3:9 a=d) BF10 max(0; 360 d) max(0; 0:077 ag=d)
BF11 BF10 max(0; 4) BF12 BF9 max(0; 60 f0 c)
BF13 max(0; 230 d) max(0; 0:061 ag=d) max(0; a=d 3) BF14 max(0; 230 d) max(0; 0:061 ag=d) max(0; 3 a=d) BF15 max(0; 230 d) max(0; 0:061 ag=d) max(0; 3:2) BF16 max(0; 230 d) max(0; 0:061 ag=d) max(0; 3:2 ) BF17 max(0; 230 d) max(0; 1:4) max(0; 0:063 x3) BF18 BF5 max(0; ag=d 0:068)
BF19 max(0; 3:4)
BF20 max(0; 310 d) max(0; 0:076 ag=d) max(0; 6 a=d) BF21 max(0; d 170) max(0; ag=d 0:071)
BF22 max(0; 3:2 )
BF23 max(0; a=d 2:5) max(0; 1) BF24 max(0; a=d 2:5) max(0; 1 )
BF25 max(0; 230 d)max(0; ag=d 0:061)max(0; 3:2)max(0; 3 a=d)max(0; f0 c 64) BF26 max(0; d 170) max(0; 0:071 ag=d) max(0; 3:3)
BF27 max(0; 360 d) max(0; f0 c 70) BF28 BF3 max(0; f0
c 54)
GMDH algorithm returned the following selective polynomials to predict concrete shear capacity of HSC slender beams:
Layer 1:
L1= 1:7 + 1:3 + 1:1ad
+ 0:02d
+0:27ad 0:004d 0:009dad 0:182
0:18ad2 1:510 5d2 0:00041da
d
0:026ad2 0:016a
d 2
+0:00059d2
+ 0:0014dad2+ 2:9 10 6d2
+210 6d2a
d
+0:00673 0:0094a
d 3
+ 4:3 10 9d3: (20a)
Layer 2:
vu (kN) = 2:5 1:4L1 0:03fc0 25adg
+ 0:0017f0
cL1+ 42adg
L1+ 0:7adg
f0
c
+ 0:42L2
1+ 7:9 10 5f02c 4:1 102adg
2
0:3adgf0
cL1+ 0:0095fc0L21
6:7 10 5f02
cL1 7:1adg
L2
0:0039ag d
f02 c+6adg
2
L1+2:6adg
2
f0 c
0:092L3
1+1:2 10 6f03c+7200adg
3
:(20b) To further evaluate the proposed MARS and GMDH models against the most common regression ap-proaches, a new regression equation was developed using MNLR as follows:
vu= 14:50d 0:39ad
0:62
f00:12
c 0:45: (21)
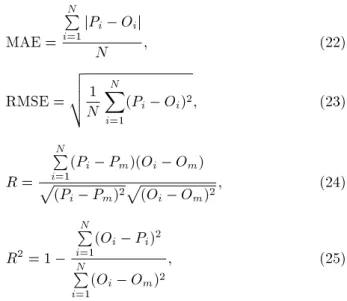
To analytically evaluate the performances of the devel-oped models, the following statistical error parameters were applied: Mean Absolute Error (MAE), Root Mean Square Error (RMSE), correlation coecient (R), and coecient of determination (R2).
MAE =
N
P
i=1jPi Oij
N ; (22)
RMSE = v u u t 1
N
N
X
i=1
(Pi Oi)2; (23)
R =
N
P
i=1(Pi Pm)(Oi Om)
p
(Pi Pm)2p(Oi Om)2; (24)
R2= 1 N
P
i=1(Oi Pi) 2 N
P
i=1(Oi Om) 2
; (25)
where Oi is the measured value, Pi stands for the
prediction values, N is the number of data points, Om is the mean value for observation, and Pm is the
mean value of prediction. The correlation coecient (R) is a measure of the relative correlation between the predicted and measured values. R values ranged between 1 and 1. If R value is close to 1, it indi-cates that there is a direct linear relationship between measured and predicted values. However, R does not necessarily indicate the goodness of the model's performance, particularly when the range of data is very wide and the data points are distributed around their mean. Therefore, the coecient of determination, R2, can be used as an unbiased estimate and, also, a
better measure for evaluating the model's performance. The MAE and RMSE measure the dierence between predicted and measured values, and values near to zero indicate a close match.
5. Results and discussion
The results of developed models and the most common
design equations to predict shear strength of HSC slen-der beams without web reinforcement were compared in this section. Moreover, the inuence of important parameters on shear strength was investigated through parametric and sensitivity analyses. The most impor-tant predictive parameters were determined through sensitivity analysis in predicting shear strength. Fi-nally, safety analysis was done by using demerit point's classications of Collins.
5.1. Performance analysis
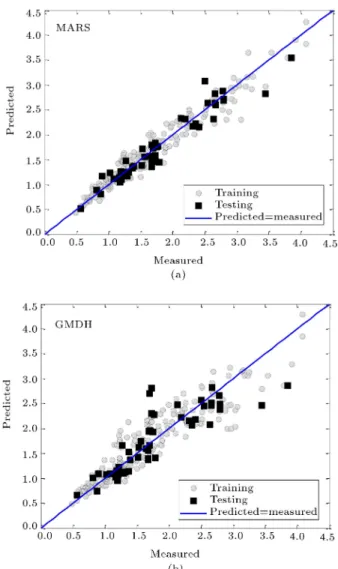
The number of data used to develop a new predictor model based on machine-learning approaches plays a crucial role in modeling process. For developing a reliable model based on data mining approaches, Frank and Todeschini [40] suggested that the minimum ratio between the number of data used and the number of involved variables should be 3. A safer value of 5 can be more conservative. In the present study, this ratio is remarkably higher and is equal to 250=6 = 41:66. The performances of the developed MARS and GMDH models shown in Figure 2(a) and (b) demonstrate that there are little scatter around optimal line between measured and predicted shear strengths for both training and testing datasets. For further verication of the developed models, analytical analysis of statistical error parameters for training and testing datasets is presented in Table 4. In addition, the results of the developed MNLR method in this study were compared with those of the other proposed ones.
Smith [41] suggested that if jRj > 0:8, it can be expected that there is a strong correlation between observed and predicted values. It should be recognized that even if R is close to 1, the predicted and observed values may not match each other; they only tend to vary similarly. To compensate for this limitation, coecient of determination R2can be used. To achieve
precise results, R2 values should be close to 1. In
Table 4. Performance of GMDH and regression models in predicting bond strength for training and testing datasets.
Subset MAE RMSE R R2
Training
MARS 0.1405 0.1849 0.9715 0.9438 GMDH 0.2223 0.2983 0.9241 0.8537 MNLR 0.2741 0.3626 0.8866 0.7839
Testing
MARS 0.1395 0.1902 0.9630 0.9253 GMDH 0.2592 0.3670 0.8519 0.7217 MNLR 0.2684 0.3831 0.8414 0.6966
Total
MARS 0.1403 0.1860 0.9699 0.9408 GMDH 0.2297 0.3132 0.9122 0.8321 MNLR 0.2729 0.3668 0.8789 0.7697
Figure 2. Comparison between measured and predicted shear strengths (V (kN)) by (a) MARS and (b) GMDH models for training and testing datasets.
all cases, RMSE and MAE should be close to zero. As shown in Table 4, the MARS model outperformed GMDH and MNLR models in terms of accuracy for
both training and testing datasets. For example, the MARS model decreased RMSE value by 40.6% and 49.2% and increased R2values by 13% and 22.2% with
respect to GMDH and MNLR models, respectively. Of note, the performances of the developed GMDH and MNLR models were acceptable, and GMDH outper-formed the MNLR model. Lower accuracy of MNLR can be attributed to its limitations in predicting the phenomenon with a highly nonlinear relationship or with multiple criteria.
The results of the developed models are also compared with those obtained from the widely avail-able design codes and standards including ACI 318-11 [30], CSA A23.3-04 [31], b model code [32], Eurocode-2 [33], CEB-FIP [34] model code, AS 3600-2009 [35], JSCE [36] guidelines, and Cladera and Mari [37] in Table 5. In general, the accuracy of design codes is remarkably limited in predicting the shear strength of HSC slender beams without web reinforcement, especially ACI 318-11, CSA A23.3-04, b model code, and JSCE guidelines. In fact, these design codes, except CEB-FIP models, were not exclusively suggested for HSC slender beams with-out web reinforcement and had limitations on the maximum value of f0
c (ACI 318-11 [30], CSA
A23.3-04 [31], b model code [32], Eurocode-2 [33], model code, AS 3600-2009 [35], JSCE [36] guidelines, and Cladera and Mari [37]) or on the percentage of tension steel (Eurocode-2 [33] and Cladera and Mari [37]). Therefore, most of these equations cannot correctly be employed to predict the shear strength of HSC slender beams. Although AS 3600-2009 [35] model had the best performance amongst the other design codes, which had R2of 0.50 (highest) and RMSE of 0.54 MPa
(lowest), this model performed signicantly lower than the three developed models of GMDH, MARS, and MNLR did. For example, MARS model improved RMSE and R2 by 65.5% and 88%, respectively, in
comparison with the best design code. Thus, the
Table 5. Performance of existing equations for prediction of shear strength of slender HSC beams.
Model MAE RMSE R R2
ACI31811 0.5891 0.7939 0.6676 -0.0787 CSAA23304 0.6976 0.9358 0.5289 -0.4988
Fib 0.6895 0.9254 0.5252 -0.4656
Eurocode2 0.4341 0.6161 0.7311 0.3503 CEBFIP 0.4273 0.6059 0.8498 0.3718 AS36002009 0.3758 0.5402 0.8241 0.5005
JSCE 0.5430 0.7525 0.8188 0.0307
Cladera and Mari [37] 0.4540 0.6399 0.8104 0.2992 Elsanadedy et al. [12] 0.7043 0.8346 0.8777 -0.1921 MNLR (this study) 0.2729 0.3668 0.8789 0.7697 GMDH (this study) 0.2297 0.3132 0.9122 0.8321 MARS (this study) 0.2729 0.3668 0.8789 0.7697
developed models can predict the target values of the shear strength of HSC slender beams without web reinforcement with acceptable accuracy and less error than the available design codes over a wide range of input variables.
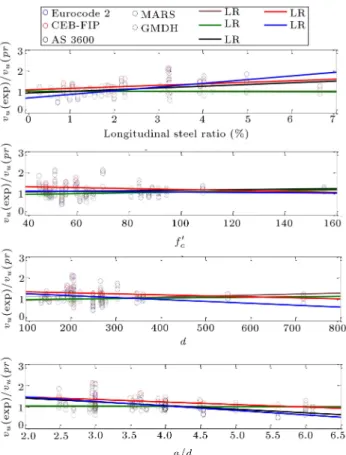
To have a deeper understanding of the errors in design codes, the Discrepancy Ratio (DR) between measured and predicted shear strengths as an error indicator was plotted against the most eective pa-rameters, including longitudinal steel ratio (), f0
c, d,
and a=d, for testing the dataset in Figure 3. The results of Eurocode-2 [33], CEP-FIP [34], and AS 3600-2009 [35], which had higher acceptable accuracy, were compared with those of GMDH and MARS models in this aspect. The best linear regression also ts prediction values of the mentioned models. Errors of an appropriate model should be independent of, or less sensitive to, the variation of the input parameters involved in that phenomenon. Otherwise, it can be interpreted that those input parameters are neither correctly incorporated or included in that model [42]. As shown in Figure 3, the errors of three design codes are sensitive to changes of as if their prediction varies from overestimation status to underestimation status as increases. It can be interpreted that this parameter is not correctly involved in their equations. On the
Figure 3. Variation of Discrepancy Ratio (DR) between measured and predicted shear strengths as a function of , f0
c, d, and a=d.
other hand, the errors of GMDH and MARS models are completely independent of this parameter.
According to this gure, the errors of all models are almost independent of parameters f0
c and d. Thus,
it can be expected that these parameters be probably well dened in the mentioned models. It should be noted that the errors of Eurocode-2 [33] in variation of parameter d are more than those of other models. In addition, sensitivity of the errors of GMDH and MARS models to variations of d and f0
cis less than that of the
three design codes. Figure 3 demonstrates the errors of the mentioned models as a function of parameter a=d. Of note, the predictions of design codes vary from underestimation status to overestimation status as a=d increases, and this inclination in CEB-FIP [34] model is less than the other two equations. As a result, these gures show that all input parameters are successfully included into the newly proposed models, and their errors are completely independent of these parameters. 5.2. Parametric and sensitivity analyses To further examine the robustness of the developed GMDH and MARS models, a parametric analysis can be carried out. Parametric analysis investigates how closely the model's predictions agree with available structural knowledge and experimental data and with one's expectation. Therefore, parametric analysis was carried out with the aim of gaining a deeper under-standing of concrete shear strength of HSC slender beams without web reinforcement. The parametric analysis investigates the response of the predicted shear strength from the proposed models to a set of hypothetical input data generated over the ranges of the minimum and maximum data used for the model training. The methodology was presented based on the change of only one input variable varied at a time, while the other variables were kept constant on their average in the applied datasets. A set of synthetic data for the single parameter was generated by increasing it incrementally. These inputs were presented for the prediction equation, and the shear strength was calculated. This procedure was repeated using another variable until the model's response was tested for all input variables.
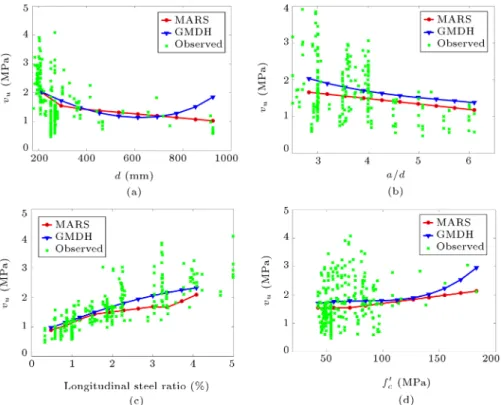
The results of the parametric analysis and, also, the used experimental data are shown in Figure 4. It can be seen that the prediction behavior of concrete shear strength from GMDH and MARS models agrees well with the experimental results. Figure 4(a) presents the variations of concrete shear strength as a function of eective depth (d). As shown, the failure shear stress decreases with the increase of eective depth. This behavior is well documented in the literature for RC slender beams without web reinforcement. There are two common approaches and hypotheses to explain this behavior: one of these approaches highlights the
Figure 4. Shear strength parametric analysis in GMDH- and MARS-based models for dierent ranges of (a) d, (b) a=d, (c) , and (d) f0
c.
role of aggregate interlock, which is reduced in larger members due to the development of wider cracks. The other common approach is based on fracture mechanic concepts, indicating that larger members release more energy, resulting in wider cracks.
The variations of predicted shear strength by GMDH and MARS models with a=d ratio are shown in Figure 4(b). As expected, the shear strength of RC beams decreases as a=d ratio increases. Furthermore, the prediction of shear strength almost coincides with the experimental test results obtained from literature, according to this gure. The ratio of a=d determines the behavior of deep and slender beams and also their failure modes. In deep beams, it can be expected that marginal enhancement of resistance occurs by the beam beyond the rst diagonal crack due to arch action with redistribution of stresses. On the other hand, failure occurs after the rst diagonal crack in slender beams. It is indicated that there is possible meager reserve strength beyond diagonal cracking. The similar eect of a=d ratio on shear strength of RC beams is also reported in the literature.
The eect of longitudinal steel ratio () on shear strength is presented in Figure 4(c). It can be seen that shear strength increases as the percentage of longitudinal reinforcement increases. This contribu-tion of longitudinal reinforcement in increasing shear resistance can be attributed to dowel action and can be about 30% in slender member, such as slabs. It should be noted that, in HSC beams, it demands higher
percentage of longitudinal reinforcement to enhance the dowel force than beams made of Normal Strength Concrete (NSC).
Based on Figure 4(d), it can be seen that the compressive strength of concrete increases the shear strength when all other parameters are constant. The shear strength in RC slender beams signicantly de-pends on the diagonal cracking strength. The diagonal cracking strength of a NSC beam without web rein-forcement is often expressed as a function of square root of compressive strength of concrete [30]. However, the shear strength of RC beams made of HSC tends to vary dierently from the square root of compressive strength of concrete. From these observations, it can be concluded that the developed GMDH and MARS models are in good agreement with the physical char-acteristics of shear strength phenomenon and previous ndings.
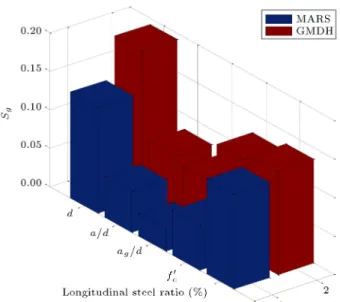
The data used in parametric analysis were also employed to explore and quantify the relative impor-tance of model inputs to its output by measuring the eects on the output when the inputs vary between their minimum and maximum in the dataset used. The quantication of this process was determined using the data obtained from holding all input variables at their average values except one output that varied between its ranges (xi2 fx1; x2; ; xng). The output
yi for n levels of particular input, xi, was used to
identify which variables have more inuence using the sensitivity measure, Sg, of the average gradient over all
Figure 5. Sensitivity analysis of important parameters based on GMDH and MARS models.
intervals as follows [43]:
Sg= n
X
i=1
jyi yi+1j = (n 1) : (26)
In fact, this approach investigates how output may change if the variables in the trained MARS and GMDH models are perturbed in their ranges. Figure 5 presents the calculated Sg values of GMDH and
MARS models for the eective depth, d, shear span-to-depth ratio, a=d, the aggregate size-span-to-depth ratio, ag=d, the compressive strength of concrete, fc0, and the
longitudinal steel ratio, . According to this gure, the eective depth provides greater importance and is considered the most signicant factor aecting the shear strength of HSC slender beams. On the other hand, the results demonstrate that the aggregate size-to-depth ratio holds the least importance. It can be also observed from this gure that the longitudinal steel ratio is the second important parameter and is followed by the compressive strength of concrete and the shear span-to-depth ratio.
5.3. Safety analysis
A reliable prediction of concrete shear capacity is vital for engineers to have a safe, technically correct
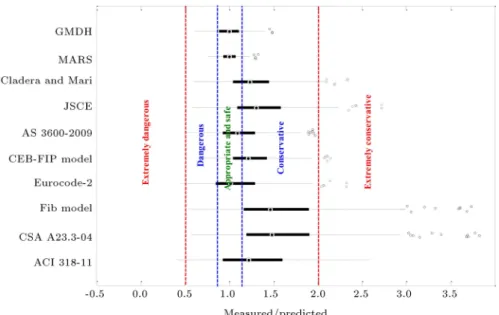
and cost-eective design. According to the previous sections, it can be expected that the uncertainty of the design codes is greater than that of the proposed ones due to their low accuracy. However, it is impossible to know the uncertainty or safety factor incorporated in them. To evaluate the reliability and uncertainty of the existing models, box plot of DR values of dierent approaches can be used. To generate each box, the DR values for entire database are sorted from the largest to smallest values; then, their median values specify the central mark of the box. The edges of the box represent the 25th and 75th percentiles. The generated box plot can be used as a tool to graphically demonstrate the uncertainty in dierent models. The spacing between dierent parts of the box indicates the degree of dispersion (spread) or skewness.
Furthermore, Collins [44] presented a new scale to evaluate and classify the reliability of design codes. This scale is known as Demerit Points Classication (DPC), which considers the safety, accuracy, and scattering of design codes as a function of the ratio between the ultimate resistance in experimental tests and the theoretically estimated shear capacity. In the present study, this ratio is represented by parameter DR. Table 6 presents an adaption in the present study derived from the original values proposed by Collins.
Figure 6 presents the box plots and DR values of dierent approaches. Furthermore, ve classied areas based on Collins criteria, including extremely danger-ous, dangerdanger-ous, appropriate and safe, conservative, and extremely conservative, are specied in Figure 6. As shown, ACI 318-11 [30], CSA A23.3-04 [31], and b model [32] equations are remarkably conservative and have the highest uncertainty (longer box) as if their pre-dictions vary from extremely conservative to dangerous areas and even extremely dangerous area for ACI 318-11 [30]. The other design codes are also conservative and their uncertainties are remarkable; however, their amounts are low and more reasonable than the three mentioned design codes. However, Figure 6 shows that box plots of the proposed MARS and GMDH models are narrower than those of others are, which is an indicator of a higher condence level. In addition, the proposed methods show good predictive capability in terms of accuracy with median values close to 1,
Table 6. Classication by demerit points.
vu;exp=vu;predicted Classication Demerit points < 0:50 Extremely dangerous 10
[0:50 0:85) Dangerous 5
[0:85 1:15) Appropriate and safe 0
[1:15 2:00) Conservative 1
Figure 6. Box plot of dierent equations.
unlike the design codes. It should be noted that the MARS model outperforms the GMDH model in this aspect.
In order to evaluate quantitatively the safety of the proposed models and existing design codes, rst, a demerit point is attributed to each prediction of these equations for total 250 data points based on Table 6. Then, the total values of demerit of each formula are calculated by the sum of the products of the number of specimens at each interval and their corresponding demerit penalty. The lower value of the total sum indicates that the considered formula is safer. Table 7 presents the evaluation of GMDH, MARS and also design equations as a function of the adapted criteria from Ramirez et al. [3]. According to this table, the equations of Eurocode-2 [33], ACI 318-11 [30], and CSA A23.3-04 [31] with respective 427, 413, and 315 total demerit points, as expected, have the weakest performance among design codes. The CEP-FIP [34] model presents the lowest total demerit points amongst the other design equations. However, 60% of its prediction values are either in the fourth classication range (between 1.15 and 2) or the fth classication range (greater than 2), which is classied as conservative and extremely conservative in terms of safety and leads to an unprotable design. The total demerit point of the proposed GMDH model is nearly equal to CEP-FIP equation. Unlike the CEP-FIP, 68.4% of GMDH predictions are classied in the third region, which is appropriate and safe. In general, the developed MARS model outperformed other design codes in terms of safety by improving the total demerit point by 69.6% with respect to CEP-FIP equation as the safest design code and GMDH model.
6. Concluding remarks
The robustness of Group Method of Data Han-dling (GMDH) and Multivariate Adaptive Regression Splines (MARS) as alternative approaches was investi-gated and assessed in prediction of the shear strength of slender HSC reinforced concrete beams. An available database, including 250 experimental tests of shear strength, was employed to develop the MARS and GMDH models. The proposed models related the shear strength to longitudinal steel ratio, the shear span-to-depth ratio, compressive strength of concrete, the size of the beam specimens, and the size of coarse aggregate. The predictive abilities of GMDH and MARS models were examined by comparing their predictions with those obtained from the most common formulae and MNLR regression approach. The most important outcomes of this study can be summarized as follows:
Among the existing equations in the literature, there was good agreement between measured and predicted maximum shear strengths using AS 3600-2009 equation. However, a notable number of its predictions were categorized in unsafe region based on Collins criteria. In contrast, the CEB-FIP model represented the safest predictions according to this criterion while its accuracy was remarkably limited;
The newly proposed GMDH and MARS models outperformed the existing design equations in terms of both accuracy and safety. The errors of the developed GMDH and MARS models also showed a symmetrical and predictable behavior. The MARS model also outperformed GMDH and MNLR models in both accuracy and safety aspects;
Table 7. Classication of dierent equations according to the criteria of Collins.
Model DR < 0:5 0:5 DR < 0:85 0:85 DR < 1:15 1:15 DR < 2 DR > 2 Demerit points
MARS | 23 207 20 | 135
| 23 5 207 0 20 1 |
GMDH | 37 171 42 1 227
| 37 5 171 0 42 1 1 2
ACI 318-11 6 38 64 121 21 413
6 10 38 5 64 0 121 1 21 2
CSA A23.3-04 | 12 40 141 57 315
| 12 5 40 0 141 1 57 2
Fib model code | 14 45 138 53 314
| 14 5 45 0 138 1 53 2
Eurocode-2 2 63 99 80 6 427
2 10 63 5 99 0 80 1 6 2
CEB-FIP model | 15 87 142 6 229
| 15 5 87 0 142 1 6 2
AS 3600-2009 1 40 108 101 | 311
1 10 40 5 108 0 101 1 |
JSCE | 14 65 154 17 258
| 14 5 65 0 154 1 17 2
Cladera and Mari [37] | 16 76 149 9 247
| 16 5 76 0 149 1 9 2
the proposed MARS model outperformed the other design equations in the literature. The proposed models yielded R2 = 0:94 and RMSE = 0:18 kN,
and this represented a 65.5% improvement in RMSE and a 88% improvement in terms of R2with respect
to AS 3600-2009 equation as the best equation among the other design equations;
The sensitivity analysis based on GMDH and MARS models indicated that shear capacity was mostly aected by eective depth, whereas the aggregate size-to-depth ratio were of the least importance. The longitudinal steel ratio was the second impor-tant parameter and was followed by the compressive strength of concrete and the shear span-to-depth ratio;
The robustness of GMDH and MARS models in capturing the underlying physical behaviors of shear strength was veried through parametric study. Results of parametric analysis were also conrmed by the outcomes of sensitivity analysis.
In general, the results indicated that GMDH and MARS algorithms could be successfully used as reliable alternative approaches to predict shear strength of HSC slender beams without web reinforcement.
References
1. ACI \Report on high-strength concrete, ACI 363R-10", American Concrete Institute, Detroit, MI (2010).
2. Taylor, H.P. \The fundamental behavior of reinforced concrete beams in bending and shear", Special Publi-cation, 42, pp. 43-78 (1974).
3. Ramirez, J.A., French, C., Adebar, P., Bonacci, J., and Collins, M. \Recent approaches to shear design of structural concrete", Journal of Structural Engineer-ing, 124(12), p. 1374 (1998).
4. Ashraf, H., Elzanaty, A.H.N., and Floyd, O.S. \Shear capacity of reinforced concrete beams using high-strength concrete", Journal Proceedings, 83(2), pp. 290-296 (1986).
large, lightly reinforced concrete beams, slabs, and footings?", Structural Journal, 96(4), pp. 482-490 (1999).
6. Maekawa, K., Toongoenthong, K., Gebreyouhannes, E., and Kishi, T. \Direct path-integral scheme for fatigue simulation of reinforced concrete in shear", Journal of Advanced Concrete Technology, 4(1), pp. 159-177 (2006).
7. Hamrat, M., Boulekbache, B., Chemrouk, M., and Amziane, S. \Shear behaviour of RC beams without stirrups made of normal strength and high strength concretes", Advances in Structural Engineering, 13(1), pp. 29-42 (2010).
8. Gebreyouhannes, E. and Maekawa, K. \Numerical simulation on shear capacity and post-peak ductility of reinforced high-strength concrete coupled with au-togenous shrinkage", Journal of Advanced Concrete Technology, 9(1), pp. 73-88 (2011).
9. Sagaseta, J. and Vollum, R. \Inuence of aggregate fracture on shear transfer through cracks in reinforced concrete", Magazine of Concrete Research, 63(2), pp. 119-137 (2011).
10. Carrasquillo, R., Nilson, A., and Slate, F. \Properties of high strength concrete subject to short-term loads", Journal Proceedings, 78(3), pp. 171-178 (2011).
11. Sarkar, S., Adwan, O., and Bose, B. \Shear stress contributions and failure mechanisms of high strength reinforced concrete beams", Materials and Structures, 32(2), pp. 112-116 (1999)
12. Elsanadedy, H.M., Abbas, H., Al-Salloum, Y.A., and Almusallam, T.H. \Shear strength prediction of HSC slender beams without web reinforcement", Materials and Structures, 49(9), pp. 3749-3772 (2015).
13. Gandomi, A., Alavi, A., and Yun, G. \Nonlinear modeling of shear strength of SFRC beams using linear genetic programming", Structural Engineering and Mechanics, 38(1), pp. 1-25 (2011).
14. Gandomi, A.H., Alavi, A.H., Gandomi, M., and Kazemi, S. \Formulation of shear strength of slender RC beams using gene expression programming, part II: With shear reinforcement", Measurement, 95, pp. 367-376 (2017).
15. Hasanipanah, M., Faradonbeh, R.S., Amnieh, H.B., Armaghani, D.J., and Monjezi, M. \Forecasting blast-induced ground vibration developing a CART model", Engineering with Computers, 33(2), pp. 307-316 (2017).
16. Kaveh, A., Bakhshpoori, T., and Hamze-Ziabari, S.M. \Derivation of new equations for prediction of princi-pal ground-motion parameters using M50 algorithm", Journal of Earthquake Engineering, 20(6), pp. 910-930 (2016).
17. Kaveh, A., Hamze-Ziabari, S.M., and Bakhshpoori, T. \Patient rule-induction method for liquefaction potential assessment based on CPT data", Bulletin of Engineering Geology and the Environment, pp. 1-17 (2017).
18. Khandelwal, M., Armaghani, D.J., Faradonbeh, R.S., Yellishetty, M., Majid, M.Z.A., and Monjezi, M. \Clas-sication and regression tree technique in estimating peak particle velocity caused by blasting", Engineering with Computers, 33(1), pp. 45-53 (2017).
19. Nasrollahzadeh, K. and Basiri, M.M. \Prediction of shear strength of FRP reinforced concrete beams using fuzzy inference system", Expert Systems with Applica-tions, 41(4), pp. 1006-1020 (2014).
20. Shetty, N., Herbert, M.A., Shetty, R., Shetty, D.S., and Vijay, G. \Soft computing techniques during drilling of bi-directional carbon ber reinforced composite", Applied Soft Computing, 41, pp. 466-478 (2016).
21. Kaveh, A. and Bakhshpoori, T. \A new metaheuristic for continuous structural optimization: water evapora-tion optimizaevapora-tion", Structural Multidisciplinary Opti-mization, 54(1), pp. 23-43 (2016).
22. Kaveh, A. and Bakhshpoori, T. \An accelerated wa-ter evaporation optimization formulation for discrete optimization of skeletal structures", Computers and Structures, 177, pp. 218-228 (2016).
23. Kaveh, A., Bakhshpoori, T., and Hamze-Ziabari, S.M. \M50and Mars based prediction models for properties of self-compacting concrete containing y ash", Peri-odica Polytechnica Civil Engineering, 62(2), pp. 1-17 (2017).
24. Kaveh, A., Bakhshpoori, T., and Hamze-Ziabari S.M. \New model derivation for the bond behavior of NSM FRP systems in concrete", Iranian Journal of Science and Technology, Transactions of Civil Engineering, 41(3), pp. 249-262 (2017). DOI:10.1007/s40996-017-0058-z.
25. Kaveh, A., Hamze-Ziabari, S.M., and Bakhshpoori, T. \Feasibility of pso-ans-pso and ga-ans-ga models in prediction of peak ground acceleration", International Journal of Optimization in Civil Engineering, 8(1), pp. 1-14 (2018).
26. Kaveh, A., Hamze-Ziabari, S.M., and Bakhshpoori, T. \M50 algorithm for shear strength prediction of HSC slender beams without web reinforcement", Interna-tional Journal of Modeling and Optimization, 7(1), pp. 48-53 (2017).
27. Ivakhnenko, A.G. \Polynomial theory of complex systems", IEEE Transactions on Systems, Man, and Cybernetics, 1(4), pp. 364-378 (1971).
28. Ivakhnenko, A.G. and Ivakhnenko, G.A. \Problems of further development of the group method of data handling algorithms. Part I", Pattern Recognition and Image Analysis c=c of Raspoznavaniye Obrazov i Analiz Izobrazhenii, 10(2), pp. 187-194 (2000).
29. Friedman, J.H. \Multivariate adaptive regression splines", The annals of statistics, 19(1), pp. 1-67 (1991).
30. ACI 318M-11, Building Code Requirements for Struc-tural Concrete and Commentary, American Concrete Institute (2011).
31. Association CS, Design of Concrete Structures, Cana-dian Standard Association (2004).
32. Du Beton FI, Model Code 2010: Final Draft, Interna-tional Federation for Structural Concrete (2012).
33. British Standards Institution, Eurocode 2: Design of Concrete Structures: Part 1-1: General Rules and Rules for Buildings, British Standards Institution (2004).
34. CEB-FIP, MC90 C, Design of Concrete Structures, British Standard Institution, London (1993).
35. Concrete Structures, Standards Australia. Sydney (2009).
36. Engineers JSoC, Standard Specications for Concrete Structures, Japan Society of Civil Engineers, JSCE Guidelines for Concrete (2010).
37. Cladera, A. and Mar, A.R. \Shear design proce-dure for reinforced normal and high-strength concrete beams using articial neural networks. Part I: beams without stirrups", Engineering Structures, 26(7), pp. 917-926 (2004).
38. Muttoni, A. \Punching shear strength of reinforced concrete slabs without transverse reinforcement", ACI Structural Journal, 105, Title no. 105-S42, pp. 440-450 (2008).
39. Amanifard, N., Nariman-Zadeh, N., Farahani, M., and Khalkhali, A. \Modelling of multiple short-length-scale stall cells in an axial compressor using evolved GMDH neural networks", Energy Conversion and Management, 49(10), pp. 2588-2594 (2008).
40. Frank, I.E. and Todeschini, R., The Data Analysis Handbook, Elsevier, 14 (1994).
41. Smith, G.N., Probability and Statistics in Civil Engi-neering, Collins London (1986).
42. Sahay, R.R. and Dutta, S. \Prediction of longitudinal dispersion coecients in natural rivers using genetic algorithm", Hydrology Research, 40(6), pp. 544-552 (2009).
43. Kewley, R.H., Embrechts, M.J., and Breneman, C. \Data strip mining for the virtual design of pharma-ceuticals with neural networks", IEEE Transactions on Neural Networks, 11(3), pp. 668-679 (2000)
44. Collins, M. \Evaluation of shear design procedures for concrete structures", A Report Prepared for the CSA Technical Committee on Reinforced Concrete Design (2001).
Biographies
Ali Kaveh was born in Tabriz, Iran in 1948. After graduation from the Department of Civil Engineering at the University of Tabriz in 1969, he continued his studies on structures at Imperial College of Science and Technology at London University and received his MSc, DIC, and PhD degrees in 1970 and 1974, respectively. He then joined the Iran University of Science and Technology. Professor Kaveh is the author of 550 papers published in international journals and 145 papers presented at national and international conferences. He has authored 23 books in Persian and 8 books in English published by Wiley, Research Studies Press, American Mechanical Society and Springer. Taha Bakhshpoori was born in Astara, Iran. He earned his BSc in Civil Engineering from University of Guilan (2009), MSc (2011), and PhD (2015) both in Structural Engineering from Iran University of Science and Technology. He joined the University of Guilan, Department of Engineering in Eastern Guilan as an Assistant Professor in December 2015. His research interests include the following: articial intelligence and its application to civil engineering problems, meta-heuristic modeling and optimization, multi-objective optimization, structural optimization, reliability, ro-bust, and risk-based design optimization, structural health monitoring and damage detection.
Seyyed Mahmood Hamze-Ziabari was born in Ziabar, Iran. After earning his BSc from the De-partment of Civil Engineering at the University of Tehran in 2012 and his MSc in Marine Structures from Iran university of Science and Technology in 2014, he currently continued his PhD also in Marine Structures at IUST. His research interests include water wave modeling, nearshore hydrodynamics and sediment transport, ocean data analysis, and articial intelligence and its application to civil engineering problems.