Understanding Small Area Variation in Late Preterm Births
in North Carolina
By
Sofia Aliaga, MD
A Master’s Paper submitted to the faculty of the University of North Carolina at Chapel Hill in partial fulfillment of the requirements for the degree of Master of Public Health in
the Public Health Leadership Program.
Chapel Hill 2010
Advisor and First Reader
Date
Second Reader
Abstract
Late preterm (LPT) neonates are those who are born between 34 0/7th and 36 6/7th weeks' gestation. LPT neonates account for 70% of all premature births in the United States; these neonates have a higher morbidity and mortality risk than do term
newborns. Variation in medical care that cannot be explained by population
characteristics or common risk factors may be a result of differences in health system performance, including physician or health care setting practice variation. Identifying geographic variation in LPT birth rates might uncover health care delivery processes whose improvement could lower the rate of LPT births. The purpose of this study is to test the feasibility of identifying otherwise unexplained variation in the incidence of LPT births in the six perinatal care regions of North Carolina, as measured in a linked birth-death certificate database from the North Carolina State Center for Health Statistics. Exclusion of infants with major congenital anomalies, unknown GA, less than 34 weeks’ gestation, and out-of-state births leaves us with data on 884,304 singleton infants of whom 66,218 (7.5%) were LPT. Controlling for sociodemographic and
Acknowledgements
I would like to express my gratitude to all those who helped make this work possible.
The research conducted for this paper would not have been possible without the
guidance and support of my readers Dr. Sue Tolleson-Rinehart and Dr. Martin
McCaffrey. I am also very grateful to Dr. Thomas Ivester, Dr. Matthew Laughon, and Dr.
Wayne Price for their expertise and advice in the development of this research, as well
as to Dr. P. Brian Smith for his help with statistical analysis. I would like to thank Paul
Buescher, Kathleen Jones-Vessey, Thomas Reeher and J. Timothy Whitmire from the
North Carolina State Center for Health Statistics, and Craigan L. Gray and Curtis Martin
from the North Carolina Department of Health and Human Services for access to the
Table of Contents
Abstract... ii
Acknowledgements ... iii
Table of Contents ... iiv
List of Tables and Figures ... v
Introduction: Practice Variation and Late-Preterm Birth ... 1
Practice variation ... 1
Late-Preterm Birth ... 4
Variation in Perinatal Care ... 8
Methods ... 10
Results ... 12
Discussion ... 16
Conclusion ... 20
Tables and Figures ... 23
Appendix 1: Further Background on Late-Preterm Birth ... 32
Appendix 2: Further Background on Variation in Perinatal Care ... 34
Appendix 3: Limited Systematic Review of the LPT Geographic Variation Literature.... 36
Appendix 4: Methods ... 40
Appendix 5: Perinatal Regionalization in North Carolina
...
48List of Tables and Figures
Table 1. Term and Late-Preterm Births by North Carolina Perinatal Region ………...……23
Table 2. Sociodemographic Risk Factors………..….24
Table 3. Medical.Obstetric Risk Factors………...25
Tables 4a and 4b. Regional Distribution of Sociodemographic Risk Factors………...26
Tables 5a and 5b. Regional Distribution of Medical/Obstetric Risk Factors………...……..27
Table 6. Unadjusted and Adjusted OR of Late-Preterm Birth by Region…...………..28
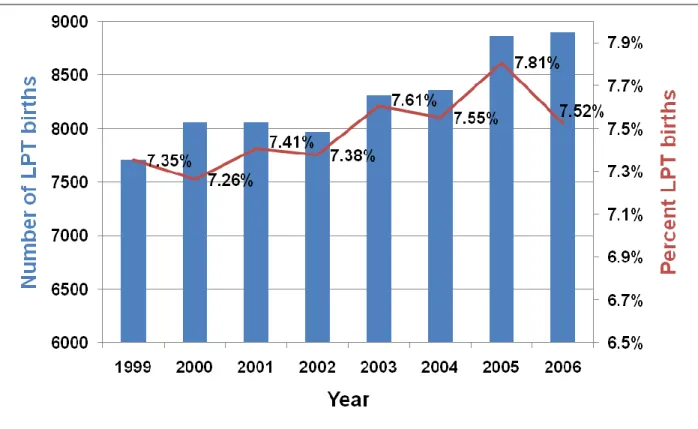
Figure 1. Late-Preterm Births, 1999 – 2006……….…………..29
Figure 2. Late-Preterm Births by Region, 1999 - 2006……….30
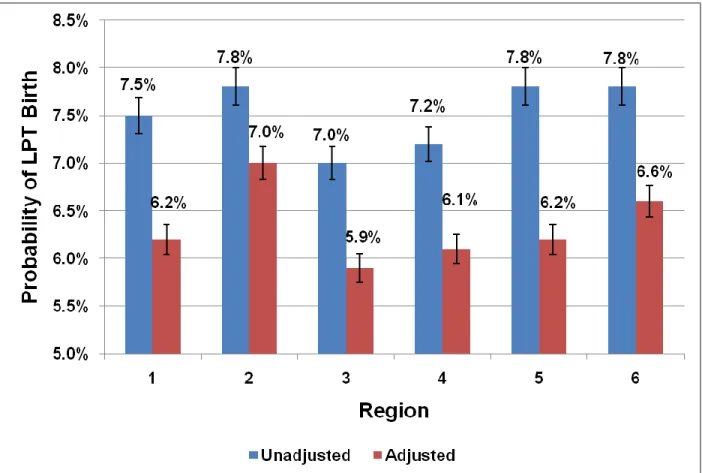
Figure 3. Unadusted and Adjusted Probabilities of LPT by Region………31
Table A-3. Critical Appraisal Table of Results of Literature Search………39
Table A-4a. Demographic and Descriptive Independent Variables………...……….46
Table A-4b. Clinical and Setting of Care Independent Variables………..47
Introduction
Neonates born between 34 0/7th and 36 6/7th weeks’ gestation (late-preterm, or LPT)
are 70% of premature births in the US. Late-preterm infants have a higher morbidity and
mortality risk than do term newborns. Identifying practice setting variation in rates of LPT birth
might uncover health care delivery processes whose improvement could lower the rate of LPT
births. Are public vital records reliable and valid sources of data for measuring practice setting
variation in late-preterm birth? Variation can influence a variety of medical services, including
hospitalization rates, receipt of surgical services, medications and diagnostic tests. A portion of
variation in care, known as unwarranted variation, is regarded as “the variation in medical care
due to differences in health system performance” (Goodman, pg.745) 1. This portion of variation
is unexplained by differences in population characteristics, but rather is due to differences in “the quality, appropriateness, and efficiency of health care” (Goodman, pg.749) 1. Variation in
care may not only influence health outcomes, but can lead to increased costs, inefficient use of
resources and the potential for unnecessary risk to the patient. This highlights the importance of
focusing not only on health outcomes when measuring quality of care, but also on the
processes of care that may contribute to variation.
Variation in care has been defined as “different observed levels of per capita consumption of a service” (Brook and Lohr, pg. 711) 2. Beginning with a critically important
publication in 1973 by John Wennberg and Alan Gittelsohn 3, otherwise apparently unwarranted
practice variation has been studied via small area analysis. Wennberg and Gittelsohn found
wide variations in resource use and expenditures even in different areas of a small state like Vermont. They concluded that variation reflected differences in individual physicians’ or groups
of physicians’ medical practice or decision making about the utilization of certain health care
indicate that there is considerable uncertainty about the effectiveness of different levels of aggregate, as well as specific kinds of, health services” – something that most would accept as
obvious today, but that was quite controversial when they made their findings known (Wennberg
and Gittelsohn, pg.1107) 3.
Variation in care may be associated with misuse, underuse and overuse of health care
resources and services. Research in both the medical and surgical fields has documented
examples of variation in the use of healthcare services 4-6. Explanations for variation in care
include the number of available physicians and hospital beds, socio-demographic composition
of populations, economic factors (access to health insurance, per capita health expenditure),
health status or severity of illness, and the uncertainty regarding the benefits of medical care
options 4-6. Variation in the use and outcomes of health care services can be seen across both
large (regions of the country and states) and small geographic areas (regions within states and
hospital market areas). Per capita variation in the use of procedures can range from two to
twelve-fold and hospital admission rates can vary eight to twelve-fold 2. Variation persists
despite differences in reimbursement methods and the presence of national health care delivery
systems 2, 5, 7.
Variation in the use of services is still found despite minimal differences in the patient
characteristics that determine the demand for health care 6. Therefore, part of the explanation
for the variation occurs after the patient decides to seek care. Patients seek care in a particular
health care system and geographic location, hospital or clinic with a certain proportion of
available beds and services, proportion of general practitioners, surgeons and subspecialists.
Even within areas where health status and socio-demographic variations are minimal, the
number of hospitals, physicians and specialists in proportion to the population vary significantly
6. As previously stated, even when taking these factors into consideration, differences in the
of physician” (Wennberg, pg.265) 6 or health care provider practice style 2. This may also
correspond to the practice style of a group of providers or hospital(s) within an area. A study of
the Veteran Affairs health system, a highly centralized system with uniform administrative
policies and procedures, a fairly homogenous patient population and salaried physicians,
revealed geographic variations in the use of inpatient and outpatient services for a variety of
chronic diseases 5. Other evidence supporting this notion comes from the observation of
decreased variation in the use of services once health professionals are made aware of the
differences and practice is modified 6, 8. The practice style factor has a critical role in determining
what health services are provided to a given patient 8, 9.
A degree of practice style variation is expected based on differences in a population’s
incidence of disease, patient preferences, and availability of resources 9. However, analysis
taking into account these differences should explain this variation. Frequently it is the
uncertainty about the appropriateness or effectiveness of a given service that leads to
differences in opinion at the provider level and subsequently to variations in its use. Low levels
of variation may reflect significant consensus on how to treat a condition or may represent
underuse of an effective and appropriate service 2. High rates of variation may represent
overuse of a not so appropriate or effective service 2. It is also important to remember that health care professionals’ decisions will be influenced by other factors such as concerns for
medical litigation and physician convenience 8. Not only can uncertainty, but also “biases, errors, and differences of opinions, motives and values” (Eddy, pg.75) 9
influence physician
practice. Uncertainty can affect how physicians define a disease, make a diagnosis, select a
procedure or treatment, assess preferences, and observe outcomes. The influence of
uncertainty can also lead physicians to practice “safety in numbers”, in other words to do what in
A lack of clarity as to the appropriateness or effectiveness of medical interventions leads
to difficulties in standardizing the care provided and to uncertainty about whether we are
optimizing outcomes 2. Without good measures of quality we cannot interpret what low or high
variations in services mean, and how and if they should be regulated 2. Even though consensus
may not always be possible, attempts should be made to minimize variation in services provided
in order to optimize the efficiency and safety of the care provided.
Late-preterm birth contributes significantly to neonatal and infant morbidity, as well as health care costs. Premature birth, or birth before 37 weeks’ gestation, affects approximately
12% of all live births or slightly over half a million newborns, each year in the United States; this
is an increase of almost 12% since 1990 10, 11. Premature newborns are at increased risk for
short and long-term complications, including respiratory disease, frequent hospitalizations,
neurodevelopmental impairment, blindness, and deafness 12. They also face higher mortality
rates compared to term infants 10. The infant mortality rate for those born less than 32 weeks’
gestation is 75 times that of term infants (183.24 vs. 2.43 per 1000 live births). A subset of
premature newborns, born between 34 0/7th and 36 6/7th weeks’ gestation, are known as
late-preterm. This subset of newborns accounts for over 70% of all premature births in the United
States 11. Increasing rates of late-preterm birth are responsible for the majority of the rise in premature births in the United States. In 1990, the birth rate for those born under 34 weeks’
gestation was 3.32%, while the late-preterm birth rate was 7.30%. By 2006, the late-preterm birth rate had increased by 25% to 9.15% and the birth rate for those born under 34 weeks’
gestation increased by 10% to 3.66%. In 2007, the U.S. late-preterm birth rate was 9.03% or
approximately 389,000 newborns; this was a slight decrease from 2006. Late-preterm mortality
is three times that of term newborns (7.3 vs. 2.4 per 1000 live births)13.
Even though the individual cost per patient born at the extreme of prematurity is much
higher than for one born late-preterm, the contribution to the overall cost of neonatal care is
significant because of the greater numbers of late-preterm births. A population-based study in
California showed that over a one year period, the total neonatal hospital cost for babies born
late-preterm was $125.3 million compared to $114.9 million for those born at less than 28 weeks
gestation 14. When compared to term infants, late-preterm infants incur higher health care costs
during the birth hospitalization and through out the first year of life, with total first year costs after
birth discharge three times that of term infants 15.
Reasons for increasing rates of late-preterm births are unclear and likely are attributable
to a variety of causes. Contributing factors include increased obstetrical surveillance of at-risk
pregnancies, higher numbers of medically indicated deliveries and multiple births, more mothers
of advanced maternal age, increased use of assisted reproduction technologies, and the goal of
reducing still-births and maternal morbidity/mortality 16, 17. The increase in late-preterm birth has
occurred in parallel to increasing rates of cesarean deliveries and labor inductions 10, 11. This has
led to some general speculation that increasing rates of late-preterm birth may in part represent
a greater number of iatrogenic births resulting from higher rates of these obstetric procedures.
Late-preterm newborns frequently appear and behave similarly to term neonates. However, despite birth weights close to that of term newborns and their apparent “maturity”,
late-preterm newborns are still at increased risk for morbidity and mortality compared to term
newborns 17-21. Results from multiple studies have demonstrated that late-preterm neonates are
at increased risk for complications at the time of birth, as well as long-term morbidities 15, 21-30.
The infant mortality rate for late-preterm newborns is 3 times that of term newborns (7.3 vs. 2.4
per 1000 live births) 13. Just as with the issue of health are costs, even though morbidity and
mortality statistics are significantly lower for this group of preterm infants when compared to
According to the recent U.S. birth statistics, there were 156,712 very preterm births and 389,836
late-preterm births in 2007 11. Wang et al 22 published one of the first studies showing the late-preterm neonates’ increased risk for temperature instability, hypoglycemia, respiratory distress,
and jaundice. Reports from both a workshop sponsored by the National Institute of Child Health and Human Development and the American Academy of Pediatrics’ Committee on Fetus and
Newborn have summarized research supporting these findings 17, 18. Other significant
morbidities reported in the previously cited studies include higher rates of apnea, feeding
difficulties, sepsis, and screening for sepsis. Late-preterm infants are also more likely to have
longer initial hospitalizations, be admitted to a neonatal intensive care unit, and have higher
rates of readmissions after discharge from the birth hospitalization 17, 18.
Data on long-term outcomes of late-preterm infants is only now emerging. Long-term
neurodevelopmental problems encountered by late-preterm infants include cerebral palsy (more
than 3 times as likely as term infants), developmental delay, and school-related problems 28, 29.
Recognizing both the short and long-term consequences of late-preterm birth is essential to the
development of policies to reduce its occurrence.
The consequences of prematurity have fueled efforts to prolong pregnancy when there is
the potential for a preterm birth. However, as pregnancy approaches term the balancing of risks
and benefits of prolonging pregnancy becomes more difficult. As a pregnancy advances this
balance shifts towards preterm delivery because the incidence and severity of prematurity
related morbidity and mortality decrease significantly. Spontaneous preterm labor accounts for
up to approximately 50% of preterm births, including late-preterm births 16, 21, 31-33. Prevention of
spontaneous preterm birth continues to be an important focus of perinatal research. Maternal
and fetal medical conditions associated with late-preterm delivery include preterm premature
rupture of membranes, intrauterine growth restriction, hypertensive disorders of pregnancy,
high-risk obstetric/medical co-morbidities may indicate the need for preterm delivery when either
maternal or fetal well-being is in question. Management of many of these conditions during
late-preterm gestation differs from that in earlier stages of pregnancy, during which complications
from a very premature birth commonly outweigh continuing the pregnancy.
Obstetric practice has traditionally considered 34 weeks gestation an obstetrical
milestone and marker of maturity; obstetric management of many pregnancy complications
change at this point and fewer attempts are made to prolong the pregnancy 12, 16. Approximately
35 to 40% of preterm births are associated with the previously mentioned co-morbidities and are
therefore considered medically indicated or iatrogenic 34. There is evidence to support that this
proportion of iatrogenic deliveries also applies to late-preterm births 16, 21, 31, 32, 35.
Differences in obstetrical management at late-preterm gestations can be seen in the use
of antenatal corticosteroids and tocolytics. Spontaneous preterm labor at a gestational age less
than 34 weeks is frequently managed with medications for tocolysis in an attempt to stop
preterm labor, and treatment with antenatal corticosteroids in order to promote fetal maturation
16, 36. The American College of Obstetrics and Gynecology, following the National Institute of
Health recommendations, recommends the use of antenatal corticosteroids for women at risk of
preterm birth at less than 34 weeks gestation 36. Given that antenatal corticosteroids are not
recommended after 33 completed weeks of gestation, tocolysis is also not recommended, and
preterm labor is allowed to continue. Common medical conditions leading to preterm birth
include preterm premature rupture of membranes, maternal hypertensive disorders; and
intrauterine growth restriction and oligohydramnios (see Appendix 1, Further background on
Variation in Perinatal Care
The practice of perinatal and neonatal care has undergone significant growth over the
last few decades. Advances in medical technology have improved the outcomes of ill term
neonates and those facing the consequences of preterm birth. Neonatal intensive care is
expensive; costs of care for preterm/low birth weight infants throughout the first year of life were
estimated at $5.8 billion in 2001 or 47% of all infant hospitalizations 37. According to a 2006
report by the Institute of Medicine, the annual societal cost of preterm birth is estimated at $26
billion 12. The growth of neonatal intensive care capacity has not occurred evenly across the
country, with up to a 4-fold regional variation in the number of neonatologists 38. The medical
technologies that are part of perinatal care and neonatal intensive care, as well as the regional
organization of their services have been shown to decrease morbidity and mortality of preterm
and sick term neonates 39, 40. Despite efforts prematurity and low birth weight remain the second
leading cause of infant mortality in the United States and also lead to significant morbidities in
surviving infants 13. Perinatal and neonatal care are marked by variations in opinion about the
ideal management of certain conditions given the lack of consensus within the fields. Insufficient
evidence for a variety of practices can lead to different approaches to perinatal and neonatal
medical care, such as the mode and timing of delivery and management of hospitalized
newborns.
Low birth weight (LBW) and prematurity are national problems, but they are distributed “unevenly across communities and their perinatal populations” (Thompson et al, pg.1114) 41.
Few studies have evaluated the contribution of geographic location of maternal residence and
health care delivery to neonatal outcomes including premature and LBW births 41. The effect of
variation in care on outcomes, costs and health care system performance are not well
described. Recognizing variation in perinatal and neonatal services may offer more insight into
systems41. This will help identify areas that would benefit from additional research, prevention
and quality improvement efforts. Areas demonstrating low variation may serve as benchmarks
for others.
Variations in the use of neonatal services should reflect differences in the distribution of
neonatal health risks 42. Unexplained variations may be due to differences in medical practice,
policies, procedures and the organization surrounding perinatal/neonatal care 42. Studies have
found geographic variations in perinatal/neonatal services (low birth weight births, use of levels
of neonatal care, hospitalization and length of stay of term newborns) that persist after adjusting
for neonatal health risks 41-43. In one of these studies differences in practice between general
pediatricians and neonatologists appeared to explain an additional component of variation in
care 42. Other studies have found variation in the use of obstetrical services, such as antenatal
testing, cesarean deliveries, and induction of labor 43-46 (See Appendix 2, Further background on
variation in perinatal care and Appendix 3, Limited Systematic Review, for more discussion).
Quality of health care has been defined as “the degree to which health services for
individuals and populations increase the likelihood of desired health outcomes and are consistent with current professional knowledge” (www.iom.edu) 47. Delivering health care to individuals and populations requires interactions within and among the multiple dimensions of
health care services. The qualities and outcomes of these interactions will depend on many
factors including geographic location, medical diagnosis, treatment options and availability,
patient socio-demographic factors, physician training and experience, health insurance
coverage, and ability to pay. The presence of a multitude of factors that determine the health
service interaction can result in variations in the care provided and therefore variation in the
quality of care. Few studies have attempted to describe unwarranted variation in the incidence
births among North Carolina’s six perinatal care regions that cannot be explained by risk factors
or population differences.
Methods
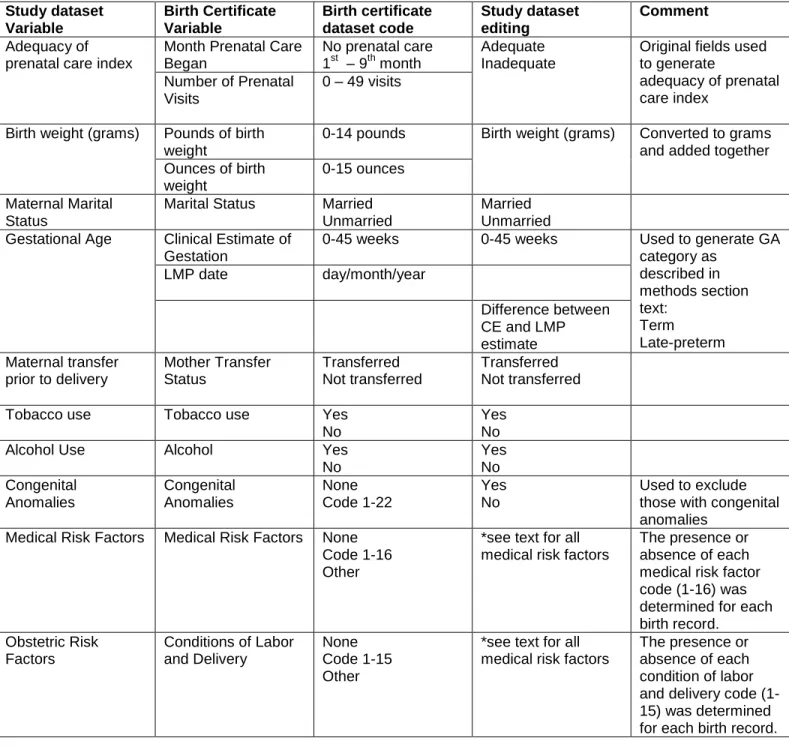
Data were obtained from the North Carolina State Center for Health Statistics’ linked
birth-death certificate database. I searched for all singleton live births between 1999 and 2006. I
then excluded neonates with major congenital anomalies, unknown gestational age, unknown
birth weight, gestational age less than 34 weeks, those with a birth weight less than 1000
grams, and out-of-state births. North Carolina birth certificates include a field with the date of
last menstrual period and a field indicating a clinical estimate of gestational age. Each birth was assigned into one of three gestational age categories: less than 34 weeks’ gestation (very
preterm), 34 0/7th to 36 6/7th weeks’ gestation (late-preterm), and 37 weeks’ gestation or greater
(term). Gestational age was determined by last menstrual period dating when available, as long
as the difference between the last menstrual period estimate and the clinical estimate of
gestational age was less than two weeks. If the date of last menstrual period was missing or the
difference between the last menstrual period estimate and clinical estimate was two weeks or
greater, the clinical estimate was used to define the gestational age. Information on Medicaid
status at time of birth was linked to this dataset with permission from the North Carolina Department of Health and Human Services’ Division of Medical Assistance. Each birth was
assigned to one of six perinatal care regions in North Carolina based on the county of birth.
See Appendix 4, Methods, for further information on the calculation of gestational age, and data
editing to generate final versions of the variables used in the analysis, and Appendix 5, Perinatal
The main exposure variable was the region of birth. The primary outcome was whether a
late-preterm birth occurred, stratified by North Carolina prenatal region. Table 1 shows the final
descriptive statistics and odds ratios of the distribution of LPT by region. The analysis controls
for twelve independent sociodemographic variables: maternal race, maternal age, maternal
education, marital status, parity, adequacy of prenatal care, tobacco use, alcohol use, Medicaid
status, gender, maternal transfer prior to birth, and birth year. Table 2 shows descriptive
statistics and odds ratios for the sociodemographic variables. Twenty-two independent
medical/obstetric variables controlled for possible medical indications for preterm delivery: previous small for gestational age/preterm birth, previous birth of a ≥ 4000 gram infant, placenta
previa, placental abruption, premature rupture of membranes, pregnancy associated
hypertension, eclampsia, chronic hypertension, hydramnios/oligohydramnios, incompetent
cervix, diabetes, cephalo-pelvic disproportion, uterine bleeding, maternal anemia, maternal
cardiac disease, maternal renal disease, maternal fever during labor/delivery, malpresentation,
maternal lung disease, genital herpes, maternal Rh sensitization, and maternal
hemoglobinopathy. Chi-square analysis was used to examine the association between
sociodemographic and medical/obstetric risk factors and late-preterm birth, and to determine the
unadjusted incidence of late-preterm birth for each perinatal region. Logistic regression was
used to calculate the unadjusted and adjusted odds ratios and probabilities of late-preterm birth
for each region. The descriptive statistics and adjusted odds ratios for the medical/obstetric
variables are presented in Table 3. Adjusted odds ratios and probabilities were determined
after controlling for the sociodemographic and medical/obstetric risk factors mentioned above.
All data analyses were performed using STATA 10.1 statistical software package (College
Station, Texas).
The calculation of gestational age from public vital records deserves special mention.
the dependent variable. The Methods Appendix discusses a variety of data editing strategies
for the estimation of gestational age from birth certificate data. In this study, I have used a last menstrual period/clinical estimate (LMP/CE) composite approach in order to obtain a more conservative estimate of gestational age. This definition would characterize more late-preterm
newborns classified as term (this method has been shown to lead to lower estimates of
premature birth). The LMP/CE composite estimate of gestational age is independent of birth
weight. Using methods that incorporate birth weight as a proxy for gestational age may not be
appropriate for studies of late-preterm births given that their birth weights overlap with that of
term neonates. Part of data editing for this study involved excluding those newborns with birth
weights less than 1000 grams. This was done do decrease misclassification bias, since the
majority of babies born at less than 1000 grams will be of a very premature gestational age.
Very preterm births were excluded because it is likely that their geographic pattern of delivery is
different than that of term and late-preterm infants. Large portions of these newborns are
delivered at tertiary care centers with specialized neonatal intensive care units. Late preterm
birth patterns are more likely to parallel those of term gestations. Also, the delivery
decision-making process and delivery threshold are likely to be different at very preterm gestational ages.
Results
There were 926, 915 singleton live births in North Carolina between 1999 and 2006;
42,611 births met exclusion criteria. This resulted in a total of 884,304 late-preterm and term
neonates available for further analysis in the final dataset. Of these, 66,218, or 7.5% of the final
dataset, were preterm. Results show that there was a net increase in the rate of
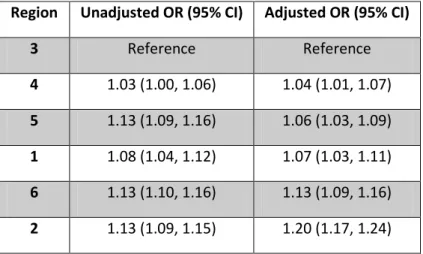
As is evident in Table 1, perinatal regions 1, 2, 5, and 6 had rates of late-preterm birth at
or above the state average for the 8-year period; rates of late-preterm birth in regions 3 and 4
were below the state average (graph 2). Regions 2, 5 and 6 had similar rates of late-preterm
birth (7.79%, 7.82%, and 7.83%, respectively) (p>0.05). Region 3 had the lowest incidence of
late-preterm birth at 6.98% and thus served as the reference region in the analysis. Differences
in rates of late-preterm birth between the reference region and all other regions were statistically
significant, with p-values ranging from <0.001 to 0.02. Differences were also statistically
significant between region 2 and regions 1 (p=0.02) and 4 (p<0.001). The difference between
the reference region (region 3) and the next lowest risk region, region 4, was small but
statistically significant (p=0.01). Differences between region 4 and regions 5 and 6 were small,
but statistically significant (p<0.001). Similar findings were seen between region 1 and regions 5
and 6 (p=0.02 and p=0.01).
Tables 2 and 3 show the sociodemographic and medical/obstetric risk factors most
strongly associated with late-preterm birth and the full multivariable logistic regression model
used to assess the association between region of birth and late-preterm birth. The following
sociodemographic variables were associated with a late-preterm birth: maternal age less than 20 years and ≥ 35 years, non-Hispanic black race/ethnicity, less than high school education,
unmarried, inadequate prenatal care, alcohol use, tobacco use, maternal transfer prior to
delivery, Medicaid recipient, multiparity, and male gender. Maternal age ≥ 40 years was the age
group most strongly associated with late-preterm birth. The medical/obstetric variables most
strongly associated with late-preterm birth were: preterm rupture of membranes, placenta
previa, placental abruption, previous SGA/preterm birth, pregnancy related hypertension,
eclampsia, chronic hypertension, incompetent cervix, uterine bleeding, and
Few studies have reported the socio-demographic and medical risk factors associated
with preterm births. A study evaluating early school-age outcomes in a cohort of
late-preterm and term infants in Florida compared the demographic characteristics of these two
groups 28. This study also applied a composite LMP/CE method for defining gestational age
from birth certificate data. Differences in sociodemographic characteristics between the term
and late-preterm groups were similar to our results. Maternal black race, maternal age less than
20 years, less than high school level education, tobacco use, inadequate prenatal care, single
marital status, Medicaid enrollment, and multiparity were all more common in the late-preterm
group. The sociodemographic risk factors associated with preterm birth have been well
described, and include maternal age (teenage mothers OR 1.17 [1.16-1.17], older maternal age OR 1.21 [1.20 – 1.21]), low level of maternal education (OR 1.11 [1.11-1.12]), single maternal
marital status (OR 1.23 [1.23-1.24]), high parity (1.27 [1.26-1.28]), African-American race (OR
1.69 [1.68-1.70]), and smoking (OR 1.26 [1.25-1.26]) 12. Our results confirm that these risk
factors also hold true for late-preterm births.
Medical/obstetric risk factors for preterm birth include previous low-birth weight or
preterm delivery, nulliparity, placental abnormalities, cervical and uterine abnormalities, bleeding
during pregnancy, IUGR, infant sex, low pre-pregnancy weight, and preeclampsia 34. A study of over 680,000 births in Missouri’s birth certificate data file described the association between
medical conditions and preterm delivery at less than 35 weeks’ gestation 48
. Results showed the
following associations: preeclampsia (RR 2.6 [2.5, 2.7]), placental abruption (RR 8.8 [8.3, 9.3]),
chronic hypertension (RR 1.9 [1.7, 2.1]), placenta previa (RR 3.7 [3.3, 4.1]), and diabetes (RR
1.1 [1.0, 1.2]). Authors found that preeclampsia was associated with 10% of preterm births and 3.9% of births ≥ 35 weeks’ gestation. Chronic hypertension was associated with about 2% of
preterm births and 0.8% of births ≥ 35 weeks. Placental abruption was found in 5.8% of preterm
births less than 35 weeks gestation and 0.3% of births ≥ 35 weeks. Diabetes was associated
with 3% of preterm births and 2.4% of births ≥ 35 weeks’ gestation. Our findings show similar
trends in the rates of these medical co-morbidities and late-preterm births.
Tables 4a and b, and 5a and b show the regional distribution of sociodemographic and
medical/obstetric risk factors. There was marked regional variation of maternal race/ethnicity,
with region 1 having the lowest percent of non-Hispanic black births (5.2%) and region 6 the
highest (34.4%). Rates of inadequate prenatal care were also notably different between regions
with up to 20% of births in region 4 associated with inadequate prenatal care, compared to
11.9% in region 1. Rates of tobacco exposure also varied between regions. Region 4 had the
lowest rate (8%) and region 1 the highest (19.1%). Region 1 had the highest percent of births
associated with Medicaid enrollment at the time of delivery (54.3%); regions 3 and 4 had the
lowest at 35.2% and 36.3%, respectively. The regional differences in medical/obstetric risk
factors that were particularly notable were related to rates of pregnancy-related hypertension
and eclampsia. Region 1 had the highest rate of pregnancy-related hypertension (7.4%) and
region 4 the lowest (3.6%). Region 5 had the highest rate of eclampsia (0.6%), while the lowest
rate was seen in region 3 (0.1%).
After multivariate logistic regression controlling for sociodemographic and
medical/obstetric risk factors, regions 2 and 6 had the highest adjusted probability of
late-preterm birth (7.0% and 6.6%, respectively). Results show that risk factors and population
differences explain some of the regional variation in late-preterm births in North Carolina (see
graph 3). For example, regions 2, 5, and 6 had equivalent unadjusted late-preterm birth rates.
After adjusting for risk factors, region 2 had a higher late-preterm birth rate than regions 5 and 6
(p<0.001). Likewise, the unadjusted late-preterm birth rate for region 5 was higher than regions
3 and 4. After adjusting for risk factors, differences between these regions decreased and there
other regions was statistically significant (p<0.001). Similar results were found between region 6
and all other regions (p-values 0.003 to <0.001). Again, differences between the reference
region and all other regions were statistically significant, with p-values ranging from <0.001 to
0.006. A difference in the probability of late-preterm birth was no longer seen between regions
1, 4 and 5. The adjusted probability of late-preterm birth in region 1 (6.2%) approached that of
region 3 (5.9%), but the difference remained statistically significant. Table y shows multivariate
logistic regression results expressed as odds ratios for each region, with region 3 as the
reference region.
Discussion
Analysis of a statewide birth cohort can reliably and validly demonstrate the presence of variation in the incidence of late-preterm births among North Carolina’s perinatal regions.
Regional variation persisted even after adjusting for population differences in
socio-demographic and medical risk factors. Practice variation and health care system differences between regions might explain some of the remaining difference. Of North Carolina’s six
perinatal regions, regions 2 and 6 were found to have the highest adjusted rates of late-preterm
birth.
Underlying population differences are an expected source of regional variation in the
incidence of late-preterm births. Significant study population differences include the prevalence
of births to non-Hispanic black women, rates of inadequate prenatal care, tobacco use and
Medicaid enrollment. Our data show that these sociodemographic characteristics are more
Despite the finding of regional differences in sociodemographic risk factors, no
discernible pattern in preterm birth rates emerged. Regions with the highest rates of
late-preterm birth did not necessarily have the highest prevalence of sociodemographic risk factors.
For example, region 2 is the region with the highest late-preterm birth rate, and is also the
region with the second lowest percent of births to non-Hispanic black women, the second lowest
rate of inadequate prenatal care, but of the highest rates of tobacco use. Region 4 had one of
the lowest rates of late-preterm birth, but at the same time the third highest percent of births to
non-Hispanic black women, the highest percent of inadequate prenatal care, but the lowest rate
of tobacco use.
Our results reveal that the medical conditions most strongly associated with late-preterm
birth include: PROM, placental disorders, hypertensive disorders, previous SGA/preterm birth,
incompetent cervix, uterine bleeding, hydramnios/oligohydramnios, and maternal diabetes. Of
these, hypertensive disorders demonstrated the most notable regional variation compared to
other medical risk factors, but again there was no specific pattern for high and low late-preterm
birth risk regions. Regional differences in medical/obstetric risk factors were also seen, but to a
smaller degree. This finding may be in part due to known limitations of birth certificate data due
to the underreporting of medical and obstetric risk factors.
Given the presence of sociodemographic and medical risk factor population differences,
some regional variation in the incidence of late-preterm birth is expected. Variation between
regions decreased after controlling for these factors using statistical analysis, but the probability
of late-preterm birth remained significantly higher in some regions (regions 2 and 6). Other
regions with similar risk profiles demonstrated adjusted probabilities of late-preterm birth that
approximated that of regions with the lowest late-preterm birth rate. Population differences
represent unwarranted variation or variation related to health care system performance, including practice style variation.
Analysis of vital statistics does not allow one to draw conclusions about the clinical intent
surrounding a birth 49. Learning more about the qualities and characteristics of the clinical intent
or decision-making that accompany late-preterm birth, such as from detailed review of medical
records would be required to help us understand how we can improve the quality of perinatal
health care services. However, my analysis does allow for an initial examination looking for the
presence of practice style variation as a contributing factor to rising rates of late-preterm birth.
In this study, I am constrained by the limitations of both completeness and accuracy of birth
certificate data, the use of somewhat arbitrary and large geographic regions, and the inability to
assess the clinical intent or appropriateness of delivery. Limitations in the use of vital statistics
include inaccurate estimates of gestational age, as well as the underreporting of obstetric
procedures, complications of labor and delivery, and maternal and fetal medical conditions 49-53.
The random and non-random nature of this underreporting is unclear. Associated maternal and
fetal medical conditions and complications of labor and delivery were used to adjust for high-risk
pregnancies (potential indications for delivery) that would explain some of the variation in rates
of late-preterm birth. Underreporting of medical conditions would produce a bias towards
underestimating the contribution/association of a high-risk medical/obstetric condition to that
birth, particularly since a late-preterm birth would in theory be more likely, than a term birth, to
be associated with a high-risk condition. This might have led us to overestimate the variation of
late-preterm birth between regions, particularly if underreporting of associated medical/obstetric
conditions occurred unevenly across the regions. Evidence to support if and to what degree
differential reporting occurs is not available. As I note in the Methods Appendix, the different
It is possible that the regional differences in rates of late-preterm births found in this
analysis are attributable to risk factors that vital statistics data do not capture, including other
associated medical co-morbidities requiring delivery and patient preferences. Practice style variation should be included among these “unmeasurable” variables.
The evidence base available to support the management of many perinatal high-risk
medical conditions is limited. Further research is difficult given the need to balance small, but irreversible maternal and neonatal outcomes against more common but “less severe”
morbidities. This dilemma is particularly pertinent to the late-preterm gestational age group in
which outcomes, such as mortality and severe complications related to prematurity (for example
intraventricular hemorrhage, bronchopulmonary dysplasia, retinopathy of prematurity, and necrotizing enterocolitis), are uncommon, and there is a perceived “wellness” of late-preterm
newborns. Until a more solid evidence base can be built we need to continue to use available
data to look closely at the quality of the perinatal services surrounding late-preterm births. If
variation in the quality of these health services influences rates of late-preterm birth, then efforts
to decrease variation may help to decrease rates of preterm birth. This approach may not
always prevent a late-preterm birth, but may delay delivery until additional fetal maturity is
achieved in the hopes of preventing neonatal morbidity. This implies a continuous struggle to
balance this benefit with small but real maternal and fetal risks of prolonging pregnancy.
The following scenario taken from our study results can help characterize the influence
that unwarranted variation may have on late-preterm birth rates. If the highest risk region, region 2, had the adjusted preterm birth rate of the reference region, then the entire cohort’s
late-preterm birth rate could decrease by 5.8% (n=3811 fewer late-late-preterm births). If we applied the same thought process to region 6, the region with the second highest risk, then the cohort’s
late-preterm birth rate would decrease by a total of 9.7% (n=6425 fewer late-preterm births)
births if the remaining differences between regions were due to modifiable factors, such as
elements of the health care delivery system. Even if half of this change could be achieved, the
late-preterm birth rate would still be significantly lower. This approach considers a reduction in
preterm birth, however even if these late-preterm births could not be prevented, delaying them
would potentially lead to decreased neonatal morbidity and a reduction in health care costs.
Conclusion
Differences in physician or health care setting practices are an area where policy
changes and quality improvement efforts can help decrease variation. Examples of the levels at
which policy changes can be initiated and disseminated include specialty physician
organizations, state quality collaboratives, national benchmarking, insurers, and patient
organizations.
A portion of iatrogenic late-preterm births may be preventable either because they are “purely” elective deliveries or are associated with a high-risk but stable condition. These
categories represent a potential source of preventable late-preterm births. Firm evidence on what proportion of late-preterm births fall under the category of “preventable” births, or what
could also be termed “delay-able” births, is difficult to establish without large population-based
prospective studies. Retrospective studies using data from either medical records or
administrative databases provide some evidence. Reddy et al 35 found that the
socio-demographic characteristics of iatrogenic late preterm births without associated medical
indications appear to be different than traditional sociodemographic risk factors. Births were
classified according to indication for delivery, into one of the following five groups: maternal
medical conditions, obstetric complications, major congenital anomalies, isolated spontaneous
isolated spontaneous labor, 16% were recorded as having obstetric complications, 1% as
having major congenital anomalies, and 23.2% were classified as deliveries without recorded
indication. These authors found that late-preterm births without a recorded indication were
associated with higher maternal age, non-Hispanic white ethnicity, a higher level of maternal
education, delivery in the Midwest, South, and Western parts of the Unites States, multiparity,
and a history of a previous infant with a birth weight greater than 4000 grams. Their results
indicate that factors outside traditional preterm delivery risk factors may be playing a role in the
process of a late-preterm delivery. Their conclusions support the concept of variation in practice
style as a source of varying rates of late-preterm birth. Data for this study were obtained from U.S. Birth Certificate file; the author’s recognize the limitations to using vital statistics data,
particularly inaccuracies in gestational age estimates and underreporting of medical and
obstetric complications that would lead to an overestimation of deliveries without a recorded
indication. Holland et al 31 reviewed delivery indications for 514 late-preterm births at a tertiary
care center; 36.2% were spontaneous preterm deliveries, 17.7% were secondary to PPROM,
37.9% were classified as medically indicated, and 8.2% were classified as elective. Medically
indicated deliveries were further subcategorized into 2 groups, those associated with a severe
or unstable medical condition and those associated with a stable, but high-risk condition. Births in the latter group were considered “potentially avoidable”. This group of “potentially avoidable”
late-preterm births had a higher rate of non-faculty private physicians, private insurance payer status, and schedules cesarean deliveries. The authors concluded “these data support that
physician practice patterns and patient preferences play a role in cases of iatrogenic LPTB [late-preterm birth]” (Holland, pg.1.e3) 31. They also recognized the limitations in how they defined
which late-preterm births could be considered “avoidable”; authors acknowledges “there was
as these authors’ opinions likely are representative of actual clinical practice at academic
tertiary care centers. It is the “potentially avoidable” deliveries and elective deliveries at
late-preterm gestations that are most subject to practice style variation and possibly responsible for
findings of geographic variation in late-preterm birth.
This study uses a large comprehensive population dataset that is generalizable to the
population of North Carolina. This decreases the risk of selection bias that might result from
using a population taken from particular health care settings (tertiary hospital, academic center,
etc). This study also is one of the first that attempts to uncover practice variation as an
underlying driver of late-preterm birth, which represents a less common approach to the study of
preterm birth prevention. The study provides a starting point for uncovering practice style
variation as a contributing cause to geographic variation in rates of late-preterm birth. Further
research is needed given the limitations of birth certificate data and the inability to draw detailed
conclusions regarding clinical decision-making. Since the use of larger geographic areas can “dilute” variation, additional studies should apply a smaller unit of geographic analysis (county,
hospital, etc) in order to better identify target areas for intervention and improvement efforts.
Smaller geographic areas for analysis, coupled with surveys of obstetric management
preferences, will enable us to elucidate more significant variation. The use of additional
methods, including provider surveys and medical record reviews will help us learn more about
the socioeconomic and clinical characteristics of areas, and better understand the clinical
decision making process surrounding late preterm birth. Uncovering variation, as this study has
Tables and Figures
Table 1.
Term and Late-Preterm Births by North Carolina Perinatal Region
Table 2.
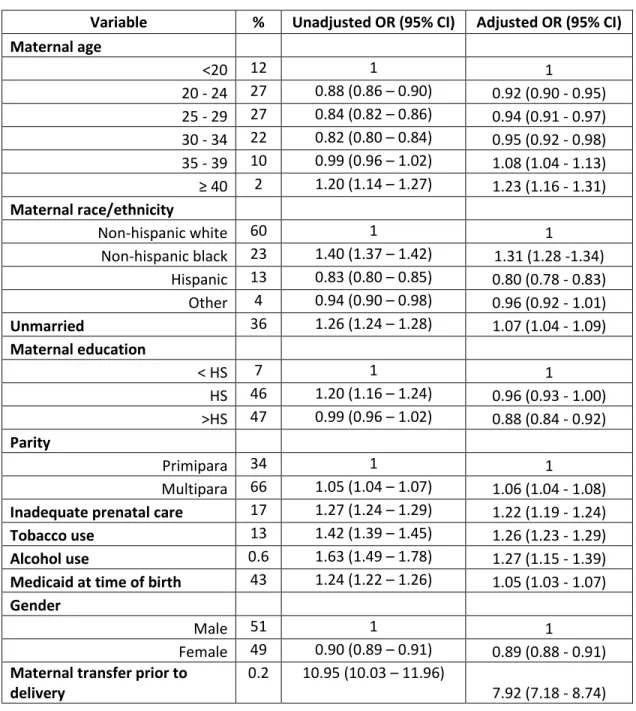
Sociodemographic Risk Factors
Variable % Unadjusted OR (95% CI) Adjusted OR (95% CI)
Maternal age
<20 12 1 1
20 - 24 27 0.88 (0.86 – 0.90) 0.92 (0.90 - 0.95) 25 - 29 27 0.84 (0.82 – 0.86) 0.94 (0.91 - 0.97) 30 - 34 22 0.82 (0.80 – 0.84) 0.95 (0.92 - 0.98) 35 - 39 10 0.99 (0.96 – 1.02) 1.08 (1.04 - 1.13) ≥ 40 2 1.20 (1.14 – 1.27) 1.23 (1.16 - 1.31)
Maternal race/ethnicity
Non-hispanic white 60 1 1
Non-hispanic black 23 1.40 (1.37 – 1.42) 1.31 (1.28 -1.34) Hispanic 13 0.83 (0.80 – 0.85) 0.80 (0.78 - 0.83) Other 4 0.94 (0.90 – 0.98) 0.96 (0.92 - 1.01) Unmarried 36 1.26 (1.24 – 1.28) 1.07 (1.04 - 1.09)
Maternal education
< HS 7 1 1
HS 46 1.20 (1.16 – 1.24) 0.96 (0.93 - 1.00) >HS 47 0.99 (0.96 – 1.02) 0.88 (0.84 - 0.92)
Parity
Primipara 34 1 1
Multipara 66 1.05 (1.04 – 1.07) 1.06 (1.04 - 1.08) Inadequate prenatal care 17 1.27 (1.24 – 1.29) 1.22 (1.19 - 1.24) Tobacco use 13 1.42 (1.39 – 1.45) 1.26 (1.23 - 1.29) Alcohol use 0.6 1.63 (1.49 – 1.78) 1.27 (1.15 - 1.39) Medicaid at time of birth 43 1.24 (1.22 – 1.26) 1.05 (1.03 - 1.07)
Gender
Male 51 1 1
Female 49 0.90 (0.89 – 0.91) 0.89 (0.88 - 0.91) Maternal transfer prior to
delivery
0.2 10.95 (10.03 – 11.96)
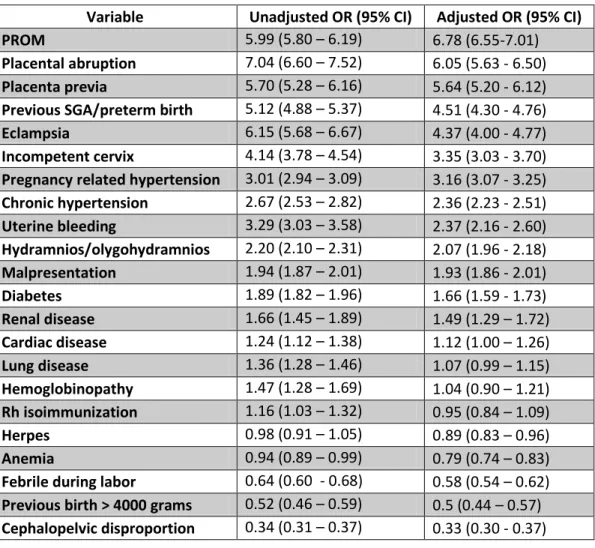
Table 3. Medical/Obstetric Risk Factors
Variable Unadjusted OR (95% CI) Adjusted OR (95% CI)
PROM 5.99 (5.80 – 6.19) 6.78 (6.55-7.01)
Tables 4a and 4b. Regional Distribution of Sociodemographic Risk Factors (%)
Region 1 2 3 4 5 6
Maternal age ≥ 40* 1.8 1.7 2 2.4 1.4 1.4
< HS education* 5.6 7.1 6.5 8 6.3 6.2
Non-Hispanic black* 5.2 17.2 22.5 23.6 27.1 34.4
Unmarried* 32.7 34.8 33.9 32.1 40.3 40.8
Multiparous* 62.8 67 65.8 65.8 66 64.9
Inadequate prenatal care* 11.9 13.2 17.5 20.3 18.9 17.5
Tobacco* 19.1 16 10.6 8 15.1 13.3
Alcohol* 0.4 0.5 0.6 0.55 0.64 0.53
Medicaid* 54.3 45.4 35.2 36.3 48.1 49.2
Male 51.3 50.9 51.1 51 50.9 51.1
Maternal transfer prior to delivery* 0.18 0.13 0.05 0.41 0.27 0.33 * p <0.05
Region 1 2 3 4 5 6
Term LPT Term LPT Term LPT Term LPT Term LPT Term LPT Maternal age ≥ 40 1.9 2.7 1.6 2.3 1.8 2.3 2.3 3 1.3 1.9 1.3 1.8 < HS education 6.6 6.1 7.2 6.8 5.6 5.7 8 7.6 6.4 5.5 6.2 5.4 Non-Hispanic black 3.6 3.2 3.1 2.9 3.4 2.7 4.5 3.8 8.6 7.6 2.1 2 Unmarried 33.5 39.2 34.5 38.1 32.2 38 31.5 39 39.9 45.2 40.4 45.3 Multipara 65.7 66.7 66.9 68.1 62.8 62.6 65.6 67.2 65.9 67 64.8 66.3 Inadequate prenatal care 17.3 20.6 13 15.4 11.2 20.1 20 24.3 18.7 21.4 17.3 21 Tobacco 10.2 14.8 15.6 20.2 18.5 25.7 7.7 12.2 14.8 18.5 13.1 15.3 Alcohol 0.58 0.96 0.49 0.63 0.34 0.54 0.51 1 0.61 1 0.51 0.78 Medicaid 34.8 40.7 45.2 48.1 53.9 59.2 35.8 43 47.6 53.2 48.9 53 Male 49 47.3 49.4 46.1 48.9 46.8 49.2 46.4 49.3 46.5 49.1 46.4 Maternal transfer prior
Tables 5a and 5b. Regional Distribution of Medical/Obstetric Risk Factors (%)
Region 1 2 3 4 5 6
PROM 2.2 1.3 2.6 3 2.3 1.4
Placental abruption 0.48 0.44 0.46 0.41 0.6 0.33 Placenta previa 0.34 0.39 0.3 0.34 0.41 0.29 Previous SGA/preterm birth 1 0.72 1.1 0.93 1 1
Eclampsia 0.31 0.24 0.1 0.21 0.6 0.54
Pregnancy related hypertension 7.4 5.7 5.2 3.6 5.1 4 Incompetent cervix 0.31 0.27 0.31 0.26 0.31 0.23 Chronic hypertension 0.95 0.76 1.1 0.95 1.4 1.1 Uterine bleeding 0.73 0.38 0.47 0.38 0.26 0.27 Hydramnios/olygohydramnios 2 1.3 1.8 1.6 1.7 1
Malpresentation 3.4 3.2 3.1 2.8 3.2 2.2
Diabetes 2.4 2 3.8 2.2 3.5 2.5
Region 1 2 3 4 5 6
Term LPT Term LPT Term LPT Term LPT Term LPT Term LPT
PROM 2 10.9 0.87 6.4 1.7 8.1 2.3 11.4 1.7 9.2 0.98 6.6
Placental abruption 0.31 2.4 0.31 2 0.32 2.5 0.28 2 0.43 2.6 0.22 1.6 Placenta previa 0.22 1.4 0.29 1.6 0.25 1.5 0.23 1.8 0.32 1.5 0.24 0.89 Previous SGA/preterm 0.85 4.4 0.52 3.1 0.82 3.6 0.74 3.4 0.77 4.2 0.81 3.2 Eclampsia 0.06 0.56 0.18 0.94 0.21 1.5 0.17 0.77 0.44 2.5 0.37 2.5 Pregnancy related
hypertension 4.7 12.9 5 14.4 6.7 15.9 3.2 9.1 4.5 11.5 3.5 10.3
Incompetent cervix 0.25 1.1 0.24 0.69 0.25 1.2 0.2 1.1 0.25 1 0.18 0.79 Chronic hypertension 1 2.7 0.69 1.6 0.85 2.2 0.83 2.5 1.2 3.3 0.97 2.3 Uterine bleeding 0.4 1.4 0.33 0.99 0.64 1.9 0.32 1.2 0.22 0.73 0.23 0.68 Hydramnios/
Oligohydramnios 1.7 3.3 1.1 2.6 1.7 5.3 1.5 3 1.6 3.2 0.9 2.3
Malpresentation 2.9 5.7 3 5.7 3.2 6 2.7 4.8 3 5.3 2.1 4.2
Table 6: Unadjusted and Adjusted OR of Late-Preterm Birth by Region
Region Unadjusted OR (95% CI) Adjusted OR (95% CI)
3 Reference Reference
Figure 2: Late-Preterm Births by Region, 1999 – 2006
7.82% 7.83% 7.9%
7.7% (I)
J:
...
-
7.5%·-.c
1-7.3%
0..
...J
...
s::
7.1%
G)
u
-G)
6.9%
0..
6.7%
6.5%
1 2 3
4
5 6State
Figure 3: Unadusted and Adjusted Probabilities of Late-Preterm Birth by Region
Appendix 1: Further Background on Late-Preterm Birth
Preterm premature rupture of membranes (PPROM), or the preterm spontaneous
rupture of fetal membranes prior to the onset of labor, is commonly associated with preterm
delivery, including late preterm. Obstetrical management of PPROM is controversial, and
depends on gestational age and associated fetal and maternal conditions16. Concern for
associated or consequent chorioamnionitis and cord prolapse are the main complications that
influence maternal and neonatal morbidity and mortality 54, and therefore the delivery decision.
In the setting of PPROM delivery is recommended after the pregnancy reaches 34 weeks 36.
Some of the controversy surrounding management of late-preterm PPROM emerges from prior evidence of increased risk of adverse outcomes with expectant management after 34 weeks’
gestation came from before the use of prophylactic antibiotics as standard of care 16. Maternal
hypertensive disorders are one of the most common co-morbidities during pregnancy, and one
of the top co-morbidities associated with a late-preterm delivery. Expectant management is the
recommended approach until term gestation is achieved 16, 36. It is unclear from current evidence
what proportion of late-preterm birth is due exclusively to a hypertensive complication of
pregnancy and the associated severity of these conditions.
Cesarean deliveries have increased significantly over the past few decades and data
from 2007 place the cesarean section rate in the United States at 31.8% 11. Elective cesarean
sections may represent a source of iatrogenic late-preterm delivery. Current ACOG
recommendations include that elective delivery, cesarean or induction of labor should not occur before 39 weeks’ gestation36. A history of prior cesarean delivery likely influences physician
decision making towards earlier term or late-preterm delivery16. No clear evidence guides the
optimal timing of elective repeat cesarean deliveries. Ideal management of placental disorders,
documentation of fetal lung maturity; this recommendation is less clear in cases of chronic
stable placental abruption. Two common fetal conditions associated with preterm delivery are
intrauterine growth restriction and oligohydramnios. Delivery is generally accepted with
evidence of abnormal fetal testing. The optimal timing of delivery when fetal testing is normal is
unclear; iatrogenic delivery for intrauterine growth restriction with reassuring fetal testing is not
indicated 16. In cases of oligohydramnios with reassuring fetal testing current recommendations
Appendix 2: Further Background on Variation in Perinatal Care
A study that examined the 1998 U.S. singleton birth cohort found that, after adjusting for
individual (maternal socio-demographic and medical risk factors) and regional (income,
elevation, physician supply) characteristics low birth weight births (LBW) varied more than
three-fold across regions41. Twenty-seven percent of regions had adjusted LBW rates below the
national average and 40% had adjusted rates higher than the national average. This
unexplained variation in rates of LBW births appears to be related to the location of maternal residence and the area’s perinatal/neonatal health care delivery system. It is not possible to
control for all social factors that may influence LBW, given that many are still unknown or
difficult to measure. The authors recognize this limitation; however in order for these factors to
explain regional variation they would need to be strong predictors of LBW and uncorrelated
significantly with other covariates in the study41. Other studies have shown geographic variation
in the incidence of LBW births whether on a national level or in smaller geographic areas55-57.
A study of variation in the intensity of fetal monitoring during prenatal care found that
greater intensity of testing was associated with higher rates of LBW, prematurity and cesarean
section delivery43. Glantz et al found highly variable labor induction rates among over 30,000
births in upstate New York44. A study of data from the National Center for Health Statistics found
significant county-level variation in cesarean section deliveries of normal weight and LBW
neonates despite controlling for patient-level and county socio-economic characteristics45.
Risk-adjusted cesarean section rates varied from 7% to 29% for normal birth weight deliveries and
25% to 50% for LBW deliveries. High cesarean rates were influenced by provider density,
capacity of the local health care system and medical malpractice concerns. The authors also
found that areas with higher rates of cesarean sections performed the procedure in births were
it was less medically appropriate. It was also noted that decreasing high rates of cesarean
hospital length of stay and other neonatal and maternal morbidities were not studied. The
remaining explanation of variation in cesarean section deliveries was attributed to the practice
style of the area. An analysis of cesarean and operative vaginal delivery rates in a large health
care delivery system that operates in 20 states also found significant variation46. This analysis
included almost 220,000 births across the country; the most significant variation was observed
within individual geographic regions, rather than between regions. The authors conclude that the presence of this magnitude of variation reflects “primarily vast differences in obstetricians’
Appendix 3: Limited Systematic Review of the
Late-Preterm Birth Geographic Variation Literature
We conducted a MEDLINE (PubMed) search to identify previously published results
from studies on geographic variation or small area analysis of late-preterm births. The most
recent search was conducted on January 5th 2010; all searches were limited to publications in
English. The Medical Subject Headings (MeSH) small area analysis and premature birth
produced one publication that reported results from a study examining the association between
birth weight and living in disadvantaged areas. Additional searches used combinations of the
following terms: small area variation, geographic variation, preterm birth, and late preterm birth. These searches produced a total of 31 results. All were excluded after removal of duplicate
results and review of the publication title revealed that none reported results from studies
examining geographic variation or small area analysis of preterm birth or late-preterm birth. The
phrase late preterm birth is not a MeSH term and no results were obtained when used as a search term along with the MeSH term small area analysis. The use of broader search terms (variation AND premature birth (MeSH)) produced 438 results; 425 were eliminated after review of the publication title. Of the remaining 13 publications, 8 were eliminated after review of the
abstract revealed that the study was not relevant. The remaining 5 publications included studies
about the geographic variation of perinatal mortality rates and low birth weight births, perinatal
health practices by hospital level not specific to late-preterm births, preterm birth according to
race/ethnicity, and variation in the post-natal management of late-preterm newborns.
We found no studies specifically addressing regional/geographic or small area variation
in late preterm births using these search strategies. Given than prior research on premature
births has incorporated birth weight as a proxy for gestational age additional searches were
terms low birth weight,small area variation and geographic variation. These searches produced a total of 59 results. After title review, 5 studies were found to report results of small area
analysis studies of rates of low birth weight (LBW) births. None reports results by gestational
age categories. Additional citations to relevant publications resulted from hand-searches of
references in key publications/sentinel articles.
The evidence table below summarizes the most relevant literature produced by this
search for studies of variation and low birth weight births, particularly studies using vital
statistics as a data source. The methodologies used in these studies support the application of
vital statistics data for the study of variation in perinatal care. The most recent studies on
geographic variation involving low birth weight births used small area analysis methodology to
establish newborn service areas (NSA) and neonatal intensive care regions (NICR)38, 41. These
geographic areas were generated using vital statistics data. NSA(s) are county aggregates and
determined by counties whose mothers gave birth primarily in hospitals within the area.
NICR(s) were generated from NSA(s) whose very low birth weight births (<1500 grams) were cared for in neonatal intensive care units in the area. The NICR served as the main “exposure”
variable when studying the variation in rates of low birth weight births. Earlier studies used vital
statistics data in combination with other determinants of a geographic area, such as census
tracts and counties55-57. Studies differed in how they controlled for area and population
characteristics. Some included area characteristics not recorded in birth certificate databases
including county level income data, area physician supply, and county-specific community risks
(for example, tobacco exposure); others only controlled for socio-economic factors.
Low birth weight births include a wide range of gestational ages, which makes the
interpretation of variation difficult. Factors that determine a very low birth weight birth (and its associated variation) may differ from those that determine a “larger” low birth weight birth,
be different depending on gestational age. For example, a very preterm birth may be influenced
more by the proximity to a tertiary care neonatal intensive care unit than a late-preterm birth.
The evidence summarized in Table A-3 shows the paucity of studies describing geographic
variation in rates of low birth weight/premature births and none have done so in categories of
gestational age. No additional studies have been published since 2005. Studies on variation in
Table A-3. Critical Appraisal Table of Results of Literature Search
Author,year Study Objectives Design/Subjects Interventions/Outcomes
Measured Results
(-) Limitations/(+) Strengths/Comments Thompson,
2005
Measure regional variation in LBW births in the US
Retrospective, 1998 US birth cohort, vital statistics
LBW births in Neonatal Intensive Care Regions (NICR)
Observed LBW rates 3.8 – 10.6 per 100 live births across regions; after adjusting for maternal and area risk factors 27% of regions had rates below and 40% of regions had rates higher than the national rate.
(-) Concerns about accuracy of vital statistics data
(+) Used NICR(s) based on traditional small area analysis methodology
LBW as outcome (not always a correlate of GA; therefore does not allow sub-categorization by degree of prematurity)
Goodman, 2001
Distribution of neonatal intensive care resources according to LBW births
Retrospective, 1995 US birth cohort, vital statistics; 1996 AMA and AOA datafiles; survey of AAP NICU directors
Variation in neonatal care capacity in relation to LBW births by NICR(s)
Neonatal intensive care capacity is not distributed according to rates of LBW births.
Same as above
Crosse, 1997
Geographic distribution of LBW births in London, Ontario
Retrospective; London, Ontario; 1984-1988 vital statistics records
LBW in census tract clusters; co-variate data from 1986 Canada census
Variation in LBW births was not entirely explained by SES
characteristics of the census tracts.
(-) Use census tracts to define geographic areas
Kieffer, 1993
Examine geographic variation in LBW births
Retrospective; 1987-1987 Hawaii vital statistics
LBW in census tracts Census tract LBW patterns not associated with SES factors, maternal education, age, parity, or prenatal care utilization. LBW patterns were primarily predicted by ethnic patterns of maternal
residence.
(-) Use census tracts to define geographic areas
Jason, 1986
Examine the environmental etiology of LBW births.
Retrospective; 1979 US vital statistics
County-level LBW births LBW births are not evenly
distributed across the US, but are clustered in geographical areas despite controlling for