Sharif University of Technology
Scientia IranicaTransactions D: Computer Science & Engineering and Electrical Engineering http://scientiairanica.sharif.edu
Enabling demand response potentials for resilient
microgrid design
M. Chegnizadeh and A. Safdarian
Department of Electrical Engineering, Sharif University of Technology, Tehran, Iran. Received 13 August 2019; accepted 7 October 2019
KEYWORDS Benders decomposition; Demand response; Island operation; Microgrid (MG); Resiliency;
Time-varying price.
Abstract.The future microgrids (MGs) hosting a multitude of uncertain and intermittent local renewable generation resources are anticipated needing fast and exible units on the generation side. However, demand response, as a load shaping tool, can alleviate this need. This paper proposes a model to consider demand response potential incorporated by time-varying prices in MG design studies. The model aims at maximizing prot of the MG owner while technical limits and constraints are adhered to. It also ensures that the designed MG is resilient to islanding events. To handle complexity of the model, Benders decomposition was used to decompose it into a master problem and two types of sub-problems. The master problem optimized binary variables indicating installing status of generating units and batteries. The rst type of sub-problems optimized continuous variables and the second ensured the resilient operation of the MG against islanding events. In the model, the uncertainties associated with load and intermittent generation resources were captured via a scenario-based stochastic approach. Demand behavior in response to time-varying prices was modeled via price elasticity coecients. Also, eectiveness of the proposed model was investigated through extensive numerical studies and sensitivity analyses.
© 2019 Sharif University of Technology. All rights reserved.
1. Introduction
Capacity decit in electric power systems may lead to the failure of almost every critical infrastructure such as food, energy, water, ICT, transport, health, emergency services, government, and nance, to name a few [1]. This is in line with the statement of the National Academy of Sciences of the United States mentioning that the modern world runs on electricity [2]. This pivotal role of electric power systems reects the necessity for approaches to protecting electric power systems against habitual and occasional events and threats, especially on the evidence of the recent increase
*. Corresponding author. Tel.: +98 21 66165931
E-mail addresses: [email protected] (M. Chegnizadeh); [email protected] (A. Safdarian) doi: 10.24200/sci.2019.54235.3657
in manmade and natural disasters [3,4]. However, these events occur more frequently as a consequence of climate changing and they are remote from daily experiences with surprising characteristics in areal ex-tent, severity, and time. Needless to mention, such new alien and out of ordinary challenges [2-6] may impose new risks to electric power systems [7]. The risks are imposed mainly because of the low probability and predictability of the events [7]. These characteristics scrap the traditional, cliched risk-based approaches intended for ensuring that electric power systems are safely operated. With this in mind, engineers were prompted to develop a new resiliency paradigm [7] based on the idea that, although stress could not be clearly anticipated, the associated risks would be reduced by preventive and adaptive goals [8]. This approach, in both technical and institutional respects, was expanded upon the spectrum of events and threats originating from natural disasters, accidents, and
de-liberate attacks. Nowadays, resiliency is present in the strategic goals of the United States and Canada joint security strategy [8], the strategic plan of the United States Department of Energy [9], and some other technical plans.
To enhance resiliency of the power system, the approaches to dealing with dierent types of threats are classied into two categories of operation-oriented [10] and hardening-oriented [11]. Some of the approaches only touch reinforcement of elements against a specic type of threat [12,13] while others revolve around solutions that can be implemented independent of the threat [14], one of which is using microgrids (MGs) [15]. MG was initially introduced to facilitate prolif-eration of local genprolif-eration, including renewable and conventional resources, oering diverse benets by meeting local controllable demands in an ecient, reliable, resilient, and environmentally friendly man-ner [16,17]. The conspicuous feature of an MG, called islanding, is its ability to cope with the risky situations where support from the upstream power system is unavailable [18-20].
In order to design an MG, dierent objectives such as cost minimization, reliability improvement, and environmental concern alleviation can be pursued. Bahramirad et al. [21] proposed a model for sizing the storage while trying to maintain the trade-o between
reliability and cost. A model for MG expansion
to optimally size the storages with respect to some practical factors was proposed by Alsaidan et al. [22]. It is worthwhile to note that reliability is a very important issue for MGs hosting high penetrations of intermit-tent and uncertain renewable energy resources [23]. Madathil et al. [24] addressed the N-1 reliability of capacity planning and operations for remote small MGs. Billinton [25] presented a discussion of the impact of renewable energy resources on reliability of the islanded electric power systems. In [26], a model has been proposed to identify the optimum structure of MGs by siting switches in an electric power distribution network. Shahidehpour and Khodaei [27] presented a model to design an MG by considering the impact of uncertainties associated with renewable energy re-sources, load, market prices, and islanding. To consider these uncertainties, they optimized the worst-case sit-uation via Benders decomposition technique. In [28], a bi-level robust optimization model is developed in order to optimize participation of MGs in the markets as well as operation of energy resources. To consider uncertainties, a genetic algorithm has been used in this study. In [29] and [30], the focus is on planning MGs with environmental objectives considering incentives and penalties for greenhouse gas emissions.
In [31], a model is presented to design transmis-sion network and MGs, simultaneously, in order to minimize the costs. The study also minimizes load
curtailment in the case of faults. Cheng and Wang [32] tried to maximize prot of the MG owner as the purpose of their design problem. In order to ensure reliability of the designed MG, they considered a lower bound of the percentage of load supplied via local power generation.
In [33], resilient operation of MGs is studied and an MG is called resilient if its hosting load is served during unexpected islanding events. In order to ensure resiliency of an MG, backup generation units are proposed to be installed to compensate for the intermittent nature of renewable energy resources. Needless to mention, MG owners are not in favour of the installation of the backup units, which signicantly increases the costs. To resolve this issue, Khodaei [34] investigated a provisional MG concept by which a few MGs could be operated in connected mode to support each other during islanding events.
Controllable loads play an indispensable role in addressing the coordination between supply and de-mand in MG, where decision making is intertwined with uncertainties associated with forecasting. In this regard, Atia and Yamada [35] incorporated several con-trollable loads of the residential MG into sizing of the renewable and energy storage problem. Wu et al. [36] focused on a two-stage robust MG coordination strat-egy. They scheduled a day-ahead price-based Demand Response (DR) program assuming that micro-turbine outputs were modied on an hourly basis. In [37], a mathematical operational DR model for isolated MG has been oered in which any household owns an intelligent Energy Hub Management System (EHMS) to minimize its costs, while the objective function of the MG operator is overall cost. Ahmad Bashir et al. [38] proposed a novel energy management framework to minimize the total MG cost. For preserving comfort priorities of individual households by a smart central management system, they combined proactive and reactive approaches in order to eciently address the uncertainties associated with generation and demand in the interconnected operation and random outages of MG components.
The review of studies above emphasizes that MG is a structure with great benets for all stakeholders in many ways. However, under the islanding mode, host-ing a great number of intermittent resources may result in challenging balancing issues [34], which necessitates expensive back-up generators.
In the literature, there is no signicant research focusing on methods to avoid the expensive solution of backup generation units. To ll this gap, this paper proposes using demand response potentials to relieve the need for such expensive facilities, especially during island operation mode. This also enhances MG resiliency since critical loads hosted by the MG can be served while the upstream grid is unavailable due
to manmade or natural disasters. For this purpose, a mathematical model is developed in this paper in which demand response is integrated into MG design process. To avoid computational complexities, the model is decomposed into a master problem and two types of sub-problems via Benders decomposition ap-proach. The master problem makes decisions on binary variables, while the rst type of sub-problems optimizes continuous variables and the second type investigates whether MG resilience is maintained within island operation mode. The performance of the model is veried through extensive numerical studies and several sensitivity analyses.
The rest of this paper is organized as follows. Section 2 presents the concept of the model and key assumptions made. Section 3 provides mathematical formulation of the model. Section 4 presents numerical studies and discussions. Finally, relevant conclusions are drawn in Section 5.
2. Methodology outline 2.1. Overview
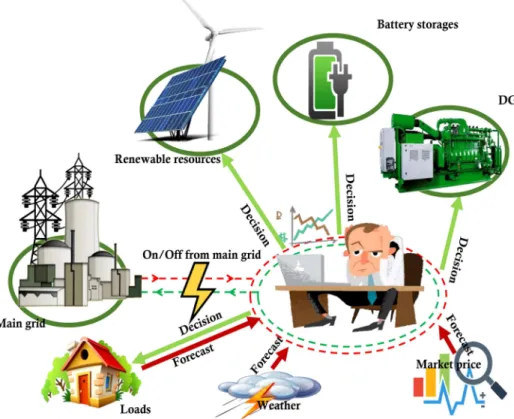
The model for incorporating demand response po-tentials enabled via dynamic prices in MG planning studies is demonstrated in Figure 1. It aims at maximizing prot of the MG owner while the operating point is able to ensure that the MG is resilient to the islanding event. The problem contains binary decision variables associated with installation. Moreover, the
response of consumers to dynamic prices makes the problem nonlinear. Therefore, the problem in hand is a mixed-integer non-linear one clearly hard to solve. To cover non-linearity of the problem and ensure aordability of the solution to its computational com-plexity, Benders decomposition method is employed to decompose the problem into a master problem and two types of sub-problems. In the master problem, the investment binary decision variables are determined. The number of sub-problems in the rst set is equal to the total number of time intervals. The investment plan decided in the master problem is employed for the time interval problems, called operation sub-problems hereinafter, to nd the optimal schedule for the operational variables during the time interval. The problems of the second type, called resiliency sub-problems hereinafter, check the safe operation of the MG during islanding event. The decision variables are mentioned below:
Investment variable decisions include the invest-ment states of dispatchable and non-dispatchable distributed generation as well as energy storage units. These decisions are modelled via binary variables, which are optimized by minimizing the total investment cost. Note that the binary variables are set to one for installation, zero otherwise. In addition, it is worthwhile to mention that genera-tion and storage units are chosen from the set of introduced candidates;
Operation variable decisions comprise the active power output of dispatchable units, the amount of charge/discharge power of storage units, the amount of load, and power transaction between the MG and the upstream grid. It is clear that these decisions are made in line with the maximization of the prot of the MG owner.
In the model, the uncertainty associated with load and intermittent generation resources is considered via a scenario-based stochastic approach. The demand behaviour in response to price changes is captured via price elasticity coecients.
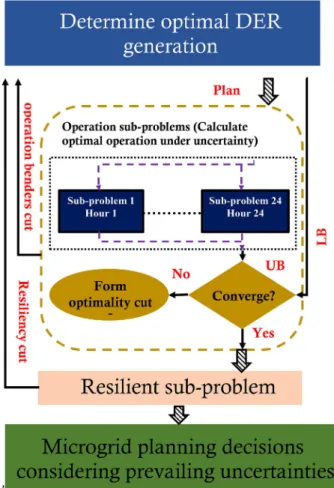
Figure 2 depicts the owchart of the proposed MG planning model. As can be seen, the problem is solved via an iterative approach by which the master problem and sub-problems are solved sequentially. The solution to the master problem is fed to the sub-problems and the results achieved by solving the sub-problems are used to revise the master problem. The solution convergence is examined based on the closeness of a calculated investment cost in the master problem and the prot that is calculated in the operation sub-problems. The iterative process continues until the convergence criterion is met. Finally, the investment and operation variables are assessed in the resiliency
Figure 2. Flowchart of the proposed MG planning model.
sub-problem to ensure generation adequacy for the islanding event. If the generation is not adequate, the master problem is revised so as to ensure the necessary condition for the islanding event.
2.2. Assumptions
The principal assumptions of the proposed model are mentioned as follows.
The MG operator is the owner of all installed assets and facilities. Synonymously, the MG owner and operator are the same in this study;
Ramp limitations and costs are not considered for dispatchable units in this study. This makes sense because of the small size and rapid responding capability of such units;
Dynamic prices are employed to coordinate supplies and demands. The demand behaviour in response to price changes is captured via price self- and cross-elasticity coecients, which are considered to be constant parameters in the planning horizon;
Since the MG operator and the owner are the same, the generation side of the MG is not an open market. Hence, it introduces regulatory constraints on hourly prices and yearly income to preserve fairness;
Costs of system maintenance and smart meter in-stallations are ignored. In other words, it is as-sumed that the metering infrastructures are already installed in the system;
No salvage value is considered since useful life of facilities is supposed to be similar to the planning horizon;
As local generation is close to consumption, network congestion is ignored and the system is supposed to be a balanced three-phase system. These simplica-tions are to underline the major contribution of this paper;
The Point of Common Coupling (PCC), which
connects the MG to the main grid, is assumed to have enough capacity to supply the MG load during the entire planning horizon;
In order to ensure the possibility of the contribution of energy storages in the islanded mode, it is assumed that MG operator keeps the energy stored in batteries at the scheduled plan. This assumption is for avoiding the eect of uncertainties associated with renewable resources on the energy stored in batteries.
3. Mathematical formulation
In this section, mathematical formulation of the pro-posed original model is rst presented. Then, the
solving procedure is elaborated on, through which the original problem is decomposed into the master problem and operation and resiliency sub-problems. 3.1. Original model
As mentioned earlier, the objective of the model is to maximize total prot of the MG owner through the planning horizon as follows:
MAX R cos t: (1)
In Relation (1), the prot is represented as the revenue item minus costs. Revenue is the outcome of selling energy to consumers while the cost function consists of annual capital costs, operation costs, and costs of the unserved energy. The maximum prot is evaluated in terms of discounted values by the incorporation of the present-worth costs or revenue components. Revenue and cost are formulated as follows:
cos t =X
y
X
i2(G;W )
kyCCiyPimaxxi
+X
y
X
i2S
ky(CPiyPimax+ CEiyCimax)xi
+X y X d X h X s2S X i2G
ky!s(cipiydhs)
+X y X d X h X s2S
ky!s(ydhspM;ydhs)
+X s2S X y X d X h
kyvydhLSydhs; (2)
R = [P ]t
124 []241; (3)
Ph= Phflat[1 +
X
h02H
Et h;h0h
0 flat
flat ]; (4)
Ph=Phflat[1 + eh;11 flat
flat + eh;2
2 flat
flat
+ ::: + eh;hh flat
flat + :::
+ eh;2424 flat
flat ]; (5)
Rh=h Phflat [1 + eh;11 flat
flat
+ eh;22
flat
flat + ::: + eh;h
h flat
flat + :::
+ eh;2424 flat
flat ]; (6)
Rh
Phflat =h+ ( eh;1
flat h 1+
eh;2
flat h 2
+ ::: +eflath;h 2
h+ ::: +eh;24flat h 24)
(eh;1+ eh;2+ ::: + eh;h+ ::: + eh;24) h;
(7) RT =
X
h2H
Rh
Phflat; (8)
RT =
8 > > < > > : X h2H X
h02H
8h06=h
Phflateh;hflat0 h h0
9 > > = > > ; + ( X h2H
(h Phflat
(
1 X
h02H
eh;h0
) ) ) + ( X h2H
Phflat eh;h flat 2h
)
; (9)
ei;j= ej;i; (10)
ai = Piflateflati;i ; i 2 H; (11)
ai;j= (P flat
i + Pjflat) ei;j
flat ;
i 2 H; j 2 H; i 6= j; (12)
i= Piflat(1
X
h02H
ei;h0); i 2 H: (13)
The operation cost presented in Eq. (2) is composed of cost of the selected non-renewable generation and the costs of power imports from the main grid. The revenue is calculated through multiplying selling price by the demand of costumers during time (Eq. (3)). Because the demand and price are interdependent, em-ploying demand response program makes these items intertwined. As a result, changing price leads to demand shift from/to the relevant hour. This makes the model nonlinear. In this regard, the demand and price formulations are extended, and nonlinear items in the revenue formula are detected and linearized. The extended form of the demand is given in Eqs. (4) and (5). The demand at time interval h is computed by the elasticity matrix. The elasticity matrix includes self and cross elasticity coecients that represent capabil-ity of the demand to shift from/to other time intervals based on price changes. This matrix is applied to the initial demand in Eq. (4) and in detail in Eq. (5). Substituting Eq. (5) in Eq. (3), the revenue can be achieved by Eqs. (6) and (7). In addition, total revenue,
represented in Eq. (8) and summarized in a compact form in Eq. (9), can be formulated as follows by using the auxiliary parameters dened in Eqs. (10)-(13):
RT =
8 > > < > > : X h2H X
h02H
8h06=h
ah;h0 h h0
9 > > = > > ; + ( X h2H
(h h)
) +
( X
h2H
ah 2h
) : (14) Needless to mention, coping with the nonlinearity of the rst and third items of Eq. (14) plays a crucial role in the computational feasibility. As a result, the technique proposed in [39] is applied to the rst term in Eq. (14) as follows:
ai;j i j=a2i;j (i+j)2 2i 2j : (15)
The linearization is followed by dening h as follows
and sorting revenue expression in Eq. (17):
m= am
X
h02H
am;h0
2 ; (16)
RT =
8 > > < > > : X h2H X
h02H
8h06=h
ah;h0
2 (h+ h0)2 9 > > = > > ; + ( X h2H
(h h)
) +
( X
h2H
h 2h
)
: (17) The square items in the rst and last terms of Eq. (17) are still non-linear. Therefore, piecewise linear approximation of these terms, as in [39], is used as follows:
h2h= h;1h;1+ h;2h;2+ h;3h;3+ h;4h;4;
h 2 H; (18)
h= h;1+ h;2+ h;3+ h;4; (19)
h;l= 2 hh; (20)
ah;h0
2 (h+ h0)2= '1;h;h01;h;h0 + '2;h;h02;h;h0 + '3;h;h03;h;h0+ '4;h;h04;h;h0; (21)
h+ h0 = 1;h;h0+ 2;h;h0+ 3;h;h0+ 4;h;h0; (22)
ah;h0 (h+ h0) = 'y;h;h0; y = 1; 2; 3; 4; (23)
where the non-linear problem is divided into 4 linear sections with slopes 'h;l and 'y;h;h0. Such linearized
problem should be solved along with several opera-tional and investment limitations. In order to ensure that such restrictions be materialized, constraints (24)-(39) are applied to the linearized problem as follows:
0 pih pmaxi _xi; 8h; 8i 2 G: (24)
Constraint (24) is to consider the minimum and maximum generation capacity limits of installed dis-patchable units. In addition, the following constraints are considered to formulate the limits on a battery storage:
0 pch
i;h pchmaxUi;t; 8h; 8i 2 E; (25)
0 pdch
i;h pdchmaxViydh; 8h; 8d; 8y; 8i 2 E; (26)
Uiydh+ Viydh 1; 8y; 8d; 8h; 8i 2 E; (27)
0 Cih Cimax_xi; 8h; 8i 2 E; (28)
Ci;t = Ci;h 1+ pchi;h (1=)pdchi;h; 8h; 8i 2 E; (29)
0 Viydh_xi; 8h; 8d; 8y; 8i 2 E; (30)
0 Uiydh_xi; 8h; 8d; 8y; 8i 2 E: (31)
The operational limits of storage units are de-scribed in Constraints (25)-(31). Constraints (25) and (26) are to incorporate charge/discharge limits of storage unit while Constraint (27) ensures that the units are not charged and discharged simultaneously. The state of charge of the storage units is calculated in Constraint (28). Constraint (29) is to ensure that the energy saved in the units is within the upper and lower limits. Constraints (30) and (31) guarantee that only the storage units chosen to be installed make contribution to the system operation. Besides the aforementioned constraints, the problem is faced with some technical restrictions given below:
pmax
M pMh pmaxM ; 8h; (32)
X
i2(G;W )
Piydhs+
X
i2S
(Pdch
iydhs Piydhsch ) + PM;ydhs
+ LSydhs= Dydhs;
8h; 8d; 8y; 8k; 8s 2 S: (33)
Constraint (32) ensures that the power exchanged with the main grid is limited by the associated limit at PCC. Equation (33) enforces maintaining a balance be-tween generation and consumption in each time period.
Similarly, revenue and prot must be restricted by under-regulation constraints so as to preserve fairness as follows:
ykt!= serviceykt! + energyykt! ; (34)
service
ykt! servicek ; (35)
X y X k X t service
ykt! Piykt!D average
X y X k X t PD
iykt!: (36)
Constrains (34)-(36) give regulatory constraints on selling prices and yearly income of the MG owner. For this purpose, price in any time interval is divided into service and energy parts. The energy price is equal to the market price in the same time interval, while the MG owner determines the service price. Constraint (35) puts a cap over the service price.
Now, the proposed solving procedure is intro-duced in the next sub-section, where the original linearized model is decomposed into a master problem and operation and resilient sub-problems by Benders decomposition technique.
3.2. Solving procedure 3.2.1. Master problem
The objective function of the master problem is com-posed of the rst two items in Eq. (2). This problem is solved on a yearly basis aiming at minimizing the investment costs (Constraint (37)). Thereby, decision variables related to the installation state of distributed generation and storage units are given values in this problem. The results are then sent to the operation sub-problems. In Constraint (37), variable is a projected operation cost in the investment problem. This sub-problem calculates the upper-bound of the Benders decomposition problem:
MinX
y
X
i2(G;W )
KyCCiyPimaxxi
+X
y
X
i2S
Ky(CPiyPimax+ CEiyCimax)xi
+X
y
kyy: (37)
3.2.2. Operation sub-problems
In computing the lower bound, the operation sub-problems are in charge of scheduling selling prices, charge/discharge power of storage units, output power of dispatchable generation units, and power imports from the main grid with the aim of maximizing prot of the MG owner. Accordingly, the objective function of the operation sub-problem comprises the third and fourth items in Eq. (2) with respect to the
master-level decisions and in compliance with the following constraints:
Generation capacity constraints (Constraint (24));
Power and energy limitations of storage units (Con-straints (25)-(31));
System power balance and PCC limitation (Con-straints (32)-(33));
Regulatory constraints (Constraints (34)-(36)). Having compared lower and upper bounds, if the convergence criterion is not met, the feasible operation cut is formed as follows:
y
_
Qy+X
d
X
h
X
i2G
iydhPimax(xi;t _xi;t)
+X d X h X i2W
&iydhPimax(xi;t _xi;t)
+X d X h X i2S
#iydhPimax(xi;t x_i;t)
+X d X h X i2G
iydhCimax(xi;t _xi;t); (38)
where Q_y is a calculated objective value of the opera-tion sub-problems in a year and iydh, iydh, #iydh, and
iydh are dual variables associated with dispatchable
generation units, non-dispatchable generation units, rated power of storage units, and rated capacity of storage units. Added to the master problem in the next iteration, the cut revises the combination of installing units.
3.2.3. Resiliency sub-problem
Calculated in the master problem and operation sub-problems, the optimal investment plan and scheduled operation are assessed in the resiliency sub-problem to ensure energy adequacy for the islanding event. By doing so, the MG is capable of supporting critical loads for tislandhours as the expected continuous time during
which the MG is not supported by the main grid. The resiliency sub-problem formulation is as follows:
Min w =X
t
SL1;ydh+ SL2;ydh; (39)
tstartX+tisland
h=tstart
X
i2G
Piydhs+
X
i2S
(Pdch
iydtstarts P
ch iydtstarts)
tisland+ SL1;ydtstart SL2;ydtstart
tstartX+tisland
h=tstart
Dcritical ydh
_
x = xi 8i 2 ES; G; (41)
where SLs are positive slack variables, Dcritical refers
to the critical load of the planned MG, and tstart is
the time when islanding happens. Eq. (39) minimizes the mismatches that occur in Relation (40). Here, Relation (40) is to ensure that the net energy provided by dispatchable units and charge/discharge of battery storage units is sucient to support critical load hosted by the MG during the islanding period. The sub-problem must also meet the following constraints according to the master-level decisions (Eq. (41)):
Power and energy limitations of storage units (Con-straints (25)-(31));
System power balance (Constraint (32)).
Having the sub-problem solved, the nal solution is obtained if the mismatch is zero. Otherwise, the solution must be revised. The revision is performed via changing the investment plan by forming resiliency cut (Relation (42)) and sending it back to the master problem.
_
w +X
t
X
i2G
i;t(xi;t _xi;t)
+X
t
X
i2S
ch
i;t(xi;t _xi;t)
+X
t
X
i2S
dch
i;t (xi;t _xi;t) < 0; (42)
where and i;t are dual variables associated with
binary variables of dispatchable generation units and rated power of storage units, respectively.
4. Numerical results
In this section, the proposed methodology is applied to a test system. In order to demonstrate the framework of the simulated MG, the corresponding diagram of the proposed model is depicted in Figure 1. An MG is to be installed for a group of electricity consumers with a peak annual load of 8.5 MW. The set of candidates includes 11 DERs (consisting of 6 dispatchable units, 2 non-dispatchable units, and 3 energy storage systems). The characteristic data of energy storage units are provided in Table 1. Table 2 presents deterministic parameters of the dispatchable units. Similarly, the technical data associated with non-dispatchable units are given in Table 3, illustrating qualities of wind and solar generators.
Energy storage eciency is considered to be 90% for all candidates. The load, variable renewable generation, and market prices are forecasted based on the historical data obtained from IIT Campus Microgrid [34]. The planning horizon is 20 years.
The exible and critical loads are considered 40 and 60%, respectively. In order to avoid computational complexities, any year, which is 8760 hours, is divided up into 8 periods. The reason behind choosing 8 periods is that all workdays in a week during one
Table 1. Characteristics of the energy storage units. Unit no. Rated power
(MW)
Rated energy (MWh)
Annualized investment cost-power ($/MW)
Annualized investment cost-energy ($/MWh)
1 1 6 60000 30000
2 2 6 30000 30000
3 3 6 20000 30000
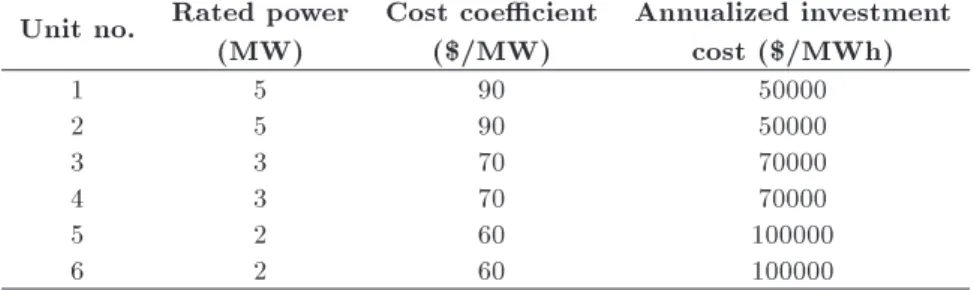
Table 2. Characteristics of dispatchable units. Unit no. Rated power
(MW)
Cost coecient ($/MW)
Annualized investment cost ($/MWh)
1 5 90 50000
2 5 90 50000
3 3 70 70000
4 3 70 70000
5 2 60 100000
6 2 60 100000
Table 3. Characteristics of non-dispatchable units. Unit no. Rated power
(MW)
Cost coecient ($/MW)
Annualized investment cost ($/MWh)
1 2 0 120000
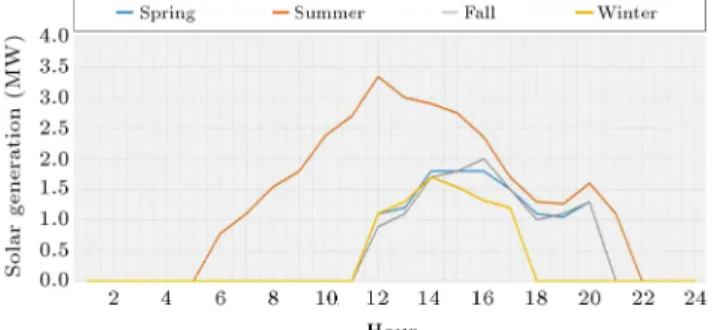
season experience approximately similar market prices, loads, and renewable generation. Similarly, weekends have such a feature. In this way, the market price, load, and wind and solar generation in one typical day are employed for all days in the related period. Therefore, the problem for every year is solved for 8 days rather than 365 days. Based on the forecasts, the likely wind and solar generation scenarios for spring are illustrated in Figures 3 and 4, respectively. In addition, Figures 5 and 6 demonstrate one scenario of market prices and solar generation in all seasons of the rst year, respectively.
As noted earlier, the developed model encourages consumers to reduce their load when the market prices are high or interior renewable generation drains away. As demonstrated in Eq. (4), calculated sale prices in comparison with the relevant at prices determine how much load should contribute to the demand response program. For this reason, at prices are dened by
Figure 3. Output of wind turbine generators{spring, rst year.
Figure 4. Output power of solar panels{spring, rst year.
Figure 5. Hourly prices for one scenario{rst year.
Figure 6. Output power of solar panels{all seasons.
which consumers pay a xed price for the amount of electricity they consume. To quantify such prices, 2 at prices are calculated for the peak and o-peak durations of the year (i.e., summer and winter as peak durations, and spring and fall o-peak). Specically, lower sale prices than at prices enforce demand to shift to the relevant hours, while higher price shifts demand to other hours. Having calculated the amount of the load shifted at dierent load points and elasticities, the at prices are calculated using the following formula:
flat=
P
s
P
y
P
d
P
h !s spot sydhPsydhfllat
P
s
P
y
P
d
P
h !sP fllat sydh
; (43)
where Psydhfllat and spotsydh are base load (without imple-menting time-varying demand response program) and electricity market price, respectively.
To investigate validity of the method, two cases are considered in the simulations. In the rst case, called base case hereinafter, demand response is not enabled. According to the simulations results for the rst case, it is economically benecial to install all candidate DERs, since the installing costs are divided up between several years of the planning horizon and the lack of demand response potentials forces installing dispatchable units to preserve resiliency.
To enable demand response in the second case, the self-elasticity and cross-elasticity coecients are set to 0:2 and 0.0087, respectively. This case is simulated. According to the results, dispatchable units 5 and 6 are not installed if demand response potentials are activated. It can also be seen in Table 4 that the operation cost and purchasing cost in the base case are more than the corresponding costs of the case in which demand response is enabled. Needless to say, demand response being disable in the base case, the problem forces the MG owner to install more units and hence, the operation and investment costs increase. In addition, cost of purchasing power from the main grid increases, because it is impossible to move the loads to lower-price hours. Furthermore, prot decreases since the operation, investment, and cost of purchasing power from the main grid increase.
Table 4. Comparison between cases studied.
Scenario Prot Operation cost Cost of purchasing power from the main grid
Base case 20275181 1628394 548871
The case with time-varying
demand response 24654672 792507 {407434
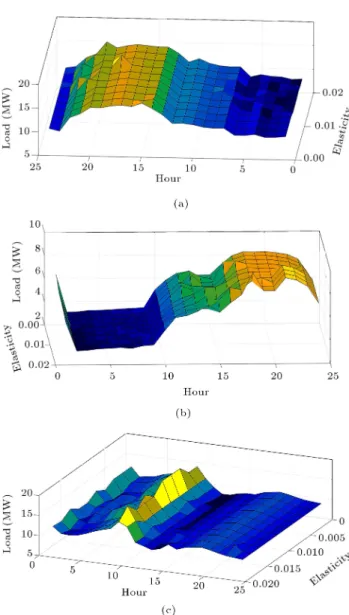
Figure 7. Simulation results for diverse cross-elasticities: (a) rst year, summer, workdays (b) rst year, fall, weekend and (c) rst year, winter, workdays.
Since the elasticity coecients are intertwined with hard-to-predict social and economic aspects of human life with time, the simulation is repeated for a wide spectrum of self and cross elasticity coecients. The obtained load proles associated with diverse elasticity coecients are shown in Figure 7(a)-(c). The gures are respectively associated with the simulation results of summer workdays, fall weekends, and winter workdays in the rst year of the studied horizon. It
Figure 8. Cost of purchasing power from the main grid for diverse cross-elasticities.
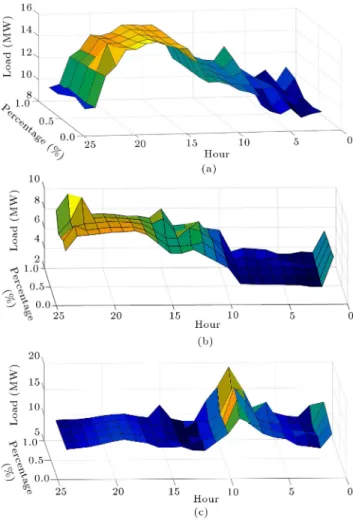
can also be seen in Figure 8 that energy procurement cost from the main grid decreases (negative cost means attaining revenue) by increasing the value of elasticity coecients. As the maximum revenue that can be earned by the MG owner is xed by the regulatory constraints, increase in the attained prot translates into decrease in overall costs. This observation reveals the importance of the approach. In Figure 7(a), the MG owner is confronted with higher peak demands within the period from 6 pm to 10 pm. In case of higher elasticity coecients (i.e., jcross-elasticityj > 0:01), which means that more exible load is available, this observation is proven. The main reason is that market prices decrease in these hours, while a great number of renewable resources (either solar or wind) are available in the MG. As a result, the proposed problem designs the sale prices in a way to shift demand to these hours. The same results can be seen for hours 21-23 in Figure 7(b) as well as for hours 8-10 in Figure 7(c). Besides the uncertainty associated with elasticity coecients, the share of responsive load, which is aected by time-varying prices, is uncertain. The simulation results associated with dierent shares for responsive load are demonstrated in Figure 9(a)-(c). According to the results, demand response, as a load shaping tool, presents an alternative for the installed generation capacity. As can be seen, the capacity of necessary dispatchable units decreases as the share of responsive load grows. Furthermore, Figure 10 presents the cost of purchasing power from the main grid. It is observable that the cost decreases dramatically as the share of responsive load increases.
self-Figure 9. Simulation results for diverse percentages of exible load: (a) First year, summer, workdays (b) rst year, fall, weekend and (c) rst year, winter, workdays.
Figure 10. Cost of purchasing power from the main grid for diverse percentages of exible loads.
Figure 11. Simulation results for diverse cross-elasticities.
elasticities. With reference to this gure, dramatic uctuations can be seen for hours around 15. The reason can be traced back to Eq. (4), according to which when the sale price is near flat, minor changes
in price lead to change in the second part. As a result, considerable increase or decrease in load can be observed, especially when the problem is faced with higher elasticity coecients. Captured via price elasticity coecients, demand behavior model is the weakness of the proposed mathematical framework based on such statistics. The elasticity matrix cannot appropriately simulate and model human behavior in response to price variations. Given that, unrealistic results are observed in Figure 11, emphasizing the need for further researches and developments over more practical methods.
5. Conclusion
To cope with the need for fast and exible, but expensive, units in resilient renewable energy-based MGs, this paper augmented price-based demand re-sponse potentials in MG design problem in order to maximize prot of the MG owner. To ensure fairness of retail prices, regulatory constraints were considered in the model. Mainly to alleviate complexity of the proposed model, Benders decomposition technique was applied to decomposing the model into a master problem and operation and resiliency sub-problems. The master problem determined binary variables to optimally design an MG; the operation sub-problems optimized operation of the designed MG; and the re-siliency sub-problem ensured safe operation of the MG during islanding event. Simulations for a sample MG illustrated eciency and eectiveness of the proposed model and solution algorithm. Moreover, the results demonstrated a remarkable improvement in the prot of the MG owner as demand response potentials were enabled via the proposed approach.
Nomenclature Indices and symbols
ch Superscript for energy storage charging
mode
dch Superscript for energy storage
discharging mode
flat Superscript for the situation without
time-varying demand response program
I Index of DERs
h; d; y Indices of hour, period, and year Sets
G Set of dispatchable units
S Set of scenarios
W Set of non-dispatchable units
Parameters
E Elasticity coecient matrix
e Elasticity coecient
C Rated capacity of energy storage
systems
c Generation price for dispatchable units
CC Annualized investment cost of
generating units
CP Annualized investment cost of
storage-power
CE Annualized investment cost of
storage-energy
K Discount rate
R Revenue attained by the MG owner
Energy storage eciency
ws Probability of scenario
Market price
Variables
D Demand after enabling demand
response program
P Power output of DERs
PM Power exchange between MG and the
main grid
Ui;t State of charge (0/1)
Vi;t State of discharge (0/1)
X State of installing DERs (0/1)
Designed time-varying price
a; a; v;
'; ; Auxiliary variables
References
1. \Critical infrastructure sectors", [Online]. Available: https://www.dhs.gov/cisa/critical-infrastructure-sectors.
2. National Academy of Sciences, Enhancing the Re-silience of the Nation's Electricity System, Washing-ton, DC, USA (2017).
3. Guttromson, R. and Watson, J. \Dening, measuring, and improving resilience of electric power systems", In Smart Grid Handbook, pp. 1-21, John Wiley & Sons, Ltd., Hoboken, New Jersey, USA (2016).
4. Field, C.B., Barros, V., Stocker, T.F., et al., IPCC (2012): Managing the Risks of Extreme Events and Disasters to Advance Climate Change Adaptation, Cambridge University Press, Cambridge, UK (2012).
5. Government Oce of Science, Foresight Project of Reducing Risks of Future Disasters: Priorities for De-cision Makers, Infrastructure and Resilience, London, UK (2012).
6. Khodai, A. \Guest editorial power grid resilience", IEEE Trans. Smart Grid, 7(6), pp. 2805-2806 (2016). 7. National Intelligence Council (NIC), Global Trends, Paradox of Progress, Washington, DC, USA (2017). 8. Governments of the United States and Canada, Joint
United States-Canada Electric Grid Security and Re-silience Strategy (2016).
9. Department of Energy, 2016-2020 Strategic Plan and Implementing Framework, Washington, DC, USA (2012).
10. Department of Energy, Los Alamos National Lab, Resilient Grid Operational Strategies, New Mexico, USA (2016).
11. Philips, J., Finster, M., and Pillon, J. \State energy resilience framework", REPORT ANL/GSS-16/4, Ar-gonne National Lab., Chicago, Illinois, USA (Dec. 2016).
12. Potvin, J. and Short, T. \Distribution grid resiliency: overhead structures", REPORT 3002006780, EPRI, California, USA (2015).
13. Tripolitis, J., Martino S., and Rajagopalan, S. \Dis-tribution grid resiliency: undergrounding", REPORT 3002006782, EPRI, California, USA (2015).
14. Department of Energy, Oce of Energy Policy and Systems Analysis (EPSA), Resilience of the U.S. Elec-tricity System: A Multi-Hazard Perspective, Washing-ton, DC, USA (2016).
15. Anderson, J. and Deaver, B. \Distribution grid resiliency: modern grid technology", REPORT 3002006783, EPRI, California, USA (2015).
16. Clair, J. and Shahidehpour, M. \A functional micro-grid for enhancing reliability, sustainability, and energy eciency", Electric J., 25(8), pp. 21-28 (2012). 17. Lasseter, R.H. \Smart distribution: Coupled
micro-grids", Pro. of the IEEE, 99(6), pp. 1074-1082 (2011). 18. Shahidehpour, M. \Role of smart microgrid in a perfect power system", 2010 IEEE Power and Energy Society General Meeting (2010).
19. Strbac, G., Hatziargyriou, N., Lopes, J.P., et al. \Microgrids", IEEE Power and Energy Mag., 13(4), pp. 35-43 (2015).
20. Aguero, J.R., Bahramirad, S., and Khodaei, A. \Build-ing resilient integrated grids", Electrication Mag., 3(1), pp. 48-55 (2015).
21. Bahramirad, S., Reder, W., and Khodaei, A. \Reliability-constrained optimal sizing of energy stor-ages", IEEE Trans. Smart Grid, 3(4), pp. 2056-2062 (2012).
22. Alsaidan, I., Khodaei, A., and Gao, W. \A compre-hensive battery energy storage optimal sizing model for microgrid applications", IEEE Trans. Power Syst., 33(4), pp. 3968-3980 (2018).
23. Yuancheng, M. \Reliability and economy evaluation of microgrid based distribution network connection mode", 4th International Conf. on Electric Utility Deregulation and Restructuring and Power Technolo-gies (DRPT), Shandong, China (2011).
24. Madathil, S.C., Yamangil, E., Nagarajan, H., et al. \Resilient o-grid microgrids: Capacity planning and N-1 security", IEEE Trans. Smart Grid, 9(6), pp. 6511-6521 (2018).
25. Billinton, R. \Maintaining supply reliability of small isolated power system using renewable energy", IEEE Proc. Generation, Transmission and Distribution, 148(6), pp. 530-534 (2001).
26. Arefar, S.A. \Optimum microgrid design for en-hancing reliability and supply-security", IEEE Trans. Smart Grid, 4(3), pp. 1567-1575 (2013).
27. Shahidehpour, M. and Khodaei, A. \Microgrid plan-ning under uncertainty", IEEE Trans. Power Syst., 30(5), pp. 2417-2425 (2013).
28. Ranjbar, H. and Safdarian, A. \A robust model for daily operation of grid-connected microgrids during normal conditions", Sciantia Iranica J. (In Press). DOI:10.24200/sci.2019.50690.1819
29. Zhang, J. and Zeng, B. \Integrated planning for transi-tion to low-carbon distributransi-tion system with renewable energy generation and demand response", IEEE Trans. Smart Grid, 29(3), pp. 1153-1165 (2014).
30. Yang, X. \Microgrid's generation expansion plan-ning considering carbon economy", 2012 Asia-Pacic Power and Energy Engineering Conf., Shanghai, China (2012).
31. Shahidehpour, M. and Khodaei, A. \Microgrid-based co-optimization of generation and transmission plan-ning in power systems", IEEE Trans. Power Syst., 28(2), pp. 1582-1590 (2013).
32. Cheng, B. and Wang, Z. \Robust optimization based optimal DG placement in microgrids", IEEE Trans. Smart Grid, 5(5), pp. 2173-2182 (2014).
33. Khodaei, A. \Resiliency-oriented microgrid optimal scheduling", IEEE Trans. Smart Grid, 5(4), pp. 1584-1591 (2014).
34. Khodaei, A. \Provisional microgrid planning", IEEE Trans. Smart Grid, 8(3), pp. 1584-1591 (2017). 35. Atia, R. and Yamada, N. \Sizing and analysis of
renewable energy and battery systems in residential
microgrids", IEEE Trans. Smart Grid, 7(3), pp. 1204-1213 (2016).
36. Wu, T., Yang, Q., Bao, X., et al. \Coordinated energy dispatching in microgrid with wind power generation and plug-in electric vehicles", IEEE Trans. Smart Grid, 14(1), pp. 47-57 (2013).
37. Zhang, C., Xu, Y., Dong, Z.Y., et al. \Robust co-ordination of distributed generation and price-based demand response in microgrids", IEEE Trans. Smart Grid, 5(4), pp. 1608-1620 (2017).
38. Ahmad Bashir, A., Pourakbari-Kasmaei, M., Contr-eras, J., et al. \A novel energy scheduling framework for reliable and economic operation of islanded and grid-connected microgrids", Electric Power Systems Research J., 171, pp. 85-96 (2019).
39. Safdarian, A. \Integration of price-based demand re-sponse in Discos' short-term decision model", IEEE Trans. Smart Grid, 5(5), pp. 2235-2245 (2014).
Biographies
Mohsen Chegnizadeh received his BSc from Amirk-abir University of Technology, Tehran, Iran, in 2014, and the MSc degree from Sharif University of Tech-nology, Tehran, Iran, in 2017, both in Electrical Engi-neering. His current research interests include power system resilience, smart grid issues, and distribution system operation and planning.
Amir Safdarian received the BSc degree from Tehran University, Tehran, Iran, in 2008, and the MSc and PhD degrees from Sharif University of Technology, Tehran, Iran, in 2010 and 2014, respectively. He is currently an Assistant Professor at Sharif University of Technology. His research interests include distribution system operation and planning, smart grid issues, and power system reliability and resilience. Dr. Safdarian was a recipient of the 2013 IEEE Power System Operation Transactions Prize Paper Award, 2016 IEEE Iran Section Best PhD Dissertation Award, and 2019 IEEE Iran Section Young Investigator Award. Also, he was on the list of outstanding reviewers of IEEE Transactions on Sustainable Energy in 2016.