1
Table of Contents
Abstract ...2
Localized Prostate Cancer Patients on Active Surveillance: How Frequently Should We Biopsy Them? A Systematic Review ...3
Abstract ...3
Introduction ...4
Methods ...5
Results ...9
Discussion ...12
References ...14
Tables and Figures ...17
Comparison of Patient versus Physician Reporting of Comorbidities, Results from a Population-Based Cohort of Prostate Cancer Patients ...29
Abstract ...29
Introduction ...31
Methods ...32
Results ...34
Discussion ...36
References ...41
Tables and Figures ...46
2
ABSTRACT
Prostate cancer is the most common malignancy and the second leading cause of cancer mortality in men in the United States, with 240,000 cases diagnosed and 30,000 deaths annually. It is a significant burden for the United States population and health care system due to the disease prevalence, mortality, effects on health related quality of life, as well as cost of
treatment. Many different treatment options are available for localized, non-metastatic prostate cancer, such as active surveillance, radical prostatectomy, and radiation therapy, with newer and costlier treatment options being developed. Comparative effectiveness research between these forms of treatment is imperative to determine differences in survival outcomes, health related quality of life, and costs. Here, we reviewed the literature for the frequency of repeat biopsy in prostate cancer patients receiving active surveillance and effects on rate of disease progression, and found insufficient evidence regarding this. Additionally, due to the importance of baseline comorbid conditions in men with prostate cancer in terms of treatment decision making, health related quality of life, and survival outcomes, we conducted a prospective study of 881 men in North Carolina with localized prostate cancer to compare patient versus physician reporting of comorbidities. We calculated percent agreement and its kappa statistic between patient and physician-report for 20 commonly used comorbidities in cancer research. We found that overall, agreement between patient and physician reporting of common comorbidities in
3
Localized Prostate Cancer Patients on Active Surveillance: How Frequently
Should We Biopsy Them? A Systematic Review
ABSTRACT
Background: Active surveillance is a strategy in treating low-risk localized prostate cancer patients which defers treatment and monitors patients for disease progression. It is unclear what the optimal surveillance schedule should be. This review assesses the literature for frequency of surveillance biopsy and how that affects detection of disease progression.
Methods: One author performed a systematic review of the literature on active surveillance strategies which used different frequencies of surveillance biopsy using PubMED. The articles were quality rated for internal validity, and external validity.
Results: Twelve (12) studies met the inclusion criteria. Only one study directly assessed the risk of disease progression in relation to the timing of the repeat biopsy, (hazard ratio = 0.40, 95% CI = 0.56-1.58) when the repeat biopsy was performed within 6 months. The remaining studies assessed a mix of probability of disease progression, probability of meeting active surveillance criteria at given time points, percentage of patients who progressed, rate of intervention in patients, and percentage of patients receiving a repeat biopsy without directly analyzing timing of repeat biopsies during active surveillance.
4
INTRODUCTION
Prostate cancer is the most common cancer and the second leading cause of cancer
mortality in men.1,2 However, unlike other cancers, such as lung or colorectal, there is a wide gap between the incidence and mortality rates of prostate cancer, as more than 240,000 cases are diagnosed yearly compared to roughly 30,000 deaths annually.1-3 The widespread advent of prostate-specific antigen (PSA) testing for the detection of prostate cancer resulted in a significantly higher incidence without similar increases or decreases in mortality.4,5 This has
raised concerns regarding overdiagnosis, since many of these cancers are localized, small volume, and low grade, and would not have otherwise resulted in any clinical symptoms.4,5 Overdiagnosis rates of prostate cancer have been estimated to be between 27% and 56%.4,6 Unfortunately, the natural history of prostate cancer is heterogeneous and not well understood.3 While some patients may benefit from radical treatment, others may not; as they may suffer from side effects of treatment for a potentially indolent cancer.7
More than 90% of newly-diagnosed prostate cancer patients have localized and potentially curable disease.1There are many different types of treatment options available for patients with localized prostate cancer, including radical prostatectomy, radiation therapy, and active surveillance.5 While radical prostatectomy, external beam radiotherapy, and brachytherapy
are considered curative therapies for low-risk prostate cancer, they may result in long-term urinary, bowel, and sexual dysfunction, harming patient quality of life.5,8 An alternative strategy to these curative methods is active surveillance, which defers treatment and actively monitors low risk patients for disease progression, at which point curative treatment is offered.5,9
5 men with prostate cancer will not benefit from invasive treatment, and this allows
individualization of therapy based on the risk of clinically significant cancer.10 With this
strategy, overtreatment of prostate cancer may be reduced, saving patients from the side effects of treatment as well as saving health resources spent on curative therapy.10
Active surveillance strategies vary in terms of which follow-up criteria (DRE, PSA, rebiopsy, and/or TRUS) to use, and how often those tools are used.7 Prostate biopsies have associated harms, including pain and discomfort, rectal bleeding, change in urine flow, and infection, which may lead to urosepsis and death.11 Out of the various aforementioned follow-up criteria, prostate biopsy provides the most objective measure of cancer progression.12 Therefore, therefore the frequency of prostate biopsies should balance the benefit of potential detection of cancer progression with the harms of potential side effects. At the time of this review, it is unclear what the optimal surveillance schedule should be. The aim of this review is to examine men with localized prostate cancer undergoing active surveillance, and if there are any
differences in the rate of detection of disease progression requiring intervention, when rebiopsy is performed at intervals less than one year after diagnosis compared to every one year or more after diagnosis.
METHODS
Key questions
Key question 1: Which studies of men with localized prostate cancer undergoing active surveillance assess risk of progression requiring active treatment?
6 Eligibility criteria
For this review, I limited the population of interest to men with localized (node negative, non-metastatic) prostate cancer who are undergoing or have undergone an active surveillance protocol. I chose to exclude men who have previously been treated for prostate cancer because the management and treatment of recurrent prostate cancer is different from that of the initial cancer. The intervention and comparator of interest focus on the frequency of prostate biopsy after diagnosis has already been established and after the patient and provider choose to undergo active surveillance. For this review, I chose to compare a one-year or more interval with less than 1 year. The outcome of interest is detection of disease progression requiring active treatment in the form of surgery or radiation. Although the optimal outcome of interest is benefit in survival or quality of life, these data are unlikely to be available as the natural history of prostate cancer can be very long. Active treatment is instead a surrogate marker as treatment may result in quality of life effects in terms of urinary, bowel, and sexual dysfunction.8 I chose to examine articles published in the past 10 years (after January 1st, 2004), as prostate cancer detection and treatment methods have evolved greatly. Studies must be performed in Western countries, as these populations are more generalizable to the United States. For inclusion the studies must be longitudinal studies. These predetermined inclusion and exclusion criteria are included in the PICOTTSS table shown in Table 1.
Data sources and searches
7 limited my search to studies in English only. I looked for longitudinal studies that studied men with localized prostate cancer who have been on active surveillance, with data on progression of disease detected requiring treatment. For the MEDLINE search I used the focused MeSH terms “Prostatic Neoplasm” or “Prostate Specific Antigen” or the non-MeSH term “Prostate Cancer”
combined with the non-MeSH terms “Active Surveillance” and “Longitudinal Studies.” The search strategy in MEDLINE is as follows: ((((((prostatic neoplasm[MeSH Major Topic]) OR prostate specific antigen[MeSH Major Topic] OR prostate cancer) AND “active surveillance”))) AND longitudinal studies). This yielded 141 results. Applying the filters “Humans,” and
“English,” narrowed the results to 132. After limiting the studies to those after 2004, this further
narrowed the results to 131. Additionally, I augmented my search by hand-searching the
reference lists of relevant studies as well as review articles to find any other studies that met the inclusion criteria.
Study selection
I selected and reviewed titles and abstracts of articles retrieved for my focused question in a systematic manner. I used predetermined inclusion and exclusion criteria listed in Table 1. I pulled full text articles for review if the title and abstract seemed relevant for the focused
8 These studies must have been published in English. The study selection was performed by a single reviewer, however, it would have used two reviewers if additional time and resources were made available.
Data extraction process
I developed a data extraction sheet to gather relevant data. These include sample size, participant characteristics (such as mean/median age, mean/median baseline PSA levels, mean/median Gleason scores, etc.), criteria for active surveillance, criteria for progression, frequency of biopsy after active surveillance enrollment, study results (including median follow-up time, percentage of patients who progressed, percentage of patients that underwent active treatment, and survival outcomes if present), and overall conclusions about the study.
Quality assessment and risk of bias in individual studies
I reviewed the full-text articles meeting all eligibility criteria and independently rated their quality with a single reviewer method. Double review would have been used if adequate time and resources were available. I rated the internal validity of the articles by assessing each for selection bias, measurement bias, and confounding. I assigned grades of “low,” “moderate,” and “high” for potential sources of bias. I also graded each study for the external validity. The studies were rated overall as “good,” “fair,” or “poor.” In order to qualify for a rating of “good,”
a study must be well-designed with no more than low risk for selection bias, measurement bias, and confounding. A “fair” rating was given if potential for selection bias, measurement bias, and
9 Synthesis of results and data analysis
I combined all relevant abstracted data from the included studies qualitatively and quantitatively in a narrative and table format. Given that study designs, participants, active surveillance initiation criteria, frequency of rebiopsy, and reported outcomes were markedly varied, I chose to focus on describing the studies, results, applicability, and limitations in a qualitative synthesis analysis rather than use a meta-analysis.
Role of funding Source(s)
There was no specified funding for this particular review and there are no known conflicts of interest related to this review.
RESULTS
Search results
The initial PubMed search returned 131 articles for review. A review article found during the search process listed another 7 articles, 4 of which were duplicated from the PubMed search. 22 full-text articles were assessed for eligibility, and out of these, 10 papers were excluded because they were previous non-updated versions of studies that were already included. As such, 12 total articles meeting the inclusion criteria were used in this systematic review (Figure 1).
Study characteristics
10 repeated biopsies. 6 studies used 1 year or less as the initial rebiopsy frequency while the other 6 used 1 year or more. The majority of studies all used similar criteria for inclusion of patients in active surveillance, with a combination of PSA, Gleason score, number of positive cores on biopsy, percentage of involvement in each core, clinical stage, and/or PSA velocity. Similarly, progression criteria were similar, although some studies incorporated PSA and clinical stage to measure progression while others used only characteristics derived from prostate biopsy. Baseline patient characteristics for all studies were also relatively similar, with mean or median ages between 62 and 71, and mean or median PSA below 7.5 ng/mL. However, outcome measures were inconsistently reported across studies, as some report median time to biopsy while others do not, and some describe risk of progression while others do not.
Study quality
Internal validity was measured by the presence or absence of selection bias, measurement bias, and confounding. The main risk for selection bias in these studies is that many of the
11 risk of confounding was high as the study was performed in community outpatient clinics, so patients could change urologists and the second opinions of those urologists may cause bias towards active treatment.
External validity was evaluated based on whether results from these studies could apply to the wider population of men undergoing active surveillance. Many of these studies were recruited from a single institution, which led to a rating of “fair” for those studies. One study had
poor external validity as their criteria for including patients in the active surveillance protocol was stricter than others, leading to inclusion of more patients with favorable risk prostate cancer.14 One study received a rating of “good” for external validity because patients were recruited from 100 medical centers in 17 countries.15 Overall, two studies received an overall rating of “good,” two studies received an overall rating of “poor,” while the other 8 studies were rating as “fair” (Table 3).
Results of studies
12 studies where repeat biopsy was scheduled to be performed 1 year or later, progression-free survival was found to be 64% and 59% at 5 years in two different studies, and 67.7% at 4 years.
DISCUSSION
Overall, there is insufficient evidence regarding frequency of surveillance biopsy in prostate cancer patients on active surveillance. In this systematic review, only one article directly assessed the risk of disease progression in relation to the timing of the repeat biopsy, which found that the hazard ratio for progression was 0.40 (95% CI = 0.56-1.58) when the repeat biopsy was performed within 6 months.
There are some major limitations with this review. Firstly, many studies did not report a median or mean time to biopsy. While there were general guidelines for all studies on when to perform a repeat biopsy, patients could receive one earlier in all but 2 studies if they progressed due to non-biopsy factors such as rising PSA levels, increasing PSA velocity, or increasing clinical stage. This makes it difficult to compare data regarding progression-free survival or rates of progression across the intervention and comparison group of performing biopsy before 1 year and 1 year or more after start of active surveillance. Secondly, in this review, we were unable to use the ideal outcome of survival, and instead used the surrogate end point of disease
progression. This is not ideal, because this is an intermediate health measure; progression does not necessarily mean that a patient will die from prostate cancer, and conversely, not all patients who exhibit disease progression will die of prostate cancer.5 Thirdly, only one study out of 12 assessed the harms of prostate biopsy in terms of pain scores, which is an important
13 an interval of 10 years is too short to evaluate prostate cancer mortality,16 but the longest follow up time across all studies in this review is 76 months.
Prostate cancer is a disease which affects and kills many men in the United States. At the same time, there is a concern that prostate cancer is overdiagnosed in patients, leading to
unnecessary morbidity and mortality from treatment.4 Active surveillance is a strategy used to reduce potential overtreatment of patients, and this review of the literature from 2004-2014 examines if there are differences in disease progression requiring active treatment in patients that receive surveillance biopsy at a frequency of less than 1 year following start of active
14
REFERENCES
1. Siegel R, DeSantis C, Virgo K, et al. Cancer Treatment and Survivorship Statistics, 2012. Vol 62: CA: A Cancer Journal for Clinicians; 2012:220-241.
2. Siegel R, Naishadham D, Jemal A. Cancer statistics, 2012. CA Cancer J Clin. 2012;62(1):10-29.
3. Dall'Era MA, Cooperberg MR, Chan JM, et al. Active surveillance for early-stage prostate cancer: review of the current literature. Cancer. 2008;112(8):1650-1659. 4. Etzioni R, Penson DF, Legler JM, et al. Overdiagnosis due to prostate-specific antigen
screening: lessons from U.S. prostate cancer incidence trends. J Natl Cancer Inst. 2002;94(13):981-990.
5. Bangma CH, Roemeling S, Schröder FH. Overdiagnosis and overtreatment of early detected prostate cancer. World J Urol. 2007;25(1):3-9.
6. Johansson JE, Andrén O, Andersson SO, et al. Natural history of early, localized prostate cancer. JAMA. 2004;291(22):2713-2719.
7. Bastian PJ, Carter BH, Bjartell A, et al. Insignificant prostate cancer and active
surveillance: from definition to clinical implications. Eur Urol. 2009;55(6):1321-1330. 8. Sanda MG, Dunn RL, Michalski J, et al. Quality of life and satisfaction with outcome
among prostate-cancer survivors. N Engl J Med. 2008;358(12):1250-1261.
9. Aragon-Ching JB. Active surveillance for prostate cancer: has the time finally come? J Clin Oncol. 2010;28(16):e265-266; author reply e267.
15 11. Clements R, Aideyan OU, Griffiths GJ, Peeling WB. Side effects and patient
acceptability of transrectal biopsy of the prostate. Clin Radiol. 1993;47(2):125-126. 12. Al Otaibi M, Ross P, Fahmy N, et al. Role of repeated biopsy of the prostate in predicting
disease progression in patients with prostate cancer on active surveillance. Cancer. 2008;113(2):286-292.
13. King AC, Livermore A, Laurila TA, Huang W, Jarrard DF. Impact of immediate TRUS rebiopsy in a patient cohort considering active surveillance for favorable risk prostate cancer. Urol Oncol. 2013;31(6):739-743.
14. Tosoian JJ, Trock BJ, Landis P, et al. Active surveillance program for prostate cancer: an update of the Johns Hopkins experience. J Clin Oncol. 2011;29(16):2185-2190.
15. Bul M, Zhu X, Valdagni R, et al. Active surveillance for low-risk prostate cancer worldwide: the PRIAS study. Eur Urol. 2013;63(4):597-603.
16. Schröder FH, Hugosson J, Roobol MJ, et al. Prostate-cancer mortality at 11 years of follow-up. N Engl J Med. 2012;366(11):981-990.
17. Adamy A, Yee DS, Matsushita K, et al. Role of prostate specific antigen and immediate confirmatory biopsy in predicting progression during active surveillance for low risk prostate cancer. J Urol. 2011;185(2):477-482.
18. Iremashvili V, Manoharan M, Rosenberg DL, Soloway MS. Biopsy features associated with prostate cancer progression in active surveillance patients: comparison of three statistical models. BJU Int. 2013;111(4):574-579.
16 20. Kravchick S, Peled R, Cytron S. Watchful waiting and active surveillance approach in
patients with low risk localized prostatic cancer: an experience of out-patients clinic with 12-year follow-up. Pathol Oncol Res. 2011;17(4):893-897.
21. Patel MI, DeConcini DT, Lopez-Corona E, Ohori M, Wheeler T, Scardino PT. An analysis of men with clinically localized prostate cancer who deferred definitive therapy. J Urol. 2004;171(4):1520-1524.
22. Porten SP, Whitson JM, Cowan JE, et al. Changes in prostate cancer grade on serial biopsy in men undergoing active surveillance. J Clin Oncol. 2011;29(20):2795-2800. 23. Soloway MS, Soloway CT, Williams S, Ayyathurai R, Kava B, Manoharan M. Active
surveillance; a reasonable management alternative for patients with prostate cancer: the Miami experience. BJU Int. 2008;101(2):165-169.
24. Thomsen FB, Røder MA, Hvarness H, Iversen P, Brasso K. Active surveillance can reduce overtreatment in patients with low-risk prostate cancer. Dan Med J.
17
Table 1: PICOTTSS Table
Inclusion Exclusion
Populations Men with localized prostate cancer who are undergoing an
active surveillance protocol
Men who have previously been treated for prostate
cancer Intervention Rebiopsy frequency 1 year or
more
Comparison group Rebiopsy frequency less than 1 year
Outcomes Progression of disease so that patient requires active treatment (including surgery
or radiation) Time for Intervention to
Work
Follow-up of at least 12 months after beginning of
active surveillance Time period for relevant
studies/literature
Studies published since 2004 Anything prior to 2004 Setting Studies conducted in Western
countries
All other countries
18
19
Table 2: Studies of patients on active surveillance comparing different frequencies of surveillance biopsy
Author, Year (Reference) Sample Size Participant Characteristics Active Surveillance Criteria
Progression Criteria Frequency of Rebiopsy
Study Results
Adamy 201117
238 Median age: 64 years
Median time to biopsy: 4.7 mos Median PSA: 4.1
ng/mL Patients
recruited between 1993-2009
PSA < 10 ng/mL Gleason < 7 ≤ 3 positive biopsy
cores
Clinical stage ≤ T2a Tumor in less than 50%
of 1 biopsy core
PSA ≥ 10 ng/mL (although not included in modified criteria)
Gleason ≥ 7 >3 positive cores Clinical stage > T2a Tumor in greater
than 50% of 1 biopsy core
Confirmatory rebiopsy within 6 mos 12-18 mos
following AS, then 2-3 years following When clinical
exam changed or PSA
increased
32/238 found to progress on modified criteria (which does not include PSA levels) 2 and 5 year probability for
meeting modified active surveillance criteria of 91% and 76% respectively 63% of patients receive
confirmatory biopsy within 6 mos, 58% of those without cancer
Progression when biopsy 2 is within 6 months of biopsy 1 (HR = 0.4, 95% CI = 0.56-1.58) Al Otaibi
200812
186 Median age: 67 years
Patients recruited from 1987 and 2006
Not specified T ≥ cT2b
≥3 positive cores Tumor in greater
than 50% of 1 biopsy core
Gleason pattern of 4 or greater
12 months following AS When clinical
exam changed or PSA
increased (checked every 3-6 months)
49% patients were rebiopsied 36% progressed on rebiopsy First repeat biopsy positive in
52% of patients
31% received definitive treatment
Probability of disease progression:
12 mos: 8.7 24 mos: 23.4 60 mos: 35.8
Median time to treatment: 44 months
20 Bul 201215 2494
Median age: 65.8 years
Median time to first biopsy: 1.1 years
Median PSA: 5.6 ng/mL
Patients from PRIAS study starting from 2006
PSA ≤ 10 ng/mL
PSA density < 0.2 ng/mL <3 positive biopsy cores Gleason ≤ 6
Clinical stage T1/T2
> 2 positive cores Gleason > 6
PSA doubling by < 3 years
1, 4, 7 years Yearly if PSA
doubles between 3-10 years
PSA every 3 mos for first 2 years, then every 6 mos
Repeat biopsy in 1480 men Out of those rebiopsied, 28%
reclassified (does not include PSA doubling)
Median time to active therapy 1.2 years
21.1% underwent active therapy
387/2494 (15.5%) received treatment due to biopsy progression
Active treatment free survival: 2 yr: 77.3%
4 yr: 67.7% Iremashvili
201318
161 Median age: 62 years
Media PSA: 4.9 ng/mL
All patients recruited from University of Miami from 1994 to 2001
Gleason ≤ 6 ≤ 2 positive cores ≤ 20% involvement of
any core
Clinical stage T1-T2a
Gleason 4/5 cancer > 2 positive cores >20% involvement of
any core
Within 1 year of diagnosis, and then 1-2 years following PSA/DRE
checked every 3-4 months
100% of patients underwent at least 2 surveillance biopsies First surveillance biopsy did
not contain cancer in more than 50% of patients
28.6% of patients progressed Median follow-up: 3.6 years
King 201313 67 Mean age: 63.9 years
Mean PSA: 5.9 ng.mL Patients recruited from University of Wisconsin 2007-2011
Gleason < 7 PSA < 10 ng/mL PSA density < 0.15 < 3 positive biopsy
cores
< 50% involvement of any core
Gleason ≥ 7 PSA ≥ 10ng/mL PSA density ≥ 0.15 ≥ 3 positive biopsy
cores
≥ 50% involvement of any core
Within 6 months
Average time to rebiopsy: 2.7 mos
78% underwent rebiopsy 56% demonstrated no
evidence of CaP on rebiopsy 17% exceeded AS criteria
21 Klotz
201219
450 Median age: 70.3 85% of patients
had PSA ≤ 10 12% had PSA
between 10 and 15
Patients
recruited starting from 1995
Between 1995-1999: Gleason ≤ 6
PSA ≤ 10 for patients < 70
For patients > 70, PSA ≤ 15, Gleason ≤ 3+4
After 2000, limited to favorable risk patients only
PSA doubling time <3 years (2 years used for first 4 years of study)
Gleason score ≥ 4+3 “Unequivocal clinical
progression” Nodules
6-12 months after starting AS, 3-4 years after
PSA every 3 months for 2 years, then every 6 months if stable
48% progression due to PSA doubling time
26% progression due to Gleason upgrading
Intervention in 30% patients Likelihood of remaining on
surveillance: 84%, 72%, 62% for 2, 5, and 10 years Median follow-up time 6.8
years
5 and 10 year cause specific survival of 99.7% and 97.2% Kravchick
201120
48 Mean age: 68.4 years
Mean PSA: 7.4 ng/mL
Patients recruited from community outpatient clinics of 2 health insurance companies from 1998-2006
PSA ≤ 10 ng/mL Gleason ≤ 6
Clinical stage T1a/T1c < 3 positive biopsy
cores
< 30% involvement of any core
Increases in Gleason score or number of positive cores
considered indications for active treatment
18 months after starting AS or changes in PSA or DRE measured every 3 months
28/48 patients underwent rebiopsy
41.7% underwent active treatment, but half of them met medical criteria
Mean follow-up: 81.1 mos Pain scores statistically
significantly higher in those who underwent 3 or more biopsies
Patel 200421
88 Mean age: 65.3 years
Mean PSA: 5.9 ng/mL
Patients recruited from Baylor College of Medicine or Memorial Sloan
Gleason ≤ 7
Clinical stage T1/T2
Point system with Gleason score
increase, PSA velocity increase, DRE/TRUS indications of lesions, and number of cores, needing 3 points to progress
6 months after starting active surveillance Or changes in
DRE/TRUS/ PSA indicating progression
25% of patients progress Actuarial 5 and 10 year
progression-free survival: 67% and 55%
31/88 patients treated Repeat biopsy median of 8
22 Kettering Cancer
Center between 1984 and 2001
Median time to progression (in cases that progressed): 45 months
Positive rebiopsy significantly associated with progression (p = 0.004)
Median follow-up: 44 months Porten
201122
377 Mean age: 61.9 Median PSA: 5.74
ng/mL Patients from
University of California at San Francisco Urologic Oncology Database included between 1998 and 2009
PSA < 10 ng/mL Gleason ≤ 6 with no
Gleason 4 or 5 component
Cancer involvement of <33% of biopsy cores Clinical stage: T1/T2a Also included men who
wished to undergo AS outside these criteria
Increase in primary or secondary Gleason score
12-24 months after AS Repeat PSA
and DRE every 3 months
Median time between biopsies from 12-16 months 54% of men had 2 or more
repeat biopsies
34% had increase in Gleason grade
105/377 experienced Gleason upgrade within 30 months of initial diagnosis
59% of those underwent definitive treatment (76/377 total)
Treatment-free survival rates at 5 years after diagnosis 40% for those who upgraded and 80% for those with no upgrade
Mean follow-up time: 54 months after first repeat biopsy
Another 37/377 chose to undergo treatment despite no change in Gleason score Soloway
200823
99 Median age: 67 Median PSA: 5.77
Gleason score ≤ 6 PSA ≤ 15 ng/mL Clinical stage ≤ T2
Increase in PSA velocity of PSA doubling time
6-12 months after AS, then yearly
23 Patients followed
from 1992-2007
Tumor in less than 50% of two biopsy cores Excluded men ≥ 80
years of age
> 12 months follow up
Gleason ≥ 7 Tumor volume
increase
Stage progression
Repeat PSA and DRE every 3 months
8/99 (8%) underwent treatment
5-year probability of
treatment-free survival 85% Median follow-up: 38 months Thomsen
201324
167 Median age: 65 years
Median PSA: 6.5 Median time to
first biopsy: 12.7 months
Patients included from 2002 to 2011
PSA ≤ 10 ng/mL Gleason ≤ 6 Clinical stage T1-2a ≤ 3 positive biopsy
cores
Tumor in less than 50% of biopsy cores
Possible progression (intermediate risk):
PSA double time 3-5 years Increase in
Gleason score to 3+4
cT2b Recommend
treatment (high-risk):
PSA doubling time < 3 years Increase in
Gleason score to ≥4+3, or > 3 positive cores ≥cT2c
Within 15 months following AS Repeat PSA
and DRE every 3 months
Median follow-up: 3.4 years 86% of subjects received
rebiopsy
20% progressed on re-biopsy alone
82% of these within first 2 years
22% reclassified as intermediate risk
17% reclassified as high-risk
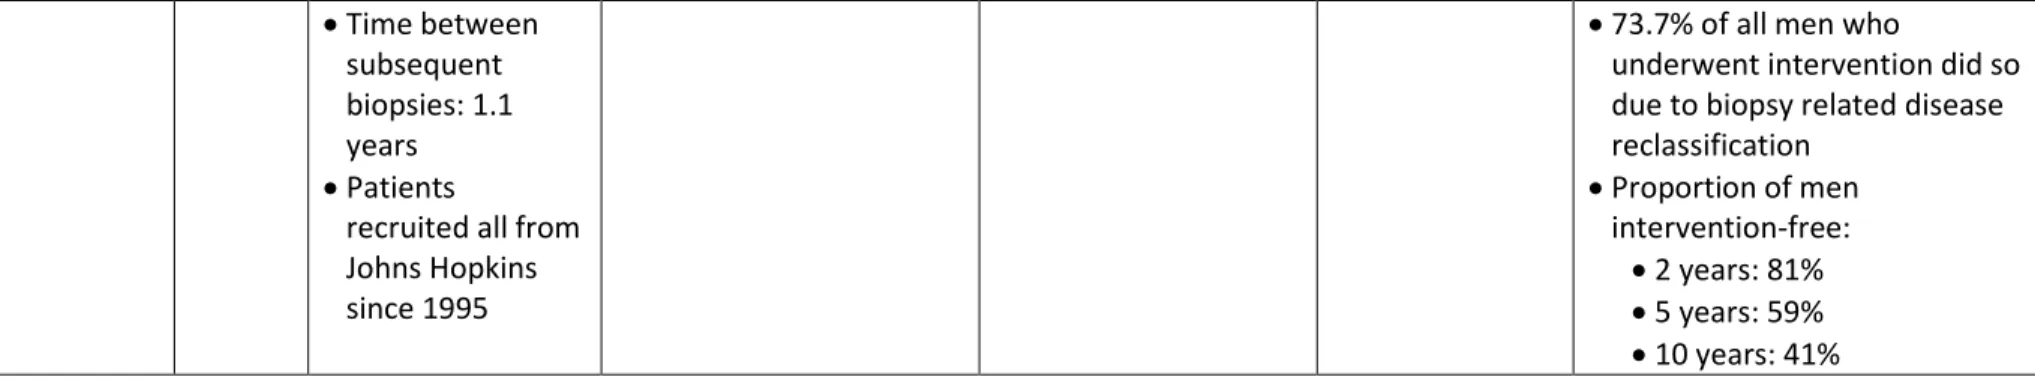
Tosoian 201114
769 Median age: 66 years
Median PSA: 5.0 ng/mL in treated group, 4.7 ng/mL in not treated group
Mean time to first biopsy: 1.3 years
Gleason ≤ 6 ≤ 2 positive biopsy
cores
Clinical stage ≤ T1c Tumor in less than 50%
of 1 biopsy core PSA density < 0.15
ng/mL
Gleason > 6 > 2 positive biopsy
cores
Tumor in more than 50% of 1 biopsy core
12 months following AS “Semiannual”
PSA and DRE exams
Median follow-up: 2.7 years Compliance with annual
surveillance biopsies was 92% for first biopsy
Median survival free of intervention: 6.5 years 33.2% of men underwent
24 Time between
subsequent biopsies: 1.1 years Patients
recruited all from Johns Hopkins since 1995
73.7% of all men who
underwent intervention did so due to biopsy related disease reclassification
Proportion of men intervention-free:
2 years: 81% 5 years: 59% 10 years: 41%
Table 2: Risk of bias in studies
Author, Year (Reference)
Internal Validity External Validity Overall
Rating
Overall Conclusions Selection Bias Measurement
Bias Confounding Adamy 201117 High Unclear how patients were recruited, relatively few lost to follow up.
Low-Moderate Most of the measures are standardized, unlikely that clinical stage or pathology differs
Low – Moderate Other factors such as clinical stage could result in progression, not just biopsy results. PSA levels
excluded.
Fair
Unclear how this patient group compares to general population
Fair The median time to biopsy in this cohort is 4.7 mos, however the hazard ratio for progression is not significant. About 13% of patients progressed,
however it is unclear when the progression occurred. Al Otaibi 200812 High Recruitment of patients not described Low 1 out of 2 pathologists reviewed biopsy data
Moderate
Other factors such as clinical stage could result in progression, not just biopsy results.
Fair
10% of patients have baseline PSA > 10 ng/mL
Fair Results are difficult to interpret for purposes of this review, as less than half of patients received rebiopsy Progression criteria includes clinical
stage, not just biopsy
25 Disease progression appears most
likely in the first 2 years Bul 201215 Low
PRIAS study (100 medical centers in 17 countries) Baseline
characteristics similar
Low drop out rate (1.7%)
Low-Moderate Internet-based tool (Unclear if abstractors are blinded, and how many there are)
Low Good
Large study across 17 countries and 100 medical centers
Good Well done study, no data directly showing frequency of rebiopsy with disease progression
Median time to biopsy is 1.2 years, 59% of patients receive a repeat biopsy Active treatment free survival at 2
years is 77.3% and 67.7%
This study started recruited patients more recently than most other studies in this review (starting in 2006) Iremashvili 201318 Moderate Possible self-selection bias due to recruitment at single institution Low Outside biopsy slides reviewed by institutional genitourinary pathologist Clinical stage
by attending urologist
Low
Progression was only noted due to biopsy features
Fair
All patients recruited at single institution, unclear how this compares to general population
Good Used 3 models (diagnostic biopsy, first surveillance biopsy, and combination of the two) to analyze risks of progression
However, time to surveillance biopsy was not included
King 201313 Moderate Recruitment of
patients were consecutive Single
institution Relatively high
dropout rate, Low Outside biopsy slides reviewed by institutional genitourinary pathologist Moderate-High Low number of men with prostate cancer choosing active
surveillance, these men may more less inclined to
Fair
All patients recruited at single institution, lower number of prostate cancer patients choosing
Fair Rebiopsy within 6 months, high rate of rebiopsy
26 but likely
non-differential 22/67 (22%)
dropped out due to lack of desire for second biopsy
Recording of data unlikely to result in measurement differences Time to
rebiopsy limited to 6 months
undergo treatment
active surveillance
Klotz 201219 Moderate-High Unclear how patients recruited
Low
Recording of data unlikely to result in measurement differences
Moderate
Other factors such as clinical stage or PSA kinetics could result in
progression, not just biopsy results.
Fair
All patients recruited at single institution, lower number of prostate cancer patients choosing active
surveillance
Fair Goal of study is to assess feasibility of observation with selective delayed intervention in prostate cancer patients (different goal than this review)
Triggers for progression are PSA kinetics and biopsy data
High follow-up time
Kravchick 201120
Moderate-High Enrollment rate of only 17.8%
High Criteria changed in 2004, prior to this date, protocol for repeat biopsy was not present High
Study was done in community outpatient clinics, patients change urologists and second opinions may cause bias towards active treatment
Fair
Only included patients between 60-75 years of age, however patients recruited from community outpatient clinics (likely more representative of overall population)
Poor Unclear when patients underwent surveillance biopsy (no median or mean time given, since they could receive one at 18 months or from PSA or clinical progression), makes results difficult to interpret in context of this review
27 Patel 200421 Moderate-High
Unclear how patients recruited Moderate PSA velocity calculated from 3 recorded values in a 1 year period Moderate-High Excluded patients with significant comorbidities, a population which frequently undergoes active surveillance Fair Patients
recruited at two well-known cancer institutions, unclear how this compares to general population
Poor This study started recruited patients more less recently than most other studies in this review (starting in 1984) Relatively small sample size
Repeat biopsy median of 8 months after diagnosis, 16% progress
Porten 201122
Low-Moderate All patients
from single institution, possible self-selection bias Only 3% lost to
follow up
Low Biopsies all underwent slide review by in-house pathologist
Low
Progression was only noted if Gleason score was upgraded
Fair
All patients recruited at single institution, unclear how this compares to general population
Good Large sample size
Only progressed if Gleason score was upgraded
Unclear how many patients only had 1 repeat biopsy
Unsure of progression free survival
Soloway 200823
Moderate Unclear how
patients were recruited Baseline
characteristics appear similar for overall and treated groups 7/99 lost to
follow up Moderate Database designed for entering of relevant clinical and pathologic data Moderate
Other factors such as clinical stage or PSA levels could result in
progression, not just biopsy results
Fair
All patients recruited at single institution, unclear how this compares to general population
Fair Sample size is moderate
Unclear when the median biopsy time is
Progression criteria includes clinical stage and PSA, not just biopsy No analysis for timing of biopsy
28 Thomsen
201324
Low-Moderate All patients from single institution, possible self-selection bias
Low
All biopsies re-evaluated by in house
uropathologist
Moderate
Other factors such as clinical stage could result in progression, not just biopsy results
Fair
6% of patients with Gleason score of 7
Fair Relatively high rate of rebiopsy, mean time until first surveillance biopsy listed
Most of those who progressed on rebiopsy did so within first two years Unfortunately no data directly
comparing biopsy time to progression Sample size is moderate
Tosoian 201114 Moderate Patients recruited all from Johns Hopkins Baseline characteristics between treated and untreated mostly similar, although mean and median year of diagnosis in those not treated was 3 years later 12% dropped
out
Low-Moderate Most of the measures are standardized, unlikely that clinical stage or pathology differs
Low Poor
These patients are very-low risk, with stricter enrollment criteria, and all recruited from Johns Hopkins, which may be different from the general population
Fair Comparing this to other studies in this review is difficult, because patients recruited are all very-low risk with stricter enrollment criteria
Pros are that mean time until first surveillance biopsy is listed, as well as compliance
29
Comparison of Patient versus Physician Reporting of Comorbidities, Results
from a Population-Based Cohort of Prostate Cancer Patients
ABSTRACT
Purpose: Baseline patient comorbidities influence treatment decision making and survival outcomes for prostate cancer. Although studies now commonly collect comorbidity information, some via patient report and others through physician report, the agreement between these two information sources is unknown. This study aims to compare patient vs. physician-reported comorbidity in a recently accrued population-based cohort of patients with localized prostate cancer.
Methods: Patients with non-metastatic prostate cancer diagnosed from 2011-13 were recruited via collaboration with the North Carolina Central Cancer Registry. In a sample of 811 patients, phone survey and medical record abstraction for presence/absence of common comorbidities was conducted. We calculated percent agreement and its kappa statistic between patient and
physician-report for each condition. We performed subgroup analysis to examine differences in agreement adjusting for age, race, marital status, education level, income, and risk group. Logistic regression was used to examine covariates associated with agreement.
Results: Overall, agreement in 20 comorbidities was moderate. For some conditions (myocardial infarction, cerebrovascular disease, diabetes, HIV/AIDS, and hypertension), agreement was high (kappa > 0.62), but for all other conditions agreement was low to moderate. In subgroup
analysis, non-Caucasians have lower patient- vs. physician-report agreement for chronic
30 older age was significantly associated with lower overall agreement for myocardial infarction, cerebrovascular disease, kidney disease, coronary artery disease, and arrhythmia.
31
INTRODUCTION
Prostate cancer treatment decision making and survival outcomes are greatly affected by patient baseline comorbid conditions.1,2 Because the median age of diagnosis of prostate cancer in the United States is 67 years,3 many patients have other medical conditions concomitantly, such as diabetes, hypertension, cardiovascular disease, and cerebrovascular disease.4,5 Radical prostatectomy (RP) is a more likely treatment given to younger patients with fewer
comorbidities, while radiation therapy (RT) and conservative management (hormone therapy or no treatment) are more likely given to older patients and those with more comorbidities.3,6-8 There are additional reports demonstrating that patients with fewer comorbidities are more likely to travel long distances to receive treatment, such as proton therapy, at large volume academic centers.9
32 The purpose of this study is to compare patient- vs. physician-reported comorbidity in a population-based cohort of patients with newly diagnosed prostate cancer. We quantify the level of agreement between these two sources on a list of most common comorbid conditions in these men, and assess factors associated with agreement. Given that low socioeconomic status may be associated with poor health literacy,13,14 we hypothesized that patients who were non-white and those with lower educational attainment would have lower agreement in patient-report vs. physician-report.
METHODS
Data collection
The North Carolina Prostate Cancer Comparative Effectiveness & Survivorship Study (NC ProCESS) is a prospective, population-based cohort of newly-diagnosed localized prostate cancer patients enrolled throughout North Carolina in collaboration with the Rapid Case
Ascertainment (RCA) system of the North Carolina Central Cancer Registry. RCA is a research infrastructure with the state Cancer Registry which proactively identified newly-diagnosed prostate cancer patients from all 100 counties in North Carolina from 2011 to 2013. Names of patients, pathology and diagnostic information, as well as their physician’s names and addresses
were sent to RCA staff by tumor registrars at local hospitals on a weekly basis. These patients were then approached by NC ProCESS staff for study participation. All patients were enrolled before treatment. Participating patients were followed prospectively to collect data on patient-reported outcomes and from medical records.
Outcome Measures
33 peripheral vascular disease, cerebrovascular disease, chronic obstructive pulmonary disease, peptic ulcer disease, liver disease, diabetes, kidney disease, other cancers, human
immunodeficiency virus / acquired immune deficiency syndrome, coronary artery disease, arrhythmia, clotting disorders, hypertension, hyperlipidemia, inflammatory bowel disease, asthma, anemia and other blood disorders, and arthritis. These conditions are included in the most commonly used comorbidity indices used in cancer research, including the Charlson Comorbidity Index,15-17 Adult Comorbidity Evaluation Index (ACE-27),18 Index of Co-Existent
Diseases (ICED),16,17 and Kaplan-Feinstein Comorbidity Index.17,19,20 The conditions were assessed two ways – by patient-report via phone survey (with the question: “have you ever been told by a doctor or other health professional that you have [comorbid condition]?”) and by medical record abstraction – at the time of study enrollment, which was always before treatment. Medical records were collected from the patient’s primary care physician and prostate-cancer
providers, including urologist and radiation oncologist, and abstracted for presence of these comorbid conditions.
Statistical Analysis
We describe the presence of each condition based on patient report, medical record abstraction, both, or neither; kappa statistics were used to quantify the level of agreement between patient-report and medical records. Landis and Koch (1977) thresholds were used to classify agreement levels as poor/slight (<0.20), fair (≥0.20 – <0.40), moderate (≥0.40 – <0.60), substantial (≥0.60 – <0.80), or almost perfect (≥0.80).21 We performed subgroup analyses to
34 understanding of whether certain prostate cancer patient subgroups have higher or lower
agreement in terms of presence of comorbid conditions from the two data sources. All statistical analyses were performed using SAS 9.4 (SAS Institute, Cary, NC).
RESULTS
Baseline cohort characteristics are shown in Table 1. Median age was 65 years. This cohort is diverse with 28% non-Caucasian participants, 32% with high school education or less, and 37% with household income ≤ $40,000. Overall, 28% of patients had a family history of
prostate cancer.
35 disorders, hyperlipidemia, asthma, anemia and other blood disorders, and arthritis, patients were more likely to indicate the condition (scenario b).
Subgroup analysis for kappa based on age, race, marital status, education, income, and prostate cancer risk groups for each comorbid condition is shown in Table 3. Kappa which differed by 0.20 or more among subgroups was highlighted, and this difference was observed in 15 conditions. Specifically, kappa differed by patient race in 7 conditions: Caucasian patients had higher kappa in chronic obstructive pulmonary disease, liver disease, cancers other than prostate, and coronary artery disease; while non-Caucasians had higher kappa in congestive heart failure, clotting disorders, and inflammatory bowel disease. Kappa also differed by education in 4 conditions: patients with a high school education or less had higher kappa in kidney disease, clotting disorders, and anemia and other blood disorders; while those with more than a high school education had a higher kappa in inflammatory bowel disease.
36 more education was associated with higher overall agreement for anemia and other blood
disorders (OR = 2.57, 95% CI = 1.24-5.33).
Across the 20 comorbid conditions assessed in this study, the number of conditions for which there was disagreement between the patient and the physician for each individual patient is shown in Table 5. Patients and physicians agreed on all conditions in 20% of cases. There were 1 or more disagreed conditions in 80% of cases, 2 or more in 48% of cases, 3 or more in 26% of cases, 4 or more in 13% of cases, and 5 or more in 6% of cases.
DISCUSSION
37 Accurate assessment of comorbidities is important because prostate cancer treatment decision making is directly affected by a patient’s baseline comorbidity status.1,2 In a 2006
population-based study from the Eindhoven Cancer Registry, patients with no comorbidities as scored using the Charlson Comorbidity Index underwent prostatectomy much more commonly than those with two or more comorbid conditions.23 Similar practice patterns are seen in the US, where younger and healthier patients commonly receive prostatectomy, while older and those with more comorbid conditions receive radiation therapy or conservative management.20
Comparative effectiveness research (CER) for localized prostate cancer treatment options (prostatectomy, radiation, active surveillance) is one of the highest priority research areas,10and because of the heavy patient selection into different treatment groups, must accurate account for a patient’s comorbid conditions in order to reach valid conclusions. Because a patient’s comorbid
conditions directly impact survival2 and health-related quality of life,11 two of the most important
outcomes in comparing localized prostate cancer treatment options,10 a better understanding of how to assess this information addresses one of the most important methodologic issues in CER and will help optimize quality of data versus cost of data collection.
38 study differs from this one in that we also assessed kappa statistics to determine if agreement seen is better than chance agreement alone. We also found another study conducted almost 20 years ago by Katz et al. in a sample of 170 hospitalized patients.12 For conditions studied which overlap with our study, kappa values are similar (within 0.20) for myocardial infarction,
congestive heart failure, peripheral vascular disease, cerebrovascular disease, chronic obstructive pulmonary disease, and peptic ulcer disease, while they differ by more than 0.20 for diabetes, kidney disease, and other cancers.12 However, the Katz study did not specifically include cancer
patients, and did not examine whether kappa differed by patient subgroups.12 Another study published in 1989 of 338 patients with chronic lymphocytic leukemia found kappa values for rheumatoid arthritis and arthritis otherwise unspecified to be 0.08 and 0.27, respectively.33 Our overall results are fairly consistent with these three prior studies.
Results from this study provide important information for CER investigators, and calls for further methodologic work to examine how to best account for patient comorbidities in comparative research. Importantly, we found low to moderate agreement in some important comorbid conditions, including congestive heart failure, peripheral vascular disease, chronic obstructive pulmonary disease, coronary artery disease, arrhythmia, and asthma. Further, we found lower agreement in several cardiovascular conditions especially in older patients, the patient subgroup most likely to be affected by these conditions.20 In this study, we obtained and abstracted medical records from the primary care physician and cancer specialists – because we felt these were the most relevant physicians for a prostate cancer patient, and that the primary care physician would be expected to know and document all of a patient’s medical conditions.
39 records from additional sources would increase agreement with patient-report, but it is also possible that some patients may report presence of certain medical conditions incorrectly. As NC ProCESS obtains longer-term follow-up in these patients, we will be able to assess whether patient-report, medical records, or both best predict patient survival and health-related quality of life outcomes.
Patient reported outcomes research suggests that there is discordance between patient and providers in assessing symptoms, side effects, and quality of life.34-38 Patients tend to report
symptoms earlier and more frequently than do physicians.35 In terms of quality of life
assessment, subjective domain measures result in less agreement between patients and clinicians than the more objective domain measures.37 Thematically, this fits in with results from our study, in that there are discrepancies between patient and physician reporting of comorbidities, and that patient reporting of comorbidities demonstrates presence of comorbidity more often than
physician report.
Data collection from physician sources comes from electronic medical records or
traditional paper records. Gathering data from paper charts may be more difficult and costlier to perform, as records typically need to be scanned or may be hard to read. However, the use of electronic medical records by office-based physicians has risen in the United States in the past decade.39 The implementation of internet-based personal health records (PHRs) will allow patients to access, add content, and share their medical records.40,41 While this may be limited by health literacy,42 future PHR usage may result in more accurate information regarding
40 This study contains multiple methodological strengths. The NC ProCESS cohort is large and population-based, and the rich diversity of enrolled patients allowed for subgroup analyses to examine agreement by age, race, educational attainment and other factors. Enrollment of patients from the community setting also provides information that is reflective and generalizable to “real world” prostate cancer patients and medical care. In addition, patient-reported comorbidity
information and medical records were both obtained prior to prostate cancer treatment, which avoids potential confounding from conditions developed due to treatment and its complications. On the other hand, our description of a meaningful difference in kappa among subgroups
(difference of ≥ 0.2) is arbitrary. In our literature search, we were unable to find any existing data
on what constitutes a meaningful difference in kappa values. As such, we defined a significant difference to be greater than 0.20 based on the 1977 Landis and Koch kappa classifications,21 but provide the actual values in Table 3 to allow the reader to make his/her own conclusions.
41
REFERENCES
1. Jani AB, Hellman S. Early prostate cancer: clinical decision-making. Lancet. 2003;361(9362):1045-1053.
2. Albertsen PC, Moore DF, Shih W, Lin Y, Li H, Lu-Yao GL. Impact of comorbidity on survival among men with localized prostate cancer. J Clin Oncol. 2011;29(10):1335-1341.
3. Siegel R, DeSantis C, Virgo K, et al. Cancer Treatment and Survivorship Statistics, 2012. Vol 62: CA: A Cancer Journal for Clinicians; 2012:220-241.
4. What are the key statistics about prostate cancer? 2013;
http://www.cancer.org/cancer/prostatecancer/detailedguide/prostate-cancer-key-statistics.
Accessed 4/5/2014, 2014.
5. Hall WH, Jani AB, Ryu JK, Narayan S, Vijayakumar S. The impact of age and comorbidity on survival outcomes and treatment patterns in prostate cancer. Prostate Cancer Prostatic Dis. 2005;8(1):22-30.
6. Lu-Yao GL, Albertsen P, Warren J, Yao SL. Effect of age and surgical approach on complications and short-term mortality after radical prostatectomy--a population-based study. Urology. 1999;54(2):301-307.
7. Harlan LC, Potosky A, Gilliland FD, et al. Factors associated with initial therapy for clinically localized prostate cancer: prostate cancer outcomes study. J Natl Cancer Inst. 2001;93(24):1864-1871.
42 9. Yu JB, Soulos PR, Herrin J, et al. Proton versus intensity-modulated radiotherapy for
prostate cancer: patterns of care and early toxicity. J Natl Cancer Inst. 2013;105(1):25-32.
10. IOM. IoM: Initial National Priorities for Comparative Effectiveness Research. Washington, DC: The National Academies Press; 2009.
11. Reeve BB, Chen RC, Moore DT, et al. Impact of Comorbidity on Health-Related Quality of Life after Prostate Cancer Treatment: Combined Analysis of Two Prospective Cohort Studies. BJU Int. 2014.
12. Katz JN, Chang LC, Sangha O, Fossel AH, Bates DW. Can comorbidity be measured by questionnaire rather than medical record review? Med Care. 1996;34(1):73-84.
13. Sinclair S, Hammond D, Goodman S. Sociodemographic differences in the comprehension of nutritional labels on food products. J Nutr Educ Behav. 2013;45(6):767-772.
14. Knesebeck O, Mnich E, Daubmann A, et al. Socioeconomic status and beliefs about depression, schizophrenia and eating disorders. Soc Psychiatry Psychiatr Epidemiol. 2013;48:775-782.
15. Charlson ME, Pompei P, Ales KL, MacKenzie CR. A new method of classifying prognostic comorbidity in longitudinal studies: development and validation. J Chronic Dis. 1987;40(5):373-383.
16. Extermann M. Measuring comorbidity in older cancer patients. Eur J Cancer. 2000;36(4):453-471.
43 18. Piccirillo JF, Tierney RM, Costas I, Grove L, Spitznagel EL. Prognostic importance of
comorbidity in a hospital-based cancer registry. JAMA. 2004;291(20):2441-2447. 19. Kaplan MH, Feinstein AR. The importance of classifying initial co-morbidity in
evaluating the outcome of diabetes mellitus. J Chronic Dis. 1974;27(7-8):387-404. 20. Chen RC, Royce TJ, Extermann M, Reeve BB. Impact of age and comorbidity on
treatment and outcomes in elderly cancer patients. Semin Radiat Oncol. 2012;22(4):265-271.
21. Landis JR, Koch GG. The measurement of observer agreement for categorical data. Biometrics. 1977;33(1):159-174.
22. NCCN Guidelines Prostate Cancer. NCCN; 2013.
23. Houterman S, Janssen-Heijnen ML, Hendrikx AJ, van den Berg HA, Coebergh JW. Impact of comorbidity on treatment and prognosis of prostate cancer patients: a population-based study. Crit Rev Oncol Hematol. 2006;58(1):60-67.
24. Klabunde CN, Reeve BB, Harlan LC, Davis WW, Potosky AL. Do patients consistently report comorbid conditions over time?: results from the prostate cancer outcomes study. Med Care. 2005;43(4):391-400.
25. Graff JN, Mori M, Li H, et al. Predictors of overall and cancer-free survival of patients with localized prostate cancer treated with primary androgen suppression therapy: results from the prostate cancer outcomes study. J Urol. 2007;177(4):1307-1312.
44 27. Thong MS, van de Poll-Franse L, Hoffman RM, et al. Diabetes mellitus and
health-related quality of life in prostate cancer: 5-year results from the Prostate Cancer Outcomes Study. BJU Int. 2011;107(8):1223-1231.
28. Yancik R, Havlik RJ, Wesley MN, et al. Cancer and comorbidity in older patients: a descriptive profile. Ann Epidemiol. 1996;6(5):399-412.
29. Coebergh JW, Janssen-Heijnen ML, Post PN, Razenberg PP. Serious co-morbidity among unselected cancer patients newly diagnosed in the southeastern part of The Netherlands in 1993-1996. J Clin Epidemiol. 1999;52(12):1131-1136.
30. Crawford ED, Grubb R, Black A, et al. Comorbidity and mortality results from a randomized prostate cancer screening trial. J Clin Oncol. 2011;29(4):355-361.
31. Houterman S, Janssen-Heijnen ML, Verheij CD, Kil PJ, van den Berg HA, Coebergh JW. Greater influence of age than co-morbidity on primary treatment and complications of prostate cancer patients: an in-depth population-based study. Prostate Cancer Prostatic Dis. 2006;9(2):179-184.
32. Post PN, Hansen BE, Kil PJ, Janssen-Heijnen ML, Coebergh JW. The independent prognostic value of comorbidity among men aged < 75 years with localized prostate cancer: a population-based study. BJU Int. 2001;87(9):821-826.
33. Linet MS, Harlow SD, McLaughlin JK, McCaffrey LD. A comparison of interview data and medical records for previous medical conditions and surgery. J Clin Epidemiol. 1989;42(12):1207-1213.
45 35. Basch E, Jia X, Heller G, et al. Adverse symptom event reporting by patients vs
clinicians: relationships with clinical outcomes. J Natl Cancer Inst. 2009;101(23):1624-1632.
36. Brunelli C, Kaasa S, Knudsen AK, Hjermstad MJ, Pigni A, Caraceni A. Comparisons of patient and physician assessment of pain-related domains in cancer pain classification: results from a large international multicenter study. J Pain. 2014;15(1):59-67.
37. Janse AJ, Gemke RJ, Uiterwaal CS, van der Tweel I, Kimpen JL, Sinnema G. Quality of life: patients and doctors don't always agree: a meta-analysis. J Clin Epidemiol.
2004;57(7):653-661.
38. Sneeuw KC, Sprangers MA, Aaronson NK. The role of health care providers and
significant others in evaluating the quality of life of patients with chronic disease. J Clin Epidemiol. 2002;55(11):1130-1143.
39. Hsiao C, Hing E, Socey TC, Cai B. Electronic medical record/electronic health record systems of office-based physicians: United States, 2009 and preliminary 2010 state estimates. National Center for Health Statistics; 2010.
40. Ahmed S, Berzon RA, Revicki DA, et al. The use of patient-reported outcomes (PRO) within comparative effectiveness research: implications for clinical practice and health care policy. Med Care. 2012;50(12):1060-1070.
41. Brennan PF, Downs S, Casper G, Kenron D. Project HealthDesign: stimulating the next generation of personal health records. AMIA Annu Symp Proc. 2007:70-74.
46
Table 1: Characteristics of patients in this study
Characteristic Number of Patients (N=881) %
Age, years (median: 65, range: 41-80)
<60 223 26
60-69 419 49
≥70 210 25
Race
White 633 72
Nonwhite 248 28
Marital Status
Married 710 81
No/unknown 171 19
Education
High school graduate or less 281 32
Some college or more 589 67
Unknown 11 1
Income
≤$40,000 322 37
>$40,000 522 59
Unknown 37 4
NCCN Risk Group
Low 458 52
Intermediate 327 37
High 94 11
47
Table 2: Comparison of patient vs. physician reporting of comorbid conditions
Comorbid Condition (AGREE) Patient No, Physician No N(%) (DISAGREE) Patient No, Physician Yes N(%) (DISAGREE) Patient Yes, Physician No N(%) (AGREE) Patient Yes, Physician Yes N(%) Overall Agreement (%) Kappa Myocardial Infarction
771 (89) 10 (1) 40 (5) 47 (5) 94 0.62
Congestive Heart Failure
821 (94) 6 (1) 29 (3) 14 (2) 96 0.43
Peripheral Vascular Disease
821 (94) 17 (2) 21 (2) 10 (1) 95 0.32
Cerebrovascular Disease
804 (93) 18 (2) 9 (1) 38 (4) 97 0.72
COPD 778 (90) 31 (4) 21 (2) 38 (4) 94 0.56
Peptic Ulcer Disease
773 (89) 17 (2) 65 (7) 15 (2) 91 0.23
Liver Disease 841 (97) 10 (1) 9 (1) 10 (1) 98 0.48
Diabetes 649 (75) 28 (3) 5 (1) 188 (22) 97 0.90
Kidney Disease 825 (95) 14 (2) 27 (3) 4 (<1) 95 0.14
Other Cancers 787 (91) 9 (1) 64 (7) 9 (1) 92 0.17
HIV / AIDS 865 (100) 0 (0) 0 (0) 4 (<1) 100 1.00
Coronary Artery Disease
723 (83) 85 (10) 27 (3) 34 (4) 87 0.31
Arrhythmia 716 (82) 17 (2) 98 (11) 39 (4) 86 0.34
Clotting Disorders
834 (96) 4 (<1) 21 (2) 10 (1) 97 0.43
Hypertension 279 (32) 72 (8) 61 (7) 457 (53) 85 0.68
Hyperlipidemia 281 (32) 107 (12) 172 (20) 309 (36) 68 0.36
Inflammatory Bowel Disease
848 (97) 3 (<1) 11 (1) 7 (1) 98 0.49
Asthma 780 (90) 3 (<1) 63 (7) 24 (3) 93 0.39
Anemia/Blood Disorders
806 (93) 8 (1) 48 (6) 7 (1) 94 0.18
Arthritis 519 (60) 14 (2) 288 (33) 48 (6) 66 0.14
48
Table 3: Agreement (kappa) of comorbid conditions based on patient characteristics*
Comorbid Condition
Age Race Marital Status Education Income NCCN risk group
<60 (N=223) 60-69 (N=419) ≥70 (N=210) White (N=633) Nonwhite (N=248) Married (N=710) Other (N=171) ≤HS (N=281) >HS (N=589) ≤$40k (N=322) >$40k (N=522) Low (N=458) Intermediate (N=327) High (N=94) Myocardial Infarction
0.65 0.66 0.53 0.61 0.68 0.63 0.59 0.65 0.61 0.62 0.64 0.69 0.46 0.79
Congestive Heart Failure
0.59 0.37 0.48 0.28 0.62 0.31 0.58 0.63 0.27 0.51 0.27 0.44 0.41 1.00
Peripheral Vascular Disease
0.21 0.20 0.50 0.34 0.26 0.32 0.32 0.23 0.38 0.14 0.42 0.26 0.38 0.38
Cerebrovascular Disease
0.94 0.69 0.67 0.70 0.75 0.71 0.73 0.70 0.74 0.68 0.79 0.75 0.66 0.78
COPD 0.52 0.54 0.60 0.61 0.40 0.57 0.52 0.62 0.49 0.57 0.50 0.57 0.61 0.39
PUD 0.25 0.21 0.26 0.20 0.32 0.19 0.37 0.34 0.16 0.33 0.15 0.21 0.24 0.27
Liver Disease 0.53 0.41 0.49 0.57 0.24 0.43 0.65 0.49 0.51 0.71 0.44 0.55 0.49 0.38
Diabetes 0.90 0.90 0.89 0.89 0.91 0.90 0.89 0.89 0.90 0.91 0.88 0.92 0.88 0.84
Kidney Disease 0.00 0.21 0.08 0.09 0.15 0.15 0.12 0.25 -0.01 0.19 0.08 0.22 0.08 -0.02
Other Cancers 0.09 0.19 0.19 0.20 -0.02 0.14 0.27 0.16 0.17 0.06 0.21 0.15 0.19 0.32
HIV / AIDS 1.00 1.00 1.00 1.00 1.00 1.00 1.00 1.00 1.00 1.00 1.00 1.00 1.00 1.00
Coronary Artery Disease
0.38 0.34 0.22 0.37 0.14 0.34 0.18 0.23 0.35 0.35 0.29 0.28 0.34 0.38
Arrhythmia 0.31 0.44 0.19 0.36 0.28 0.37 0.26 0.37 0.33 0.23 0.41 0.32 0.37 0.42
Clotting Disorders
0.60 0.24 0.41 0.36 0.60 0.47 0.31 0.59 0.31 0.56 0.38 0.30 0.61 0.55
Hypertension 0.75 0.67 0.63 0.69 0.64 0.70 0.58 0.63 0.70 0.62 0.72 0.66 0.69 0.74
Hyperlipidemia 0.45 0.34 0.31 0.32 0.46 0.35 0.41 0.41 0.34 0.36 0.37 0.30 0.40 0.52
Inflammatory Bowel Disease
0.40 0.70 -0.01 0.45 1.00 0.51 0.39 -0.01 0.60 0.49 0.49 0.42 0.49 0.66
Asthma 0.48 0.38 0.37 0.35 0.50 0.39 0.39 0.47 0.35 0.46 0.31 0.26 0.48 0.71
Anemia/Blood Disorders
0.11 0.12 0.38 0.21 0.08 0.20 0.11 0.34 0.13 0.13 0.24 0.16 0.19 0.20
Arthritis 0.20 0.11 0.13 0.11 0.20 0.12 0.20 0.14 0.14 0.12 0.17 0.12 0.13 0.26
*A kappa difference of ≥ 0.2 among subgroups is highlighted