Sharif University of Technology
Scientia IranicaTransactions A: Civil Engineering http://scientiairanica.sharif.edu
Performance evaluation of RC beam-column joints with
dierent bonding interfaces
W. Jung
a, J. Kim
b, and M. Kwon
c;a. Department of Civil Engineering, Gangneung-Wonju National University, Gangneung, 25457, South Korea. b. Department of Civil Engineering, University of Texas at Arlington, Arlington, TX 76019, USA.
c. Department of Civil Engineering, ERI, Gyeongsang National University, Jinju, 52828, South Korea. Received 24 January 2015; received in revised form 22 February 2016; accepted 1 October 2016
KEYWORDS RC beam-column joint;
Non-linear analysis; Un-bonded rebar; Seismic performance.
Abstract.Reinforced Concrete (RC) structures located on ocean coasts are damaged by salt water, leading to concrete deterioration. Due to this deterioration of the concrete, the metal rebar inside starts to corrode, because there is no longer concrete around it to prevent exposure to the outside environment. Such corrosion causes serious degradation of the cohesion between the steel and the concrete, and the performance capacity of the bonding between concrete and rebar. In this study, the performance of RC beam-column joints was evaluated. The interface between concrete and reinforcing bars in the RC beam-column joint specimens was partially un-bonded to simulate corrosion. The mechanical behavior and energy dissipation capacity of un-bonded RC beam-column joints were evaluated by experiment. Numerical studies were also performed with the help of nite element methods. Results from the experimental tests and numerical studies of RC beam-column joints at bonded and un-bonded interfaces between concrete and reinforcing bars are compared and discussed in terms of energy dissipation capacity, strength, and crack distribution. © 2018 Sharif University of Technology. All rights reserved.
1. Introduction
Several earthquakes have occurred recently near the seashore of Japan that caused devastating damage to nuclear power plants. Consequently, the amount of radiation leaked to the Fukushima region has been substantial. It has also been observed that many secondary earthquakes usually follow major seismic events. With this in mind, much interest has been focused on the strengthening of existing structures to reduce future seismic damage in Korea, which is located close to Japan.
*. Corresponding author. Tel.: +82 55 772 1796; Fax: +82 55 772 1799
E-mail addresses: [email protected] (W. Jung); [email protected] (J. Kim); [email protected] (M. Kwon)
doi: 10.24200/sci.2017.4175
Nuclear Power Plants (NPPs) must be located near water sources (e.g., the seaside) because they require substantial amounts of cooling. For that reason, in the case of Japan, tsunamis, a secondary eect of earthquakes, can damage NPP structures, which can remind others of the dangers of nuclear energy, making it a global issue. Such earthquakes and tsunamis put the structures made of reinforced concrete at a great risk. Reinforced concrete structures exposed to salt water for a long time can deteriorate, especially if they are older structures. Due to this deterioration, the alkali components in the concrete are neutralized. This means that the concrete has lost its ability to prevent corrosion and when the deterioration progresses to the concrete surrounding the rebar, the rebar starts to corrode. Such corrosion seriously degrades the cohesion between the steel and the concrete, thereby compromising the safety of the structure. In particular, the beam-column joints of
reinforced concrete play important roles in the safety of reinforced concrete structures.
The rst research conducted on RC beam-column joints focused on the settlement of the main bar of a beam and the energy loss due to shear resistance and reinforcement of a joint [1]. Since then, many researchers have carried out studies on this topic, including those dealing with the eects of transverse and longitudinal rebar, the validity of the connement and cover thickness [2,3], and the eect of anchorage length on the hysteretic behavior of joints due to the reduction in bonding strength. Recently, research has been conducted on a variety of issues related to evaluation of the seismic performance of joints. Most of them are experimental studies on the performance capacity of beam-column joints. Clyde et al. [4] and Pantelides et al. [5] performed cyclic tests on exterior beam-column joints with an axial load. In their research, the joints were designed in such a way as to have joint shear failures before the yielding of the beam bars. The longitudinal and transverse reinforcement in the beam, and the column transverse reinforcement, were increased to prevent early degradation of the beam and column, forcing a shear mode of failure in the joint. Murty et al. [6] performed cyclic tests with various anchorages of beam bars and dierent types of joint reinforcement. Hwang et al. [7] performed tests on exterior joints having dierent reinforcement details. Their studies were aimed at obtaining elementary data on the RC beam-column joints of reinforced concrete subjected to loss of cohesion between the steel and concrete due to serious corrosion.
Meanwhile, researchers have attempted to model the behavior of RC beam-column joints using various approaches that include lumped plasticity models [8], multi-spring models [9-13], and empirical models [14-16] based on experimental results [17]. Lowes et al. [18] attempted to model the interface-shear based on exper-imental data from which they predicted the sti elastic response of the interface-shear. The experimental data for validation included specimens with a minimal amount of transverse reinforcement in the panel zone, which is consistent with the intended use of the model. Because joints without transverse reinforcement were excluded from the study, the model is not suitable for analysis of joints with transverse reinforcement.
Altoontash [19] simplied the model proposed by Lowes and Altoontash [18] by introducing four zero-length rotational springs located at beam-column joint interfaces. The rotational springs simulated the member-end rotations due to bond-slip behavior and the panel zone component with a rotational spring simulated the shear deformation of the joint. The development length was assumed to be adequate to prevent complete pullout.
Though many experimental and analytical studies
on RC beam-column joints have been conducted thus far, they rest upon the assumption that the rebar and concrete are perfectly bonded, which is not realistic. As a result, current performance analysis does not take severe steel corrosion and concrete carbonation of the RC members into account. This study was focused on evaluation of the performance of RC beam-column joints with partially un-bonded reinforcement in the beam area. Rubber tubes were installed over the rebar to simulate the loss of adhesive capacity. Both the cyclic behavior and seismic performance of the RC beam-column joints were evaluated under lateral cyclic loading, considering the characteristics of rebar-concrete bonded and un-bonded behaviors. To simulate un-bonded behavior of the reinforcement bar indirectly using nite element analysis, the yield strength and elastic modulus of the rebar were adjusted based on the experimental results and ber section analysis.
2. Experimental program 2.1. Test specimens
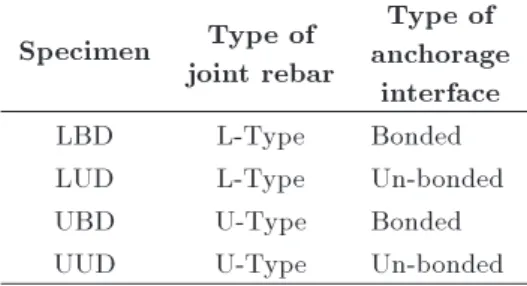
Experimental tests were done to evaluate the seismic performance of beam-column joints that had lost bond strength between the concrete and reinforcing bars due to the corrosion of the bars. The RC beam-column joints of the test specimens were scaled down to one-third of a standard reinforced concrete frame. The specimens were designed and constructed according to the building code requirements proposed by the ACI Committee (318-95) [20]. The cross-sectional area of the column and the beam was 200 200 mm as shown in Figure 1. The anchorage type and length of the tensile steel are depicted in Figure 1. The anchorage types were used as one of the parameters in this study. The anchorage type aects the destruction of the beam-column joints [21]. As shown in Figure 2(b) and (d), thin rubber tubes were installed over the main rebar to simulate un-bonding between the concrete and the rebar. Four specimens were put into two groups, one having L-type rebar and the other having U-type rebar. Each group had two types of bonded and un-bonded interfaces between the rebar and concrete (Table 1).
Table 1. Test specimens. Specimen Type of
joint rebar
Type of anchorage
interface
LBD L-Type Bonded
LUD L-Type Un-bonded
UBD U-Type Bonded
Figure 1. Dimensions of beam-column joint.
2.2. Material properties
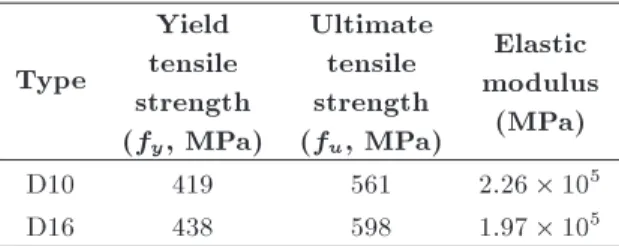
Deformed rebar with yield strength of 400 MPa was used. D16 (Diameter 16 mm) was used as the main rebar while D10 was used as the hoop stirrup. In order to measure the properties of the rebar, three specimens were tested according to ASTM-A370. The results are shown in Table 2.
The concrete was designed to have compressive strength of 21 MPa, with 25 mm maximum aggregate size and 120 mm slump. To determine the compressive strength of the concrete, three specimens were tested on
Figure 2. State of the joint rebar.
Table 2. Properties of the rebar.
Type
Yield tensile strength (fy, MPa)
Ultimate tensile strength (fu, MPa)
Elastic modulus
(MPa)
D10 419 561 2:26 105
D16 438 598 1:97 105
the same day of the experiments according to ASTM-C39. The test results for the compressive strength of the concrete are summarized in Table 3.
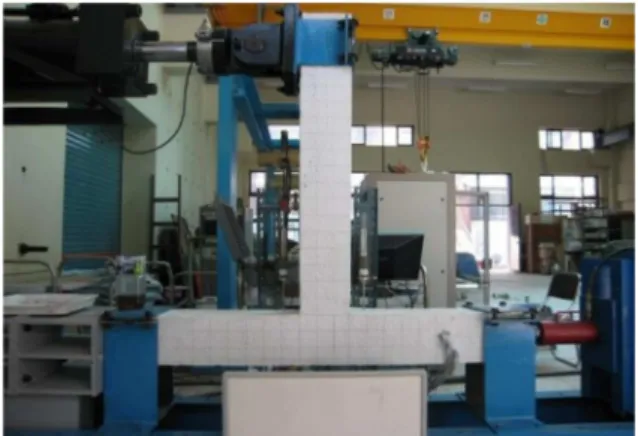
2.3. Test setup
A steel-frame was fabricated as shown in Figure 3 for testing the beam-column joint. The test specimen was set up with various experimental data acquisition devices, as shown in Figures 3 and 4. Due to constraints in the experimental environment, the column was set up to horizontal direction and axial force was exerted on the end of the column. At the initial stages, the column of the beam-column joint was set up horizontally with respect to the basic frame. Then, a reaction frame was set up on one side and an oil jack with a capacity of 200 kN was placed on the other side later, in order to apply a constant axial load. A constant axial load of 84 kN (corresponding to
Table 3. Properties of the concrete. Design
strength (MPa)
Test results Compressive
strength (MPa)
Elastic modulus
(MPa)
Figure 3. Test setup of RC beam-column joint.
Figure 4. Photo of RC beam-column joint test setup.
approximately 0:1 Ag fck) was generated through
oil jacks.
An actuator of 500-kN capacity was installed in the reaction wall to perform a cycle loading test on the beam-column joint. A steel cap was used to x the actuator and the end of the specimen beam. The actuator applied displacement loads following a loading history created using a displacement ductility factor. This was derived based on the determined yield displacement obtained using a monotonic test of specimen STD.
The loading history curve is plotted as the dis-placement ductility factor in Figure 5.
2.4. Experimental results and discussion 2.4.1. Distribution of cracks
The crack pattern in each test specimen, with respect to the displacement ductility factor, is shown in Fig-ure 6. For the specimen LBD, exural cracks occurred at the interface of the beam-column joint when the displacement ductility factor was = 1 (2nd cycle). Shear cracks occurred at the interface of the beam-column joint starting with a displacement ductility factor of = 2 (4th cycle) and continued until = 4 (8th cycle). The progression of shear cracks near the joint slowed down, while the range of exural cracks increased at the interface of the joint until reaching the nal loading stage ( = 6, 10th cycle). For
Figure 5. Loading protocol of RC beam-column joint.
Figure 6. Crack distribution of RC joint at nal loading.
the specimen LUD, exural cracks rst developed at the interface of the beam and column starting at the displacement ductility factor of = 1 (2nd cycle). However, cracks did not propagate to the joint when the displacement ductility factor ranged from = 2 (4th cycle) to = 6 (10th cycle), but the width of the exural cracks at the boundary surfaces of the beam-column grew gradually.
For the specimen UBD, exural cracks started to be developed at the interface of the beam-column joints when the displacement ductility factor was = 1 (2nd cycle). Shear cracks at the interface of the beam-column spread to the joint at = 2 (4th cycle). After that, shear cracks propagated into the column at the end of the test and the width of the exural cracks increased. For the specimen UUD, cracks in the U-type un-bonded specimen did not spread to the joint until the nal load stage, but wide exural cracks were opened at the interface.
Both shear and exural cracks developed in the bonded specimens, while only exural cracks developed in the un-bonded ones. This was mainly because the
transfer of stress between the concrete and rebar did not take place in the un-bonded joints.
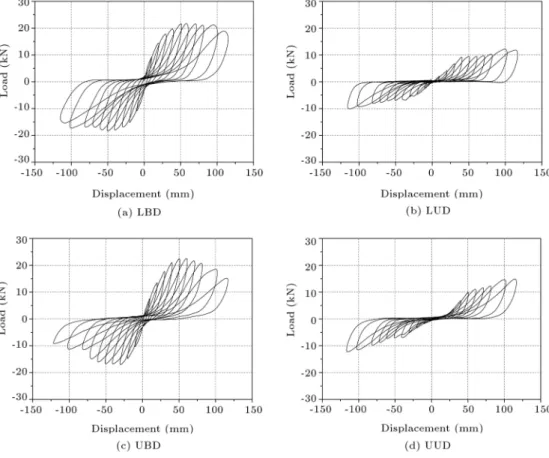
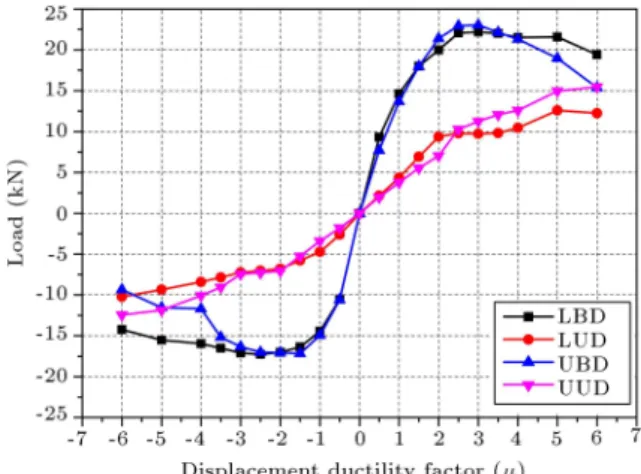
2.4.2. Load-displacement relation
Figure 7 shows the relation between the lateral load and displacement of beam-column joints. For the specimen LBD, maximum load was 22.2 kN and displacement at maximum load was 58.3 mm. This indicates ductile behavior. When the displacement exceeded 105 mm, the lateral load decreased steadily due to yielding of the longitudinal reinforcement. For the specimen LUD, the maximum load was 12.6 kN and displacement at maximum load was 101.0 mm. The load increased until the displacement reached 39.8 mm. The initial yielding of the rebar occurred at 8.8 kN of lateral load. For the specimen UBD, the maximum load was 23.0 kN and the corresponding displacement was 61.4 mm. After the peak load, the strength decreased and the number of shear cracks increased. For the specimen UUD, the maximum load was 15.5 kN and the corresponding displacement was 115.6 mm. The initial yield of the rebar occurred at 11.3 kN. The strength decreased after the peak load.
In order to compare the experimental results obtained with each specimen, LBD and UBD were set as reference specimens. Comparisons of these with other specimens (such as LUD and UUD) with
respect to strength in the forward direction (+) and displacement are summarized in Table 4.
The maximum load for specimen LUD decreased to 56.7% of that for LBD, while the displacement at maximum strength increased by about 173.3%. The maximum load for specimen UUD decreased to 67.1% of that for UBD, while the displacement at maximum strength increased by about 188.3%.
The results of tests of the strength and displace-ment of the L- and U-type specimens indicate that the maximum strength of the un-bonded beam-column joint decreased, and that the displacement at peak strength increased due to slip that occurred in the joint. Moreover, U-type specimens exhibited less strength and greater deformation at the peak than the L-type specimens did.
2.4.3. Strain of the beam in the plastic hinge region The strain of the rebar was measured with strain gauges installed in the rebar at the interface of the beam and column, where the exural cracks were expected to occur. The data are presented in Figure 8, which shows the peak strain of the rebar in each cycle. In the case of the specimen LBD, the peak strength reached the 3rd cycle in the loading history and the strain of the rebar at the interface was 0.002650. In the case of specimen LUD, although the applied load increased up to the 5th cycle, the strain
Table 4. Summary of experimental results.
Specimens
Failure type of joint
Maximum strength Strains of the beam in the hinge region
Total energy dissipation Load
(kN)
Displacement (mm)
Cycle
(peak) Strain
capacity (kN.m)
LBD Shear, exural 22.195 58.303 3rd 0.00265 7.595
LUD Flexural 12.596 101.031 5th 0.000461 4.529
UBD Shear, plastic 23.027 61.379 3rd 0.00166 6.905
UUD Plastic 15.458 115.586 5th 0.000367 5.556
Figure 8. Strain of longitudinal rebar.
at peak strength was 0.000461, which was smaller than that of specimen type LBD. The U-type bonded speci-men, UBD, reached peak strength when the strain was measured as 0.001160 at the 3rd cycle in the loading protocol. In the case of the un-bonded specimen UUD, even though the applied load increased up to the 5th cycle, the strain at peak strength was measured as 0.000367, which was lower than that of specimen type UBD. The strain of the rebar in the plastic hinge region of the specimens is summarized in Table 4.
In Table 4, the strain on the rebar of the bonded specimen increased greatly around the exural cracks, even at earlier loading cycles. In contrast, the tensile stress of the rebar in the un-bonded specimen decreased due to the lack of bonding between the concrete and rebar. The strain of the un-bonded specimen, there-fore, did not increase signicantly even with increases in the load and displacement. Also, the initial strain in the U-type specimen was less than that in the L-type specimen. Based on the analysis of strain at the yield point, the adhesive performance of the rebar and concrete seemed to be more eective in the L-type than in the U-type.
2.4.4. Energy dissipation capacity
Energy dissipation capacity is the energy absorbed by the structural members while they maintain their strength. The resistance to external forces by deform-ing of the structural members by cyclic load can be
measured using the capacity of energy dissipation of the specimen.
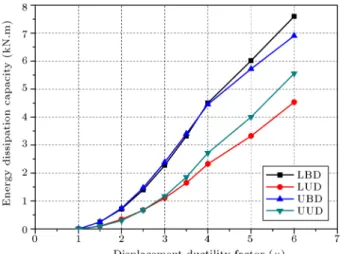
Before deriving the energy dissipation capacity, a strength history curve against the displacement ductility factor for each of the specimens was drawn. Based on the curves shown in Figure 9, the energy dissi-pation capacity and the accumulated energy dissidissi-pation capacity are computed and presented in Figures 10 and 11.
The energy dissipation capacity of all the speci-mens increased in each cycle up to the displacement
Figure 9. Strength history curve of the beam-column joints.
Figure 10. Energy dissipation capacity at displacement ductility factor.
Figure 11. Accumulated energy dissipation capacity at displacement ductility factor.
ductility factor of = 5. In specimen UBD, how-ever, the energy dissipation capacity decreased for the nal displacement ductility factor. Specimen LBD accumulated 7.595 kN.m of energy dissipation until it reached the maximum displacement ductility factor, while the LUB specimen accumulated only 4.529 kN.m. The UBD specimen accumulated 6.905 kN.m of energy dissipation until it reached the maximum displacement ductility factor, while the UUD specimen accumulated 5.556 kN.m. The energy dissipation capacities of the specimens are summarized in Table 4.
The bonded specimens showed greater strength and less yield displacement than the un-bonded speci-mens did. The energy dissipation capacities of the un-bonded specimens were approximately 40% and 20% less for the L-type and U-type specimens, respectively, than for bonded specimens. This was caused by the decreased strength and increased deformation that occurred in the un-bonded specimens.
3. Numerical study
3.1. Modeling of un-bonded states
The bonded and un-bonded beam-column joints were analyzed using a nite element method to evaluate the test results. For the analysis, two dierent nite element models were proposed to consider the bonding characteristics between concrete and rebar. One model of an un-bonded specimen assumed that the stress of the concrete did not transfer to the rebar at the interface of the concrete and rebar. Such a model includes the slip of rebar during tension failure of an RC member, and therefore reduces the stress exerted on the rebar. The material properties of the rebar were derived with the assumption that the rebar elastic modulus did not aect the composite section because it was not bonded with the concrete. Therefore, the material properties of the rebar were estimated
from the load-displacement relation of the experimental result with the un-bonded specimens.
Nonlinear ber sections analysis was used to derive the properties of the un-bonded rebar in the RC members. Based on the ber model, nonlinear ber sections analysis considered the interaction between axial force and moment by decomposing the RC section into multiple layers.
Through the ber sections analysis, the moment and curvature of the beam structure were calculated. The elastic modulus and strength of the un-bonded rebar were derived from the calculations. The material properties used for the numerical analysis are shown in Table 5.
3.2. Numerical analysis 3.2.1. Numerical modeling
The ABAQUS [22] program was used for numerical analysis. The load-displacement relationship and ex-perimental results of the cracks of the specimens were compared. The specimen used in the experiment was modeled, as shown in Figure 12. The concrete was discretized as a 20-node solid element with reduced integration technique. Also, a damaged plasticity concrete model was used as the constitutive model of concrete [23]. The rebar was discretized as truss elements and embedded into the solid elements. The plasticity model was used as the constitutive law of the rebar. More detailed description of the numerical modeling is given elsewhere [24,25]. The concrete compression strength and elastic modulus from the material properties tests were applied to the properties of both the bonded and un-bonded specimens. The un-bonded rebar region (ld, 850 mm) is indicated in
Figure 12.
The properties of Table 2 were applied to the bonded rebar, the properties of Table 3 were applied to concrete, and the properties of Table 5 were applied to un-bonded rebar in the analysis.
The displacement load was applied to the top part of the beam. The degree of freedom was xed except in the axial direction to consider the boundary condition of the column under the experimental conditions. Hence, one side of the two-faced column was xed, while the axial force of 84 kN was applied on the other side.
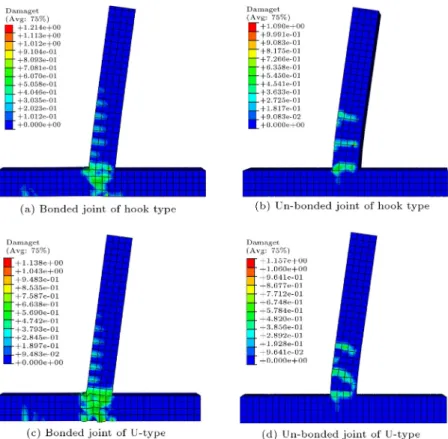
3.2.2. Numerical results
The rebar stress and distribution of the cracks in the concrete are shown in Figures 13 and 14. For both bonded and un-bonded specimens, the rebar around the joint reached the yield stress rst. The rebar stress on the axial columns was greater in the un-bonded specimen than in the bonded one, and both types of specimens showed exural fractures.
Fig-Table 5. Un-bonded rebar properties based on section analysis. Un-bonded
section (ld)
Yield tensile strength (fy, MPa)
Ultimate tensile strength (fu, MPa)
Modulus (MPa)
D16 L-Type 180 250 3:70 105
U-Type 260 380 5:60 105
Figure 12. Finite element modeling.
ure 14 shows that both exural and shear cracks were distributed in the region of the beam-column joint for the bonded specimens, while a relatively larger number of exural cracks was found there in the un-bonded specimens. The distribution of concrete cracks of each of the specimens was similar in the cycle loading test. Also, larger shear cracks were seen in the bonded U-type specimens than in the L-type specimens. This shows that the L-L-type specimen
delayed the development of shear cracks more than the U-type specimens did.
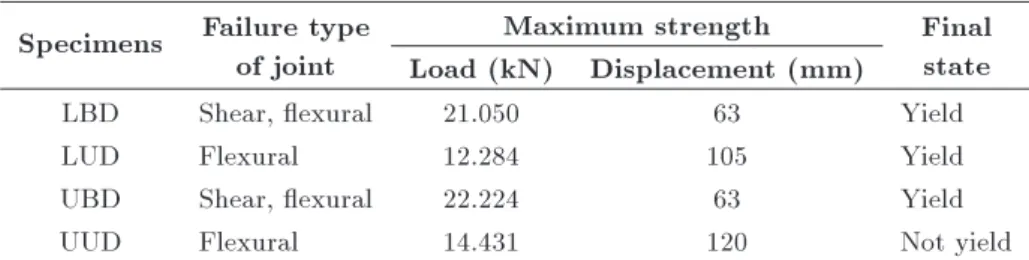
Figure 15 compares the numerical results by ABAQUS and the experimental results for the relation between the load and displacement. The numerical and experimental load-displacement relations of the speci-mens were similar. Comparison of the numerical results and experimental results is summarized in Table 6. The numerical results for the bonded specimens (at the
Figure 14. Concrete crack distribution results.
beam-column joint) were that exural failures occurred rst, followed by shear failures, whereas only exural failures occurred for the un-bonded specimens. Shear cracks for the U-type were wider than for the L-type.
Due to its shape, the L-type seemed to slow down the progress of shear cracks. The failure patterns seen in both the numerical and experiments were very similar in both U-type and L-type specimens.
Table 6. Summary of analytical results. Specimens Failure type
of joint
Maximum strength Final
state Load (kN) Displacement (mm)
LBD Shear, exural 21.050 63 Yield
LUD Flexural 12.284 105 Yield
UBD Shear, exural 22.224 63 Yield
UUD Flexural 14.431 120 Not yield
Even the overall behavior of the joints was well predicted by the numerical analysis, but the initial stage of the un-bonded specimen showed some discrep-ancy in numerical results.
The average stress on the rebar where shear cracks occurred was greater in the bonded specimen than in the un-bonded specimen. This could be due to the activity of the beam rebar in the un-bonded specimen, which reduces the strength transferred to the joint, stopping the progress of shear cracks.
4. Conclusions
In this research, the mechanical behavior and energy dissipation capacity of bonded and un-bonded beam-column joints were evaluated. Both experimental and numerical studies were conducted. The conclusions derived from this study are as follows:
1. The experiment results show that when L-type and U-type beam-column joints were un-bonded, the maximum strength decreased while the yield displacement increased. The strength decreased due to activity between the rebar and concrete caused by non-bonding, but the ductility increased. The bonded specimens showed both exural and shear cracks, but the un-bonded specimens showed exural cracks only;
2. The energy dissipation decreased by 60% in the L-type and by 80% in the U-type when results from un-bonded and bonded joints were compared. Contrary to the increase in ductility, the strength decreased, which resulted in a lower energy dis-sipation capacity in the case of un-bonded joints. From the accumulated energy dissipation from the cycle loading test results, it was found that the yield displacement increased due to the un-bonded rebar, but the energy dissipation did not increase due to a signicant reduction in strength;
3. The numerical analysis result for the un-bonded beam-column joint showed a dierence in initial stiness compared to the experimental results. However, as the displacement increased, the loading hysteresis, maximum strength, and yield displace-ment were very well predicted.
Acknowledgement
This work was supported by the National Research Foundation of Korea (NRF) grant funded by the Korea government (MEST) (No. 2012-0008762).
References
1. Hanson, N.W. and Conner, H.W. \Seismic resistance of reinforced concrete beam-column joint", ACI Struc-tural Journal, 7, pp. 533-560 (1967).
2. Megget, L.M. and Park, R. \Reinforced concrete exterior beam-column joints under seismic loading", New Zealand Engineering, 26, pp. 341-353 (1971).
3. Uzumeri, S.M. and Seckin, M. \Behaviour of reinforced concrete beam-column joints subjected to slow load reversals", Report No. 74-05, Department of Civil Engineering, University of Toronto, Toronto, Ontario, Canada (1974).
4. Clyde, C., Pantelides, C.P. and Reaveley, L.D. \Per-formance-based evaluation of exterior reinforced con-crete building joints for seismic excitation", Report PEER 2000/05, Pacic Earthquake Engineering Re-search Center (2000).
5. Pantelides, C.P., Hansen, J., Nadauld, J. and Reave-ley, L.D. \Assessment of reinforced concrete building exterior joints with substandard details", Report no. PEER 2002/18. Pacic Earthquake Engineering Re-search Center (2002).
6. Murty, C.V.R., Rai, D., Bajpai, K.K. and Jain, S.K. \Eectiveness of reinforcement details in exterior reinforced concrete beam-column joints for earthquake resistance", ACI Structural Journal, 100(2), pp. 149-156 (2003).
7. Hwang, S.H., Lee, H.J., Liao, T.F., Wang, K.C. and Tsai, H.H. \Role of hoops on shear strength of rein-forced concrete beam-column joints", ACI Structural Journal, 102(3), pp. 445-453 (2005).
8. Otani, S. \Inelastic analysis of RC frame structures", Journal of the Structural Division, ASCE, 100(ST7), pp. 1433-1449 (1974).
9. Filippou, F., Popov, C., Egor, P. and Bertero, Vitelmo V., Eects of Bond Deterioration on Hysteretic Be-havior of Reinforced Concrete Joints, Earthquake Engineering Research Center, University of California, Berkeley (1983).
10. Filippou, F.C. and Issa, A. \Nonlinear analysis of reinforced concrete frames under cyclic load reversals", EERC report UCB/EERC-88/12 (1988).
11. El-Metwally, S.E. and Chen, W.F. \Moment-rotation modeling of reinforced concrete beam-column connec-tions", ACI Structural Journal, 85(4), pp. 384-94 (1988).
12. Alath, S. and Kunnath, S.K. \Modeling inelastic shear deformations in RC beam-column joints", Engineering Mechanics Proceedings of 10th Conference, May 21-24, University of Colorado at Boulder, Boulder, Colorado, 2, New York, ASCE, pp. 822-5 (1995).
13. Biddah, A. and Ghobarah, A. \Modelling of shear de-formation and bond slip in reinforced concrete joints", Structure Engineering and Mechanics, 7(4), pp. 413-432 (1999).
14. Elmorsi, M., Kianoush, M.R. and Tso, W.K. \Mod-eling bond-slip deformations in reinforced concrete beam-column joints", Canadian Journal of Civil En-gineering, 27, pp. 490-505 (2000).
15. Youssef, M. and Ghobarah, A. \Modelling of RC beam-column joints and structural walls", Journal of Earthquake Engineering, 5(1), pp. 93-111 (2001).
16. Spacone, E., Filippou, F.C. and Taucer, F.F. \Fibre beam-column model for non-linear analysis of R/C frames: Part I. formulation", Earthq. Eng. Struct. Dyn., 25(7), pp. 711-725 (1996).
17. Sharma, A., Eligehausen, R. and Reddy, G.R. \A new model to simulate joint shear behavior of poorly detailed beam-column connections in RC structures under seismic loads, Part I: Exterior joints", Engineer-ing Structures, 33, pp. 1034-1051 (2011).
18. Lowes, L.N. and Altoontash, A. \Modeling reinforced-concrete beam-column joints subjected to cyclic loading", Journal of Structural Engineering, ASCE, 129(12) pp. 1686-1697 (2003).
19. Altoontash, A. \Simulation and damage models for performance assessment of reinforced concrete beam-column joints", Ph.D. Dissertation, Stanford (CA): Department of Civil and Environment Engineering. Stanford University (2004).
20. American Concrete Institute (ACI-318) Building Code Requirements for Reinforced Concrete, Farmington Hills, MI (2011).
21. Pampanin, S., Calvi, G.M. and Moratti, M. \Seismic behaviour of RC beam-column joints designed for gravity loads", 12th ECEE, London, paper no. 726 (2002).
22. Dassault Systems Simulia Corp, Abaqus Analysis User's Manual, Version 6.11-1 (2011).
23. Lee, J. and Fenvas, G.L. \Plastic-damaged model for cyclic loading of concrete structures", Journal of Engineering Mechanics, 124, pp. 892-900 (1998).
24. Kwon, M.H., Shing, P.B., Mallare, C. and Restrepo, J. \Seismic resistance of RC bent caps in elevated mass transit structures", Earthquake Spectra, 27(1), pp. 67-88 (2011).
25. Kim, J.S., Kwon, M.H., Jung, W.Y. and Limkatanyu, S. \Seismic performance evaluation of RC columns reinforced by GFRP composite sheets with clip con-nectors", Construction and Building Materials, 43, pp. 563-574 (2013).
Biographies
WooYoung Jung is a Professor of Structural En-gineering in the Department of Civil EnEn-gineering at Gangneung-Wonju National University, Gangneung, South Korea. His research interests are seismic reha-bilitation for RC and steel structures by using Fiber Reinforcing Polymer (FRP), earthquake resisting de-sign and seismic fragility assessment, and experimental research on existing structures under severe loads. He has conducted many research projects with government and industry and is a member of Korean Society of Civil Engineers.
Jinsup Kim is an Assistant Professor of Structural Engineering in the Department of Civil Engineering at Gyeongsang National University, Jinju, South Korea. His research interests include the seismic analysis, design, and retrotting of RC and steel structures using Fiber-Reinforced Polymer (FRP), Ultra-High Performance Fiber Reinforced Concrete (UHPFRC), earthquake engineering, and FE analysis.
Minho Kwon is a Professor of Structural Engineering in the Department of Civil Engineering at Gyeongsang National University, Jinju, South Korea. His main research interests are nite element modeling for RC and steel structures, aircraft crash analysis, earthquake resisting design, constitutive modeling, and experiment of RC structures under severe loads. He has conducted many research projects with government and industry and is a member of American Society of Civil Engineers and Korean Society of Civil Engineers.