Abstract
Katherine Reinberger
Diet and Health in the North Carolina Piedmont
This study uses the dental and cranial skeletal remains of populations interred in the
North Carolina Piedmont, including those from the archaeological sites of Town Creek, Forbush
Creek, Early Upper Saratown (Hairston), Wall, Fredricks, and Upper Saratown, to present the
frequencies of dental and cranial pathologies in the context of the cultural and biological setting
of the North Carolina piedmont in order to assess how agriculture and European contact
influenced nutrition and overall health. The collection samples range from A.D. 700-1710, a
period that encompasses a series of dietary transformations that include the increased
incorporation of maize into the diet, and after the arrival of Europeans into the area, a change in
diet associated with increased mobility.
The study’s purpose was to look at what dental and skeletal cranial markers can tell us
about diet and overall health. Data were collected by observing the presence and number of
carious lesions, alveolar infection, premortem tooth loss, and dental calculus. I also recorded
frequencies of porotic hyperostosis, cribra orbitalia and scurvy as additional evidence of diet and
health deficiencies. The results of this study suggest a decline in health during a period of time
when agriculture was the most dominant part of a subsistence economy, the middle period of my
sample that contains samples from A.D. 1450 to 1620, and a reduction in nutritional strain for
Acknowledgements
There is a small village of people who have made this thesis possible. I would like to
thank my advisor, Dr. Dale Hutchinson, for his constant support and guidance through this entire
process and throughout my career at the University of North Carolina at Chapel Hill. I would
also like to thank my thesis committee: Dr. R.P. Stephen Davis, Jr., Dr. Brett Riggs and Dr.
Amanda Thompson for their advice and technical assistance throughout the year. I would like to
thank the Research Laboratories of Archaeology at the University of North Carolina at Chapel
Hill and Dr. R.P. Stephen Davis, Jr. for allowing us to use their facilities to take photographs of
the samples. Many thanks to Lisa Portuondo and the University Campus Health Services
Radiology team for facilitating the radiograph production of the samples. Finally, I would like to
thank my family for continually pushing me forward; Nicole Welsh for her commiseration and
solidarity in late nights of writing; and the Michael P. and Jean W. Carter Research Fund for
Table of Contents
1. Diet and Health in Prehistoric and Early Historic United States………..1
2. North Carolina Piedmont Geographical and Cultural Context………6
Study Sample Background……….10
Town Creek Mound (31Mg2) and Village (31Mg3)……….10
Forbush Creek (31Yd1)……….12
Wall (31Or11)………13
Early Upper Saratown (31Sk1)………..14
Upper Saratown (31Sk1a)………..16
Fredricks (31Or231)………...17
Subsistence Studies in the North Carolina Piedmont………18
3. Assessing Nutrition and Health………...20
Porotic Hyperostosis and Cribra orbitalia……....……...……….………..20
Scurvy...23
Dental Carious Lesions………....………..25
Dental Calculus………..25
Alveolar Infection………...………..26
Premortem Tooth Loss………....………...27
4. Sample and Methods………...………....………29
5. Results……….………....………..44
Oral Health………...……….44
Anterior Carious Lesions………...……...………44
Posterior Carious Lesions………...………..46
Anterior Alveolar Infection………...………...47
Posterior Alveolar Infection………...………...48
Anterior Premortem Tooth Loss………...………....49
Posterior Premortem Tooth Loss………...………...50
Cranial Pathologies………...…....………51
Porotic Hyperostosis………...………..51
Cribra Orbitalia………...………..52
Scurvy………....………53
Other Pathological Conditions………....………...54
List of Appendices
I. Data Collection Codebook………...69
II. Data Collection Forms…………...………....…...……..71
List of Tables 1. Study Sample Period Distinction with Dates and Sites………...8
2. Demography of Sample……….30
3. Summary of Anterior Carious Lesion Frequencies………...45
4. Summary of Posterior Carious Lesion Frequencies………...…...46
5. Summary of Anterior Alveolar Infection Frequencies………..47
6. Summary of Posterior Alveolar Infection Frequencies………....….48
7. Summary of Anterior Premortem Tooth Loss Frequencies……….…..49
8. Summary of Posterior Premortem Tooth Loss Frequencies………..50
9. Summary of Porotic Hyperostosis Frequencies……….51
10.Summary of Cribra Orbitalia Frequencies……….52
11.Summary of Scurvy Frequencies………...…54
12.Summary of Results………....………...57
List of Figures 1. Chronology of North Carolina Piedmont (Ward and Davis, 1999)……….7
2. Map of North Carolina Piedmont, Study Sample Sites (edited from Ward and Davis, 1999)………...………...10
3. Top: superior-posterior view of porotic hyperostosis in a child (U.S. National Museum of Natural History specimen 327074). Bottom: close-up view of section through the skull of sample individual showing expansion of diploe and loss of outer table (Walker et al., 2009)…….………..21
4. Cribra orbitalia (El-Najjar and Lozoff, 1975)………...………....……….22
5. Probable scorbutic lesions on sphenoid and temporal (Ortner, 2003)………...23
6. Posterior-superior view of probable scorbutic lesions (Ortner et al, 1999)………...24
7. Alveolar infections in a male from Useppa Island (Hutchinson, 1999)…...……….27
8. Premortem tooth loss of burial 1Z from Baum, North Carolina (Hutchinson, 2004)………...………...…………..28
9. 31Mg2 70 Burial 41, right maxillary carious lesions………32
10.31Or11 80 Burial 4, mandibular alveolar infection of left second molar………..33
11.31Mg2 70 Burial 41, mandibular premortem tooth loss………....34
12.31Yd1 1156 Burial 22a, probable porotic hyperostosis on cranial vault………...35
14.31Or11 80 Burial 4, lesions on posterior region of left maxilla indicate
probable scurvy………..37
15.31Or11 80 Burial 4, superior-posterior view of hypertrophic lesions on vault indicating probable scurvy………37
16.31Or11 80 Burial 4, left orbital lesions indicating probably scurvy……….….39
17.31Mg3 71 Burial 4, orbital lesions indicating maybe scurvy………....………40
18.31Or11 80 Burial 4, detail of cranial vault lesions………41
19.31Or231 2351 Burial 1, right mandibular ramus lesions indicating possible scurvy………...42
20.31Mg3 71 Burial 1, affected zygomatic arch showing possible scorbutic lesions……….……43
21.31Or11 80 Burial 2, teeth showing enamel deposits possibly indicating nutritional deficiency………55
List of Radiographs i. 31Or11 80 Burial 4, posterior region of cranial vault………..38
ii. 31Or11 80 Burial 4, left orbital lesions………...39
iii. 31Mg3 71 Burial 4, cranial vault lesions……….40
Chapter 1
Diet and Health in Prehistoric and Early Historic United States
The transition from foraging to food production has often been discussed by focusing on
social, cultural and technological changes. Although the adoption of agriculture added security of
settlement and the subsequent creation of modern definitions of civilization, it also had
consequences for health. These changes were not uniform or universal. Larsen (1995) explains
that dietary changes and health consequences may have been constructed by localized
circumstances, creating worldwide variability.
This thesis tackles two questions concerning the subsistence and stability in the North
Carolina Piedmont from late prehistoric to early Contact periods. First, does skeletal and dental
pathology from the early sites (A.D. 1150 to 1400), such as Town Creek, support the
paleobotanical evidence, suggesting an importance and reliance on agriculture? I gathered
evidence for this question by studying carious lesion and dental pathology. Second, how stable
was the mixed economy and subsistence in the North Carolina Piedmont during the transition
from before to after contact? This evidence was collected by looking at dental and skeletal
lesions that suggest dietary deficiencies. Few of the previous subsistence studies regarding the
North Carolina piedmont include discussions of human nutrition and health. The data and
analysis presented here will begin another dialogue in the ongoing discussion of European
impact on the populations of the North Carolina piedmont.
How the adoption of agriculture has impacted dental and overall health has been studied
extensively in many areas of the world. Increased population density and sedentism accompany
includes the intensification of maize agriculture and an extension and escalation of trade
(Goodman et al., 1984). Larsen (1995) cites the decline in dental health with the adoption of
agriculture as one of the most striking changes in human populations. Increased emphasis on
carbohydrates in the diet has been seen to cause an increase in dental caries and antemortem
tooth loss (Larsen 1995).
One study conducted on a prehistoric population in Georgia showed that there was an
increase in the number of individuals affected by dental caries in an agricultural group versus the
nonagricultural group (Larsen, 1984). Larsen (1984) attributed this increase to the focus of
subsistence on maize after A.D. 1150. The high sucrose content of maize, along with a low
protein and high carbohydrate diet that characterized settlement in prehistoric Georgia were all
cited as important factors that contributed to the decline in dental health (Larsen 1984).
Paleobotany and zooarchaeology suggest that after A.D. 1150 in the southeastern United
States, agricultural products became important in diet, but remain within a mixed economy
through the Contact period (Gremillion, 1987, 1989, 1993a, 1993b, 1995; Holm, 1987, 1993,
1994, 2002; Runquist, 1979). Indigenous populations of the eastern United States, including the
North Carolina piedmont, experienced numerous biological, social, political and economic
changes following European contact. A change highlighted by historians and anthropologists is
the dramatic population decrease and resulting mobilization of populations as a result of the
colonization. However, recent research has found that European colonization did not have
universal or consistent consequences for indigenous populations. Depopulation was neither
immediate nor universal (Hutchinson and Richman 2006; Thornton 1987).
Dietary resources changed for indigenous populations as a result of colonization.
animals were introduced, certain foods were required to be grown in order to support the large
colonial effort and certain technologies were required to produce these foods. Corn is an
important example of a food that was very important to colonization.
This thesis is part of a broader research project that looks at the impact of European
colonization on the indigenous populations of piedmont North Carolina. The Research
Laboratories of Archaeology (RLA) at the University of North Carolina has been studying the
nature and timing of the European contact, as well as the effects on native economy, technology,
social organization and cultural patterns. Subsistence studies have been conducted to research the
botanical and faunal remains to understand the economy and diet of the populations (Gremillion,
1987a, 1987b, 1989, 1993a, 1993b, 1995; Holm, 1987, 1993, 1994, 2002; Runquist, 1979;
VanDerwarker et al., 2007; Wilson, 1977, 1983; Yarnell and Black, 1985). The skeletal remains
of some of the sites have also been studied to understand indicators of health and disease (Ward,
1987b; Coe, 1995; Hogue, 1988; Driscoll, 2001; Boudreaux, 2005; Eastman, 1999).
I predict that the increased population mobility as a result of contact can be seen to cause
a decreased reliance on agriculture. Mobility in the context of this study is defined by
unpredictable movement of populations that is caused by external forces such as raids, warfare
and disease. While some of the populations in the study at one time participated in seasonal
movement for the optimization of resources and continual movement for the purpose of
agriculture or trade, this should be understood as distinct because of its predictable and internally
motivated nature. The populations altered the size and location of their sites with the decreasing
overall population due to European diseases and other consequences of contact. A mobile
population cannot sustain a solely agricultural diet, and so a mixed economy would have become
would have relied on a mixed economy because agriculture was only beginning to be important
in diet. Pre-Contact sites would have had more agriculture, as evidenced by the increase of maize
in archaeological deposits, but still utilized a mixed economy with hunting, fishing and
gathering. Post-Contact sites would have been mobile and relied on less agriculture, while
maintaining a mixed economy to support the struggling populations.
One of the goals of this research is to demonstrate how mixed subsistence economies can
be studied by looking at the human skeletal remains. Dentition and dental pathologies are useful
to estimate the impact of diet on health. Oral health is an important indicator of overall health.
An oral environment with dental pathologies such as alveolar infection and dental caries can
drive a decline in the overall health of the individual. Dietary deficiencies can also leave traces
on skeletal elements. The cranial lesions studied for this research are characteristic of anemia and
vitamin C deficiency. The presence of these lesions can indicate the scarcity of certain foods in
the diet of indigenous populations. By looking at the health of the individuals, we can make
predictions about the subsistence and stability of the populations in the North Carolina piedmont
and can look at changes over time and between skeletal samples from different archaeological
sites, to assess the impact of European contact on the subsistence patterns and subsequent health.
In this study, I observed that skeletal and dental pathologies contributed more evidence
towards this debate. This study expects to see a high level of dental pathologies in the Town
Creek sample, if it is an agricultural society. Predominantly agricultural subsistence at Town
Creek may be seen in a high frequency of individuals affected by carious lesions, alveolar
infection and premortem tooth loss. Larsen (1995) explains that there is a decline in dental health
due to the advent of agriculture, so a high frequency in these dental pathologies could be
subsistence economies, an increase in agriculture may have narrowed their overall diet breadth
and caused an increase in frequencies of dietary deficiency pathologies as well. This leads us to
expect a high level of nutritional deficiency pathologies in populations with increased reliance on
agriculture. Town Creek and Forbush Creek are the sites with skeletal samples from the Early
period of my study. Wall and Early Upper Saratown are from the Middle period. Upper
Saratown and Fredricks are in the Late period of my sample and date from a span of extensive
European contact. Reliance on a more mixed economy may show a lower level of dietary
deficiencies because of the wider dietary breadth. The skeletal samples from Upper Saratown
and Fredricks should have lower frequencies of dietary deficiencies and dental pathologies
because they are the sites most likely to rely heavily on a mixed economy and less on agriculture
because of the mobility of the populations.
The advent of agriculture and later European contact had innumerable effects on the
indigenous populations of the North Carolina piedmont, and this thesis hopes to open a dialogue
about how human skeletal remains can be utilized to study these effects and changes. My thesis
aims to present the observations of dental and cranial pathologies in the context of the cultural
and biological setting of these sample populations from the North Carolina piedmont in the
attempt to answer questions about how agriculture and European contact influenced nutrition and
overall health.
Chapter 2
North Carolina Piedmont Geographical and Cultural Context
The Woodland period, from 1000 B.C. to A.D. 1600, began the gradual shift in the
eastern United States toward agriculturally based subsistence economies for indigenous
populations (Ward and Davis, 1999). North Carolina’s populations also saw varying degrees of
increased complex and elaborate mortuary rituals, mound building and an extension of trade
(Ward and Davis, 1999). The period is traditionally marked by the appearance of
pottery-making, though some of the earlier sites in the Woodland period include archaic stone tools
(Ward and Davis, 1999). From about A.D. 1000 until first contact with Europeans, the Piedmont
cultures had few outside influences. However, while some developed from small, scattered
villages to larger, more centered settlements with the advent of agriculture, the scale and
intensity of settlement is quite variable across the piedmont. However, this increase in the
importance of agriculture did not eclipse the substantial support of hunting and gathering in the
Figure 1, Chronology of North Carolina Piedmont (from Ward and Davis, 1999)
The Woodland period is divided into three sub-periods which are defined by the steady
increase in agriculture from possible cultivation of squash, maygrass, sunflower, chenopod and
sumpgrass to a broadening of agricultural pursuits such as the establishment of corn as a staple
crop (Yarnell and Black, 1985; Ward and Davis, 1999). The Early and Middle Woodland periods
have a large number of seed remains, but this does not necessarily indicate an agricultural
subsistence. The seeds could have been from many small garden plots. The subsistence during
these periods seems to primarily depend on hunting and gathering of wild plant and animal foods
(Ward and Davis, 1999). Squash was introduced around A.D. 200. Corn was not an important
food crop until around A.D. 1000 and beans were not introduced until A.D. 1200. The
combination of these three crops allowed the increase and expansion of an agricultural system
(Ward and Davis, 1999).
Much of the sample included in this study dates to the Late Woodland period, specifically
the early and middle samples. This period was a time of growth as can be seen by the increase in
for barriers that keep outsiders out of villages. The favored agricultural lands have been
presented as a possible theory behind an increase in attacks, but social or ideological differences
and the coveting of surplus have also been offered (Ward and Davis, 1999).
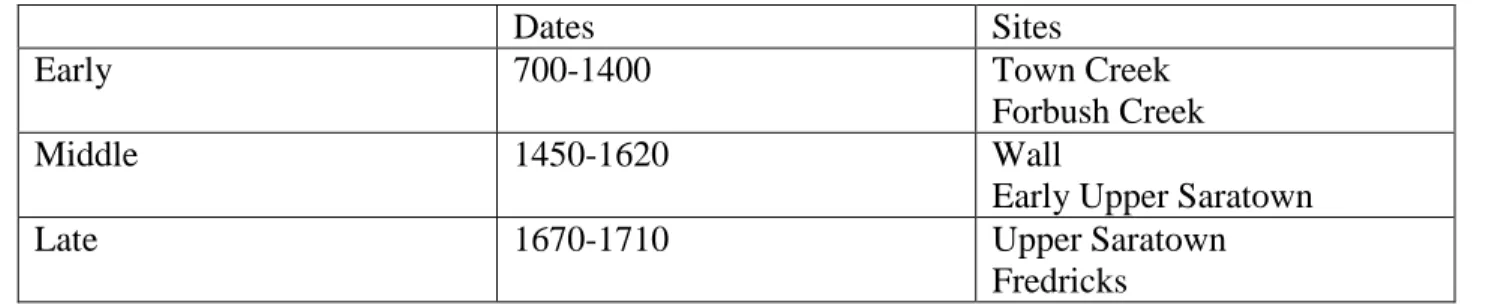
Table 1: Study Sample Period Distinction with Dates and Sites
Dates Sites
Early 700-1400 Town Creek
Forbush Creek
Middle 1450-1620 Wall
Early Upper Saratown
Late 1670-1710 Upper Saratown
Fredricks
The later sample of this study is contained within the Historic Period and includes the
early contact with Europeans. The Spanish explorers were the first Europeans to enter the North
Carolina piedmont. Hernando de Soto in 1540 and Juan Pardo in 1566 and 1567 entered the
southwestern edge of Siouan territory (Davis, 2002). After these expeditions, there were few
recorded contacts between the piedmont Indians and the Europeans until the middle of the
seventeenth century. During this time, English traders and explorers began to enter the inner
coastal plain and piedmont in Virginia and moved south and west of the James River near
Jamestown, Virginia.
The cultural landscape of the piedmont of North Carolina was changed dramatically due
to the fur trade during the late 1600s. There is an intense difference in village population size
between early-Contact period and later-Contact period due to disease. The later Upper Saratown
and Fredricks show much higher mortality rates than earlier villages and the cultural remains
show that the inhabitants of earlier settlements combined with neighbors to form new villages as
enough to sustain a few large, fortified villages. However, the population continuously dwindled
and the autonomous villages of the past intermittently merged to form new communities (Davis
and Ward, 1991). Violence also played a part in the changes in health and culture in the North
Carolina Piedmont. As Davis (2002) describes, there were frequent Iroquois raids of native
villages in the piedmont during the late-Contact period that would have contributed to the
recurrent relocations of villages in the area. There are also records of wars between tribes which
would have diminished population and caused tension and movement of populations away from
the conflicts.
The shifting cultural landscape of the North Carolina Piedmont can be seen in the
changes in mortuary practice across the early and late-Contact periods. Villagers in the
early-Contact period still maintained the placement of burials in and around houses without a form of
clustering and a common pit type was the shaft-and-chamber tomb, the common mortuary
practice of pre-Contact. However, in the later Contact period, such as at the Fredricks site,
burials were clustered in cemeteries outside of the village, a common practice by Europeans,
instead of being loosely organized within the village. The individual burials at Fredricks also
changed from a shaft-and-chamber type to a rectangular, simple-pit burial. These modifications
Study Sample Background
Figure 2, Map of North Carolina Piedmont, Study Sample Sites (edited from Ward and Davis, 1999)
Town Creek Mound (31Mg2) and Village (31Mg3)
Town Creek was occupied from A.D. 1150 to 1400 and is located near Mount Gilead, NC
on the west bank of the Little River near the convergence with Town Ford Creek in Montgomery
County. It was a planned town with public and domestic spaces in the southern piedmont of
700 years with the most intensive occupation as a formal town lasting 200-300 years beginning
in A.D. 1150 (Boudreax, 2005). The public spaces at Town Creek included an earthen platform
mound, constructed around A.D. 1250, which would have contributed to Town Creek’s role as a
ritual and ceremonial center (Boudreaux, 2005). The archaeological site was originally divided
into two areas, separating the mound from the surrounding village (Davis et al., 1998). The site
was excavated extensively starting in 1937 by Joffre Coe, through the University of North
Carolina at Chapel Hill (Davis et al., 1998). The site was divided into two areas for research
purposes. The site 31Mg2 was designated to the mound area (a 120 ft. by 140 ft. area that
encompassed Frutchey Mound and the village immediately adjacent). The remainder of the site
that included the palisaded village was designated 31Mg3. For this thesis, the two areas are
combined into one site because of the minimal difference in occupational pattern. The distinction
between the two sites is not as important in this study because of the proximity and similarity of
the site populations, but continues to matter in the management of the collections and data (Dr.
R.P. Stephen Davis, Jr., personal communication, April 2014).
Several of the graves at Town Creek were grouped in mortuary areas where most
individuals are interred in simple pits with bodies in a loosely flexed position. Some of the
burials were found in a fully extended position and there were a few who had been reburied as
bone bundles. Several infants and small children were buried in urns – large pottery vessels in
which the bodies were tightly wrapped and placed inside (Ward and Davis, 1999).
Boudreaux (2005) theorizes that the enclosed circular structures found during Town
Creek’s occupation began as houses where individuals, possibly of the same family group, would
live and be buried. These structures then possibly remained places of burial even after people
domestic refuse and overlapping structures as evidenced by many postholes. This suggests a
substantial residential population that extended over a long period of time (Ward and Davis,
1999). The large population size and length of occupation is supported by the great number of
burials found. Coe (1995) estimates that 563 people were buried during the main occupation
from A.D. 1200-1400.
The plant resources found at the site include hickory, walnut, acorn, Chenopod and two
cultigens, squash and corn (Coe, 1995). According to Coe (1995), most of the botanical remains
were collected by hand during troweling and screening through a large mesh. Other collections
were water-screened and floated (Coe, 1995). There is a debate of how important agriculture was
in the diet of the populations at Town Creek. The paleobotanical remains of the site include one
of the largest samples of corn in the Southeast (Coe, 1995). However, there is a question of how
this large amount of corn was used. Binford (1967) and Munson (1969) suggest they may have
been domestically used for hide smoking and smudging pottery vessels (as cited in Coe, 1995).
The bulk of the corn cobs were not found in food refuse context, but in corncob pits that may
have been used for these domestic activities (Coe, 1995). Despite these theories, maize is
currently understood to be a very important crop in the diet, in addition to hunting, fishing and
gathering (Dr. R.P.S. Stephen Davis, Jr., personal communication, April 2014).
Forbush Creek (31Yd1)
Forbush Creek was occupied from 700 to 1200 and is located on the west bank of the
Yadkin River, near Huntsville, North Carolina and west of Winston-Salem, North Carolina. The
site was first excavated by Stanley South through the North Carolina Department of Archives
of the site that would be destroyed with the construction of a new highway. Stanley South
excavated twenty-eight human graves in 1957 that were heavily concentrated, suggesting a
prehistoric cemetery (Davis et al., 1998). The site was excavated again in 1972; providing
greater archaeological content for the burials (Dr. R.P. Stephen Davis, Jr., personal
communication, April 2014). However, at the moment there are unanalyzed botanical and faunal
remains. There is no evidence of charred corn, but there were some pot sherds with imprint of
corn cobs (Dr. R.P. Stephen Davis, Jr. personal communication, April 2014). The archaeological
remains of the site suggest that Forbush Creek was occupied intermittently (Ward and Davis,
1999). The pot sherds found in the pit fill at the site are characteristic of the Uwharrie phase (ca.
A.D. 700-1200) (Davis et al., 1998). Corn would have been present during the latter part of
occupation, but we are unsure how prominent it was in their diet.
Eighteen of these burials were dug into the subsoil as simple pits and contained
articulated and flexed skeletons of single individuals. Six burials were ossuaries, or group
burials, that contained disarticulated and bundled remains. There were other burials with varying
features and positioning. None of the burials had grave goods associated with them, but
potsherds in the pit fills indicate when the site would have been occupied (Ward and Davis,
1999). All of the burials were in the same area of the site but the ossuaries were generally
segregated from the individual pit burials (Ward and Davis, 1999).
Wall (31Or11)
Wall was occupied from 1400 to 1600 and covers approximately 1.25 acres on the Eno
Joffre Coe in 1938 and then extensively excavated by Robert Wauchope in 1940-1941. It was
later excavated in 1983-1984 and 2001-2002 (Davis et al., 1998; Dr. R.P. Stephen Davis, Jr.,
April 2014, personal communication). The excavations have uncovered seven houses that are
circular in shape and average about 35 feet diameter (Davis et al., 1998). The Wall site was
probably occupied by a population of 100 to 150 individuals for 20 years or less (Davis et al.,
1998). The subsistence data includes remains of corn, beans, squash, acorns, hickory nuts and
walnuts (Gremillion, 1987, 1989, 1993a). The faunal remains include deer, small mammals,
turtles, fish and passenger pigeons that were collected only from the midden (Holm, 1987, 1993).
The burials at Wall are characterized by variability with more dispersal of the graves and
different orientations. Most of the burials are oriented with their heads to the northeast, but one is
towards the southeast, one to the southwest and one to the east (Ward, 1987). Ward (1987)
suggests that this variability may indicate that interments were separated by intervals or that
orientation was not as important as at later sites such as Fredricks. All of the burials were oval in
plan and shaft-and-chamber type (Ward, 1987). The grave offerings were most commonly small
clay pots that may have contained food remains. Often, shell beads were sewn on the burial
clothes or placed on the bodies as jewelry. Sometimes engraved shell gorgets were used as
jewelry for subadult burials.
Early Upper Saratown (31Sk1)
Early Upper Saratown (Hairston site) dates from 1450 to 1620 and is located on the Dan
River near Walnut Cove, North Carolina in Stokes County. This large, palisaded village is one of
three sites, including Upper Saratown and the William Kluttz site, along the Dan River that were
part of the Catawba Nation (Dr. R.P. Stephen Davis, Jr., personal communication, April 2014).
The site covers about 2.5 acres and contains many pit features and a thick, rich midden (Davis
and Ward, 1999). The houses are small, but comparable to the size of prehistoric houses
(Eastman, 1999). The size of the site and the high density of cultural material suggests a large
resident population.
The Research Laboratories of Anthropology at University of North Carolina at Chapel
Hill conducted excavations during the summer of 1981 (Wilson, 1983 as cited in Ward and
Davis, 1999). The archaeology of the site is consistent with a settlement pattern that suggests a
stable population that joined together to form fewer, but larger villages (Ward and Davis 1999).
Most of the features were large storage pits, but there were also earth ovens and hearths (Ward
and Davis 1999). The botanical samples from this site have been obtained but have not been
analyzed and reported. Holm (1994) recorded the presence of deer, bear, raccoon and other wild
faunal remains. Nevertheless, the size and intensity of the site occupation suggest that there
would have been increased reliance on agriculture (Ward and Davis, 1999).
Six of the burials used in my sample from this site are part of the Gravely collection
which were donated by Richard Gravely, an amateur archaeologist, to University of North
Carolina at Chapel Hill in 1983 (RLA accession no. 2365, Burials 2-6) (Davis et al., 1998).
These burials were excavated at the site during the late 1960s and are assumed to be from Early
Upper Saratown, but we do not know for sure where they were located (Dr. R.P. Stephen Davis,
Jr., personal communication, April 2014). The other burial (RLA accession no. 2342, Burial 1)
was excavated in 1981 by Jack Wilson (Davis et al., 1998). Most of the burials were
accompanied by funerary objects. A few of the burials had copper staining on the mandible and
Upper Saratown (31Sk1a)
Upper Saratown was occupied from 1670 to 1710 and is one of the three sites, including
Early Upper Saratown and William Kluttz site, along the Dan River occupied by the Sara tribe.
The site is located near Walnut Cove, North Carolina in Stokes County and is a large village site
that would have been occupied by between 200 and 250 people (Ward and Davis, 1999). The
palisaded village is thought to have contained 20 to 25 houses which were circular and
rectangular and ranged from 20 to 30 feet in diameter (Davis and Ward, 1991; Eastman, 1999).
Excavations began in 1972 and were conducted by Bennie Keel until 1981 (Davis et al., 1998).
The near decade of excavations uncovered numerous circular houses, pit features and burials
(Ward and Davis, 1999). Ward and Davis (1999) present that there was balance in subsistence
between wild and domestic food resources. Corn, beans, squash and gourds were cultivated, and
peaches were a favored contact addition to the diet (Wilson, 1977). The botanical remains were
charred plant matter obtained through water-screening and two flotation samples from midden
and pit contexts (Wilson, 1983; Gremillion, 1989). The faunal remains were also collected from
midden and pit contexts (Holm, 1994).
The houses and palisade lines in Upper Saratown during later contact were rebuilt many
times. Eastman (1999) believes this rebuilding was due to ritual cleansing and purification that
would have been amplified as epidemic diseases became more and more a problem for the
Siouan communities at the site. Even during the middle period of contact at Upper Saratown,
there is evidence of large population decline, including one house with 12 burials of children and
adolescents which are thought to be due to epidemic diseases (Eastman, 1999). These changes in
the community (Ward and Davis, 1999). Upper Saratown, the Kluttz site, and the Madison site
resemble large cemeteries because of the extensive amount of burials. However, they were
residential villages.
Fredricks (31Or231)
Fredricks, located on the Eno River near Hillsborough, North Carolina in Orange County,
was occupied in the Contact period between 1690 and 1710 and defines the archaeological
remains of an Occaneechi town. This site is characterized by having much of the native traditions
remain intact while also showing an increase in trade between the Piedmont Indians and the
English settlers. Occupation of the village most likely lasted no longer than 5-10 years with no
more than 50-75 people living in 10-12 houses (Ward and Davis, 1987). All of the burials
contained funerary objects; including a large number of European-made trade items (Davis et al.,
1998). Most of the burials (1-11 and 13) at the site were situated outside of the palisade that
surrounded parts of the village (Ward, 1987). Two other burials (12 and 14) were situated within
the palisaded village (Davis et al., 1998). All of the graves were laid out in a way that defined a
cemetery, a mortuary pattern not shared by any other North Carolina Piedmont group (Ward,
1987). Two additional cemeteries were found outside of the palisaded village (Dr. R.P. Stephen
Davis, Jr., personal communication, April 2014).
Only a small amount of the soil was used for flotation during excavation seasons, but
Gremillion (1987a) reports that a reasonably representative sample was used for analysis. It has
been established that maize was important at the Fredricks site, along with acorn, hickory, the
collection of fruits and management of gardens with annual crops (Gremillion, 1987a). Maize is
maize has not been assessed (Gremillion, 1987a). This subsistence data shows a nutritionally
diverse plant food resource base.
Subsistence Studies in the North Carolina Piedmont
The plant and animal remains from the prehistoric sites have been compared to the
early-Contact and late-early-Contact sites to begin research on the impact on diet and health in the
populations. Gremilion (1987, 1989, 1993a, 1993b, 1995), Holm (1987, 1993, 1994, 2002) and
Runquist (1979) all studied plant and animal use of the late prehistoric and early-Contact period
populations in the North Carolina piedmont and found that the late prehistoric diet included a
mixed economy of domesticated plants and wild plants and animals. According to their evidence,
this mixed economy continued at least into the early eighteenth century.
The agricultural transition is often assumed to be a universal and constant progression
where agriculture remains the only important source of subsistence. However, foraging, fishing
and hunting are usually continued, creating a complex system with farming that allows flexibility
and a reduction of risk associated with diet. The decreased population in the North Carolina
piedmont due to warfare and European diseases, in addition to an increase in the fur trade that
caused an increase in the amount of time required to process these furs, may have affected the
plant subsistence abilities of the population (Wilson, 1983). Wilson (1983) suggests that these
changes in the piedmont may have reduced agricultural productivity because the labor and time
previously used was not available, either due to population decline or allocation of resources and
people elsewhere.
VanDerwarker and coworkers (2007) found in the late-Contact site of Upper Saratown,
that the overall composition of domestic food assemblage remained relatively unchanged as
through consumption of familiar foods, even if their society and populations were threatened due
to European contact and especially the raiding by other tribes, such as the Iroquois
(VanDerwarker et al., 2007). According to the botanical and faunal remains, indigenous
populations may have continued to use a mixed economy of domestic and wild dietary resources
Chapter 3
Assessing Nutrition and Health
This chapter describes the clinical evidence and biological processes of the pathological
conditions used in this study. These conditions are important because they can indicate diet and
overall health. They are also the most commonly seen conditions on the sample for this study,
which makes them possible trends and patterns across the whole sample. The goal is to recognize
how these conditions are caused in order to better understand why they might be occurring in the
present sample. Porotic hyperostosis and cribra orbitalia are observed in individuals with
possible dietary deficiencies that show diets low in meat and animal products or an inability to
fully metabolize meat or other animal products. The presence of scurvy shows deficiencies of
vitamin C in the diet. Dental carious lesions, dental calculus, alveolar infection and premortem
tooth loss can indicate diets high in carbohydrates. The complexities of these different conditions
are explained in the following sections.
Porotic Hyperostosis and Cribra Orbitalia
Porotic hyperostosis is characterized by porous lesions on the frontal, parietal and
occipital bones of the cranium. Cribra orbitalia has the same porous lesions but they are found on
the superior border of the orbits. Both lesions are caused by a widening of the spongy diploe and
a corresponding thinning of the outer dense cortical bone. Both conditions have been ascribed to
many different factors including thalassemia, hereditary anemias, sickle-cell anemia and iron
deficiency anemia (Moseley 1963; as cited in Goodman et al. 1984). Anemias alter skeletal
tissue in this way because there is an increase in red blood cell production within the marrow
caused by the increase in red blood cell production causes the outer layer of bone to become very
thin and exposure of the inner trabecular bone. This results in a sieve-like appearance.
Figure 3, Top: superior-posterior view of porotic hyperostosis in a child (U.S. National Museum of Natural History specimen 327074). Bottom: close-up view of section through the skull of sample individual showing expansion of diploe
and loss of outer table (from Walker et al., 2009).
Porotic hyperostosis has been attributed to nutritional stress in most New World cases
because other explanations such as malaria and hemoglobin-derived anemias cannot by applied
to New World populations (El-Najjar et al., 1975, Lallo et al., 1977, Mensforth et al., 1978, as
cited in Goodman et al., 1984). Porotic hyperostosis is a valuable marker of nutritional stress in
Iron-deficiency anemia was once the most popular theory behind porotic hyperostosis and cribra
orbitalia, but the biological response of iron-deficiency anemia does not produce massive
marrow hypertrophy consistent with porotic hyperostosis (Walker et al., 2009). Walker et al.
(2009) argue that the collaborative effects of nutritionally deficient diets, infectious disease, poor
sanitation and cultural practices related to the reduction of meat consumption by breastfeeding
and pregnant women are possible explanations for porotic hyperostosis. Marrow hypertrophy
consistent with porotic hyperostosis is most likely a response to nutritional megaloblastic anemia
(Walker et al., 2009). Lack of Vitamin B12 and B9 are the most common causes of megaloblastic
anemia, and these vitamins are primarily derived from animal foods (Walker et al., 2009). The
current research shows that porotic hyperostosis can be attributed to a lack of meat in the diet or
an improper ability to digest the nutrients from the meat. Larsen (1995) argues that there have
been many studies that document a higher prevalence of either cribra orbitalia or porotic
hyperostosis in sedentary farmers compared with mobile foragers. Cribra orbitalia is attributed to
multiple dietary deficiencies, and individuals who suffer from these orbital lesions are likely to
have suffered from multiple nutritional deficiencies at the same time (Walker et al., 2009).
Scurvy
Scurvy, as evidenced by scorbutic lesions, is the result of an inadequate amount or
absence of dietary vitamin C (ascorbic acid). Vitamin C is very important in the formation of
connective tissues such as collagen and cement materials, principally the cement substance that
binds the endothelial layer in blood vessels (Ortner et al., 1997). An insufficient amount of
vitamin C can cause a defect in the cement material, resulting in increased susceptibility to
hemorrhage from even normal movement and muscle activity such as chewing or eye motion
(Ortner et al, 1997).
Figure 5, probable scorbutic lesions on sphenoid and temporal (from Ortner, 2003)
Ortner et al. (1997) argue that when studying how scurvy appears on bones, the lesions of
particular interest tend to appear on the greater wing of the sphenoid and the posterior surface of
the maxilla. The lesions of the maxilla and sphenoid tend to be bilateral, porous and
hypertrophic. The basic external vault lesion is often a circumscribed, but irregular, area of
porosity may be accompanied by hypertrophic bone formation that increases the thickness of the
skull within the porous region. Lesions can also be present on the bony palate and are
represented by abnormal porosity and affected bone. The orbit roofs also tend to have lesions
when the greater wing of the sphenoid are affected (Ortner et al. 1997).
Figure 6, posterior-superior view of probable scorbutic lesions (from Ortner, 1999)
The cases included in Ortner et al. (1997)’s report showed bony surfaces related to
chewing had more porosity and reactive bone formation. Ortner et al. (1997) provides a possible
explanation: that hemorrhage of the vascular supply to the temporalis and pterygoid muscles
would show this pattern of porosity and reactive bone on the greater wing of the sphenoid and
the posterior surface of the maxilla. Individuals must keep eating, even if their diets are low in
vitamin C and are contributing to their deficiencies. Ortner et al. (1997) argue that if there is food
available, eating and chewing will continue, exacerbating the hemorrhages and associated
Dental Carious Lesions
Carious lesions are variable in appearance and can start anywhere on the crown or root
where plaque accumulates. Hillson (1986) describes the lesions as being opaque spots in the
enamel or large cavities, remaining stable for a long time or progressing rapidly to penetrate the
pulp chamber and cause tooth loss. Carious lesions are caused by a low pH in the mouth
environment, causing a demineralization of enamel, cement and dentine. According to Legler
and Menaker (1980; cited by Hillson, 1986), the mineral in dental tissues dissolves between pH 4
and 5.5. Sugar-rich diets have proved to be the most cariogenic, specifically foods that contain
sucrose, glucose, fructose and lactose (Gibbons & van Harte, 1975; cited by Hillson, 1986).
Mormann & Muhlemann (1981; cited by Hillson 1986) explain that starch rich diets tend not to
be as cariogenic, partly because of their slower diffusion and breakdown, but likely for more
complex reasons that are not discussed.
Larsen (1995) emphasizes that food composition and how it is prepared is very important
to understand when looking at higher caries prevalence. Many agricultural societies prepare plant
foods like maize by boiling them into a soft, gruel-like consistency (Larsen 1995). These soft
foods promote the growth of bacterial colonies by getting into fissures and grooves of premolars
and molars, as well as in between teeth and other places that are not cleaned naturally by saliva
or mastication (Larsen 1995).
Dental Calculus
Dental calculus is formed by the mineralization of dental plaque (Roberts and
Manchester, 2007). Plaque is formed by the deposits of matrix created by the bacterial
communities on the tooth surface and proteins in the saliva (Hillson, 1986). Amino acids from
proteins are dissolved slowly and not broken down by enzymes in the saliva so most of the
energy production in plaque comes from carbohydrates (Hillson, 1986). When crystallites of
mineral are deposited in the plaque, it forms dental calculus which can remain on teeth in
archaeological samples. According to Roberts and Manchester (2007), calculus is most common
near the salivary glands.
Alveolar Infection
Alveolar infection is commonly associated with the formation of periodontal pockets.
The main cause of periodontal pocket formation is known to be the activity of plaque bacteria
from the supra-gingival plaque depositing against the gingival margin which induces
inflammation in the tissues (Hillson, 1986). This causes swelling, allowing plaque to penetrate in
the groove which is usually guarded by a tightly fitting gingival cuff, not present because of the
tissue inflammation (Hillson, 1986). Hillson (1986) explains that a diet that is conducive to the
growth of plaque will be a predisposing factor of alveolar infection. Such a diet includes soft,
carbohydrate-rich food because it adheres to the teeth and aids in the diffusion of nutrients from
the food into the plaque. Sugar-rich foods are also a predisposing factor because they are also
immediately available to be synthesized into polysaccharide adhesives by plaque bacteria
(Hillson, 1986). Protein-rich foods take much longer to be synthesized so do not contribute as
much. Figure 7 shows an individual (Useppa Island; from Hutchinson, 1999) with bilateral
Figure 7, Alveolar infections in a male from Useppa Island (Hutchinson, 1999)
Premortem Tooth Loss
Alveolar infection causes the degeneration of the alveolar bone and other tissues that
anchor teeth into the jaws (Larsen 1995). As more bone is resorbed, the bony support is reduced
and teeth are lost. Consumption of soft carbohydrate foods promotes more carious lesions and
more periodontal disease which can increase the amount of teeth lost premortem. Larsen (1995)
reports that many studies that document an increase in the number of carious lesions with the
transition to farming or agricultural intensification also reported elevated levels of premortem
tooth loss which suggests a strong relationship between caries and tooth loss. Figure 8 illustrates
Chapter 4
Sample and Methods
The sample selected for this study consists of 117 burials from six sites in the North
Carolina piedmont. Archaeological sites were selected based on availability for study and to
create a representative sample of each time period. The six skeletal sample collections were
divided into three periods: Early, Middle and Late. The Early period includes skeletal samples
from Forbush Creek and Town Creek, consisting of remains dating ca. A.D. 1150 to 1400. The
Middle period includes skeletal samples from Wall and Early Upper Saratown, consisting of
remains dating ca. A.D. 1400 to 1620. The Late period includes skeletal samples from Upper
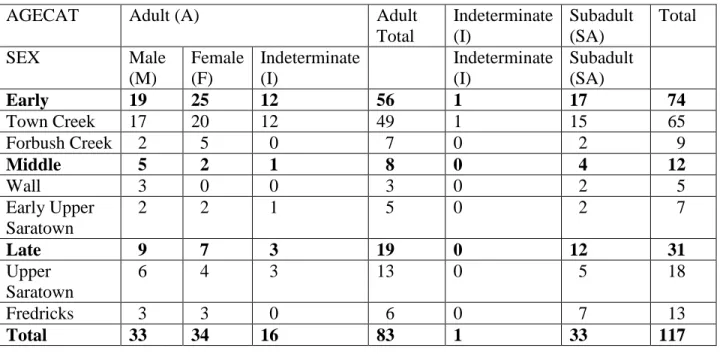
Saratown and Fredricks with remains dating ca. A.D. 1670 to 1710. Table 2 presents a summary
of the demography for the sample. I used the sex and age estimates completed by Dr. Patricia M.
Lambert as part of the inventory of the North Carolina Archaeological Collection for NAGPRA
Table 2: Demography of Sample
AGECAT Adult (A) Adult
Total Indeterminate (I) Subadult (SA) Total
SEX Male
(M) Female (F) Indeterminate (I) Indeterminate (I) Subadult (SA)
Early 19 25 12 56 1 17 74
Town Creek 17 20 12 49 1 15 65
Forbush Creek 2 5 0 7 0 2 9
Middle 5 2 1 8 0 4 12
Wall 3 0 0 3 0 2 5
Early Upper Saratown
2 2 1 5 0 2 7
Late 9 7 3 19 0 12 31
Upper Saratown
6 4 3 13 0 5 18
Fredricks 3 3 0 6 0 7 13
Total 33 34 16 83 1 33 117
The data for the study were collected initially through macroscopic observations. All
observations were done in the Bioarchaeology Laboratory, RLA, University of North Carolina.
After initial observations, photos and radiographs were taken of some of the samples to
document and get a more conclusive look on some of the lesions. Photos were taken in the RLA
with the help of Dr. R.P. Stephen Davis, Jr. The rice present in some of the figures (Fig. 9, Fig.
17, Fig. 20) was used to hold the diagnostic skeletal remains in a certain position to highlight the
affected part of the bone.
Radiographs were taken at University of North Carolina at Chapel Hill Campus Health
with funds from the Michael P. and Jean W. Carter Research Award. Radiographs can be very
beneficial in the study of cranial lesions because they provide a nondestructive method of
observing the internal structure of the lesions. Radiographs reveal diminished cortical mass and
radiographs were also useful as diagnostic tools in differentiating the various conditions studied.
Lesions of different conditions, such as various dietary deficiencies, can look similar on the
surface but when looking at the cross-section can be different.
All individual burial numbers are presented as they are recorded in the RLA catalog of
burials. Each burial is numbered by state number, site number, accession number and individual
burial number. The state number for North Carolina is 31. Site numbers are created by the
abbreviations of the county they are found in and numbered by succession. Accession numbers
are created during excavation and analysis to distinguish collections. The individual burial
numbers are defined to label burials during excavation and for any reporting afterwards.
I recorded the number and location of carious lesions on all teeth. Observations included
what part of the tooth had the carious lesion and the location of the tooth in the mouth. For data
collection I divided the mouth into eight regions defined by three divisions: left and right,
anterior and posterior, maxilla and mandible. I recorded each carious lesion based on five
locations on the tooth – occlusal, lingual, labial/buccal, interproximal distal, interproximal mesial
– and any combination of the locations, such as occlusal and lingual. The size of the carious
lesion was recorded: small, medium, large and total crown destruction.
For data entry, I simplified and combined observations from the eight regions of the
mouth to present the data for carious lesions, alveolar infection and premortem tooth loss in four
quadrants of the mouth: anterior maxilla, posterior maxilla, anterior mandible and posterior
mandible. For results, anterior and posterior carious lesions were presented separately because
there are different patterns of dental caries between the two sections of the mouth (Hillson,
2001). The percentage of individuals affected was calculated by accounting for all individuals
presented in the results because, for the purpose of this study, a mouth with one carious lesion is
considered to have an environment conducive to the formation of more carious lesions.
To show some of the observations and criteria for data collection, I have provided several
images demonstrating the different dental and cranial pathologies. Figure 9 illustrates a right
maxilla (31Mg2 70 Burial 41) with three prominent carious lesions. There is an interproximal
mesial carious lesion on the first incisor, an occlusal carious lesion on the third molar and almost
total crown destruction on the first molar.
Figure 9, 31Mg2 70 Burial 41, maxillary carious lesions
For each tooth with alveolar infection associated with it, the location of the infection was
recorded based on the eight mouth locations and the three dental locations: lingual, labial/buccal
or both. For data entry, the number of locations affected by alveolar infection was noted to see
the frequency of alveolar infection in the four quadrants. The results present the frequency of
Figure 10 shows the right mandible (31Or11 80 Burial 4) with an example of alveolar infection,
where the alveolar bone is receding below the top of the root. There is also a large buccal carious
lesion on the second molar, above the alveolar infection.
Figure 10, 31Or11 80 Burial 4, mandibular alveolar infection of left second molar
I recorded the presence of premortem tooth loss in each individual in the same way: by
location in the eight mouth locations and three dental locations. I present the anterior and
posterior frequencies for premortem tooth loss in the results. To record dental calculus, I
recorded the number of teeth with calculus present. No note was taken of the location within the
mouth or on the tooth because I was more concerned with the frequency of calculus in the
mouth. The data from the dental calculus observations has not been presented in this thesis but
could be used in later studies. Figure 11 shows a mandible (31Mg2 70 Burial 41) with
premortem tooth loss on the mandible for all three molars on the left side and the first and second
Figure 11, 31Mg2 70 Burial 41, mandibular premortem tooth loss
Porotic hyperostosis was identified by porous bone lesions present consistently all over
the cranial vault, distinct from scorbutic lesions indicative of scurvy because of its absence of
circumscribed lesions. While scurvy has hypertrophic and irregular lesions, porotic hyperostosis
tends to have regular lesions that cover almost the entire vault. Radiographs allowed us to see the
cross-sections of the lesions and make these distinctions. For example, Figure 12 (31Yd1 1156
Burial 22a), illustrates a probable porotic hyperostosis case that shows regular lesions all over
the cranial vault. The porous lesions appear like “pin-pricks” all over the crania and indicate
healing porotic hyperostosis. Figure 13 (31Mg2 70 Burial 26) illustrates an example of possible
porotic hyperostosis because the lesions are less defined and harder to see, but are still present.
For data entry, a scale of 0-2 was given to measure the presence: 0 being an absence, 1 being
Figure 12, 31Yd1 1156 Burial 22a, probable porotic hyperostosis
Figure 13, 31Mg2 70 Burial 26, possible porotic hyperostosis
To identify cribra orbitalia in the sample, I examined the orbits of individual specimens
to see any possible porous bone with a trabecular pattern different from that observed in scurvy.
Radiographs aided diagnoses of the distinctions in these lesions. This observation was recorded
using a scale of 0-2 to measure the presence: 0 being an absence, 1 being possible and 2 being
orbitalia was the state of preservation of the individual which affects the number of orbits present
and affected. If one orbit was present and was affected by porotic lesions or if both orbits were
present but only one was affected, the individual was given a ranking of possible (code 1). If
both orbits were present and affected, the individual was given a probable ranking (code 2).
To record incidences of scurvy, I created a scale based on how many bones were affected
by possible lesions, what the lesions looked like, and where the lesions were located. The scale
was no scurvy present (code 0), scurvy may be present (code 1), scurvy possibly present (code 2)
and scurvy probably present (code 3). The most diagnostic lesions observed were striated bone
on the sphenoid, circumscribed lesions on the cranial vault, striated bone around the external
auditory meatus on the temporal bone, striated bone on the ascending ramus of the mandible,
hypertrophic and porous bone in the orbits, and affected bone on the zygomatic arch.
Figure 14 (31Or11 80 Burial 4) shows a probable scurvy case (code 3 on the 0-3 scale)
and an example of probable scorbutic lesions on the posterior region of the maxilla. Figure 15
illustrates the same individual (31Or11 80 Burial 4), but highlights hypertrophic and porous
lesions on the vault of the cranium, characteristic of scurvy. Figure i. features the same cranial
vault lesions of 31Or11 80 Burial 4 in a radiograph, showing the way the trabecular bone as
Figure 14, 31Or11 80 Burial 4, posterior left maxillary lesions indicating probable scurvy
Figure i. Radiograph of 31Or11 80 Burial 4, posterior region of cranial vault
The same individual (31Or11 80 Burial 4) is also featured in Figure 16 to illustrate
scorbutic lesions in the eye orbits. These lesions are hypertrophic and porous. Figure ii. shows a
radiograph of these same orbital lesions with the porosity of the affected orbital bones. Figure 17
shows the superior margin of an eye orbit for a different individual (31Mg3 71 Burial 4) that has
orbital lesions consistent with scurvy. However, this is a good example of a “maybe” case of
scurvy (code 1 on the 0-3 scale) because there was little preservation of this individual so the
orbits were some of the only elements present. Figure iii. presents a radiograph of a cranial bone
of the same individual with possible scorbutic lesions visible. With little preservation, it is not
possible to say for sure if it is a probable case of scurvy because many of the diagnostic elements
are missing. Figure 18 presents a detailed view of the cranial vault lesions from 31Or11 80
Burial 4 to see the pattern of the possible scorbutic lesions found in circumscribed areas of the
Figure 16, 31Or11 80 Burial 4, left orbial lesions indicating probable scurvy
Figure 17, 31Mg3 71 Burial 4, orbital lesion indicating maybe scurvy
Figure 18, 31Or11 80 Burial 4, detail of cranial vault lesions
Scurvy can also affect the mandible, and Figure 19 (31Or231 2351 Burial 1) shows how
the lesions on the right mandibular ramus appear porous on this right side of a mandible. This
individual was possibly affected by scurvy. The lesions were only present on some of the
diagnostic bone elements, and erosion of the cranium obscured other possible lesions. The
temporal bone may also be affected by scorbutic lesions as shown in Figure iv. which shows a
radiograph of the left and right temporal bones of 31Mg2 61 Burial 13. The x-ray shows that
both of these bones were affected with lesions similar to others found in the crania such as the
vault and mandible. Figure 20 is a photograph of a zygomatic arch from an individual with
possible scurvy (31Mg3 71 Burial 1) and shows the pattern of porosity indicative of possible
Figure 19, 31Or231 2351 Burial 1, mandibular ramus lesions indicating possible scurvy
Figure 20, 31Mg3 71 Burial 1, affected zygomatic arch showing possible scorbutic lesions
Raw frequencies for all pathological lesions were entered into SYSTAT (version 12.0) to
create two-way crosstabulations that were then combined to make tables showing the row
percentages and counts for each pathology based on sex, age category, site and period (Early,
Chapter 5
Results
The results section provides summaries and analysis of the frequencies of individuals
affected by the pathologies studied. The dental pathologies, carious lesions, alveolar infection,
and premortem tooth loss, are presented first in the Oral Health section and then the cranial
pathologies are presented in the Cranial Pathologies section including summaries of results for
porotic hyperostosis, cribra orbitalia, and scurvy. Tables are included to show the demographic
distribution for each of the pathologies. There is also a section that describes the other
pathological conditions observed in some of the individuals. A summary table has been
presented at the end of the section to illustrate the trends between the sample time periods for
each of the dental and cranial pathologies. The Summary of Results section includes some of the
major trends and most prominent frequencies for the site samples and period samples that will
lead into the conclusion section to provide a more concrete description of the patterns in
subsistence and health of these sample populations.
Oral Health
Anterior Carious Lesions
The number of carious lesions was counted based on size and location in the mouth.
Table 3 includes the summary of the frequencies of anterior carious lesions and the number of
observable individuals. The skeletal samples from Early Upper Saratown showed the highest
Forbush Creek samples showed the lowest percentage. The Middle period had the highest
frequency of individuals affected and the Late period had the lowest.
Table 3: Summary of Anterior Carious Lesion Frequencies
AGECAT A Adult
Total
SA Total
Affected %
Total Observed (N)
SEX M F I SA
% N % N % N % N % N
Early 36 11 39 18 43 7 39 36 13 8 34 44 Town
Creek
40 10 40 15 43 7 41 32 13 8 35 40
Forbush Creek
0 1 33 3 - - 25 4 - - 25 4
Middle 80 5 50 2 100 1 75 8 0 1 67 9
Wall 67 3 - - - - 67 3 0 1 50 4
Early Upper Saratown
100 2 50 2 100 1 80 5 - - 80 5
Late 44 9 71 7 50 2 56 18 30 10 46 28 Upper
Saratown
33 6 75 4 50 2 50 12 20 5 41 17
Posterior Carious Lesions
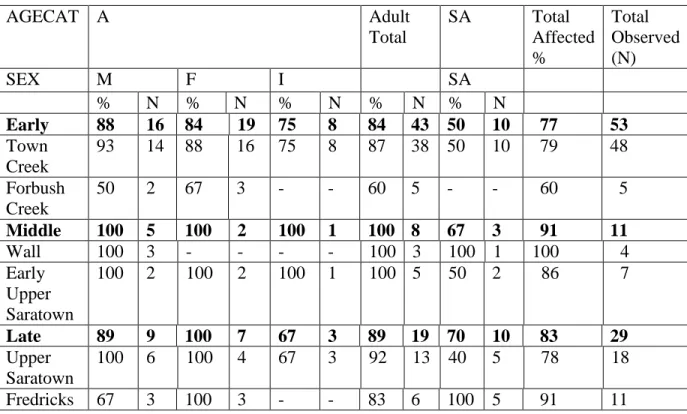
All samples had a high percentage of individuals affected by posterior carious lesions and
a summary of the frequencies and number of individuals observed can be seen in Table 4. The
Middle period had the highest percentage of individuals affected and the Early period had the
lowest. The skeletal samples from Wall had 100% of observable individuals having posterior
carious lesions. Forbush Creek skeletal samples had the lowest percentage of individuals
affected.
Table 4: Summary of Posterior Carious Lesion Frequencies
AGECAT A Adult
Total
SA Total
Affected %
Total Observed (N)
SEX M F I SA
% N % N % N % N % N
Early 88 16 84 19 75 8 84 43 50 10 77 53 Town
Creek
93 14 88 16 75 8 87 38 50 10 79 48
Forbush Creek
50 2 67 3 - - 60 5 - - 60 5
Middle 100 5 100 2 100 1 100 8 67 3 91 11
Wall 100 3 - - - - 100 3 100 1 100 4
Early Upper Saratown
100 2 100 2 100 1 100 5 50 2 86 7
Late 89 9 100 7 67 3 89 19 70 10 83 29 Upper
Saratown
100 6 100 4 67 3 92 13 40 5 78 18
Anterior Alveolar Infection
The summary of anterior alveolar infection data is included in Table 5. The skeletal
samples from Forbush Creek had the highest percentage of individuals affected by alveolar
infection in the anterior region of the mouth. Fredricks’ samples showed the lowest percentage of
individuals affected. The Middle period had the highest percentage of individuals affected with
the Late period just slightly lower than the Early period.
Table 5: Summary of Anterior Alveolar Infection Frequencies
AGECAT A Adult
Total
SA Total
Affected %
Total Observed (N)
SEX M F I SA
% N % N % N % N % N
Early 31 13 17 18 0 5 19 36 0 3 18 39 Town
Creek
25 12 13 15 0 5 16 32 0 3 14 35
Forbush Creek
100 1 33 3 - - 50 4 - - 50 4
Middle 40 5 0 2 0 1 25 8 - - 25 8
Wall 33 3 - - - - 33 3 - - 33 3
Early Upper Saratown
50 2 0 2 0 1 20 5 - - 20 5
Late 13 8 17 6 - - 14 14 25 4 17 18 Upper
Saratown
20 5 25 4 - - 22 9 0 1 20 10
Posterior Alveolar Infection
The Late period had the highest percentage of individuals affected by alveolar infection
in the posterior region of the mouth. The Middle period had the lowest percentage of individuals
affected. The skeletal samples from Upper Saratown had the highest percentage of individuals
affected. Samples from Wall and Early Upper Saratown had the lowest percentage. Table 6
presents a summary of posterior alveolar infection data.
Table 6: Summary of Posterior Alveolar Infection Frequencies
AGECAT A Adult
Total
SA Total
Affected %
Total Observed (N)
SEX M F I SA
% N % N % N % N % N
Early 62 13 45 20 0 5 45 38 0 4 40 42 Town
Creek
67 12 41 17 0 5 44 34 0 4 39 38
Forbush Creek
0 1 67 3 - - 50 4 - - 50 4
Middle 60 5 0 2 0 1 38 8 0 1 33 9
Wall 33 3 - - - - 33 3 - - 33 3
Early Upper Saratown
100 2 0 2 0 1 40 5 0 1 33 6
Late 67 9 67 6 - - 67 15 25 4 58 19 Upper
Saratown
67 6 75 4 - - 70 10 0 1 64 11