Monitoring Ligand Exchange Reactions on the Surface of PbS Quantum Dots
By
Hannah Elise Starr
Senior Honors Thesis Department of Chemistry
University of North Carolina at Chapel Hill
March 22, 2017
Approved:
Jillian Dempsey, Thesis Advisor James Cahoon, Reader
Table of Contents
I. Introduction/Background……….……….………3
II. Experimental……….………..7
i. General Considerations……….7
ii. NMR Spectroscopy………..7
iii. Absorbance Measurements……….7
iv. Hines and Scholes PbS QD Synthesis………7
v. Owen PbS QD Synthesis……….7
vi. Sample Preparation for 1H NMR Titrations………...8
vii. Sample Preparation for UV-Vis Titrations………9
viii. Sample Preparation for XPS Measurements………9
ix. Sample Preparation for Mass Spectrometry Measurements………...9
III. Comparison of Quantum Dots……….10
IV. 1H NMR Spectra………..11
V. UDA Exchange……….13
i. Overview……….13
ii. UV-Vis Titration………15
iii. Exchange Ratio……….15
iv. Total Ligand Coverage……….18
v. Equilibrium Constants………...18
VI. UDT Exchange………21
i. Overview……….21
ii. UV-Vis Titration………23
iii. Exchange Ratio……….24
iv. Total Ligand Coverage……….27
v. Equilibrium Constants………...28
VII. UDPA Exchange………31
VIII. Conclusions………...32
IX. Acknowledgements………..33
X. References……….34
I. Introduction/Background:
Semiconducting nanocrystals have greatly increased in research popularity in recent years.1 Extensive work has been completed to understand the mechanisms and kinetics of the growth of these materials through precursor tuning and development.2 With a better understanding of the morphologies of these nanocrystals, the focus is turning to processing such as patterning and deposition. These techniques require a deeper understanding of the nature of the surface of the nanocrystals however, and the effects of tuning and modification must be explored.3,4
Lead sulfide quantum dots (PbS QDs), a type of semiconducting nanocrystal, are particularly important materials for their absorbance and emission in the near-IR.5 Research groups employ PbS QDs for applications in solar cells, light-emitting diodes, photodetectors, and more.6 Despite their promise in a variety of applications, PbS QDs are understudied in the literature, especially in comparison to CdSe QDs.3
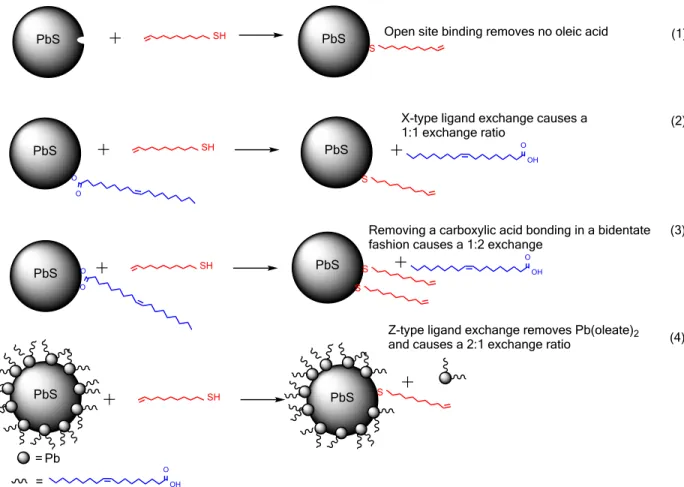
One area that has recently gained some interest is ligand exchange reactions on the surface of quantum dots. Ligand exchange reactions offer a way to probe the nanocrystal surfaces, and determine their response to various functional groups.4 In the work by Kroupa et al.. trans-2,6-difluorocinnmic acid was titrated into a solution of colloidal oleate-capped PbS QDs. The reaction was monitored via 19F NMR. A 1:1 ligand exchange was reported with an increasing equilibrium constant.7 Their research neglected to account for the replacement of native ligands with ligands containing different functional groups than the native carboxylic acid, for example a thiol or a phosphonic acid. The quantum dots they used for this experiment were synthesized according to the method of Owen et al.8 In related work, the Weiss group examined the exchange of surface-bound oleate ligands with fluoroalkanethiolates via 19F NMR. They observed decreased total ligand coverage, attributed to Z-type ligand exchange in which the thiolate displaces lead oleate (Pb(OA)2) from the surface of the nanocrystal (see Figure 2).9
irreversible displacement or an equilibrium process. Exchange ratios were quantified and for equilibria observed, Keq values were determined.
PbS SH PbS Open site binding removes no oleic acid PbS O O SH PbS S OH O
X-type ligand exchange causes a 1:1 exchange ratio
PbS O
O
SH PbS
S S
Removing a carboxylic acid bonding in a bidentate fashion causes a 1:2 exchange
OH O PbS = Pb = OH O
SH PbS S
Z-type ligand exchange removes Pb(oleate)2 and causes a 2:1 exchange ratio
S
(1)
(2)
(3)
(4)
Figure 2. Four possible binding motifs and their predicted exchange ratios.
The binding motifs will depend on the surface chemistry of the QDs and how they coordinate to native and incoming ligands. Research in the Owen group at Columbia University explores the coordination chemistry of QDs, and has demonstrated the variety of ligand exchange processes that can occur at the surfaces of nanocrystals, as highlighted in Figure 2.11 Owen reports that the coordination of surface atoms is weaker than that of core atoms, making them easier to remove. Further, Z-type ligands can be removed as a single entity, such as that shown in Figure 2 (4). In the work by De Roo et al. Z-type ligands are more easily displaced than X-type ligands in lead-rich PbS QDs, and could be displaced following a change in solvent polarity, or a dilution to the sample.4 The motifs presented in Figure 2 and the accompanying literature indicate that ligand exchange is often much more complex than simply removing one X-type ligand and replacing it with a similar X-type ligand.
II. Experimental:
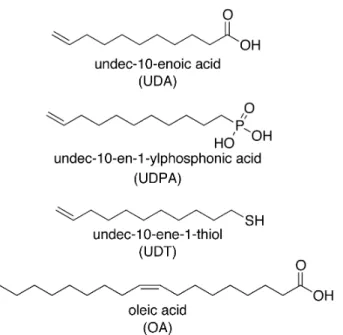
i. General Considerations. Standard Schlenk line techniques were utilized to maintain an inert atmosphere during synthesis of QDs, unless otherwise noted. Undec-10-ene-1-thiol (UDT) and undec-10-en-1-ylphosphonic acid (UDPA) were synthesized following previously reported procedures.10 Chloroform-d and toluene-d8 were purchased from Cambridge Isotopes
Laboratories and were used without further purification. All other reagents were commercially available from Sigma-Aldrich and used without further purification.
ii. NMR Spectroscopy. 1H NMR spectra were collected using 400 or 600 MHz Bruker NMR spectrometers. All spectra were recorded at 25 °C in eight scans with a delay time of 15 seconds.
iii. Absorbance Measurements. Absorbance measurements were recorded using a Cary 60 UV-vis absorbance spectrophotometer.
iv. Synthesis of PbS QDs via the method of Hines and Scholes (HS-PbS). PbS QDs were synthesized following a modified version of the procedure of Hines and Scholes (HS-PbS).12 Briefly, lead (II) oxide (0.450 g, 2 mmol), oleic acid (1.13 g, 4 mmol), and octadecene (14.0 g) were combined in a 50-mL, three-neck round bottom flask, and this mixture was stirred under vacuum at 100 °C for one hour (flask 1). Simultaneously, hexamethyldisilathiane (TMS) (0.211 mL, 1 mmol) and octadecene (4 g) were combined in a different 25 mL pear flask and degassed (flask 2). The lead mixture (flask 1) was placed under positive nitrogen flow and heated to 100 °C. The TMS mixture from flask 2 was injected rapidly into the lead mixture from flask 1 and allowed to stir for 1.5 minutes before the QDs were quenched in acetone and left in a sealed tube at room temperature overnight.
Batch A. The QD mixture was dispersed in six 15 mL centrifuge tubes and centrifuged (at 8500 rpm) using acetone (three times: 10 min, 10 min, 8 min) and methanol (two times: 8 min and 6 min) as the antisolvent. Yield was 550 mg, and QDs were stored dry until use. The first excitonic absorbance of the PbS QDs was centered at 896 nm, corresponding to a diameter of 2.9 nm as determined by the sizing curve from Moreels et al.13
Batch B. Batch B was done at twice the scale of Batch A. The QD mixture was dispersed in six 15 mL centrifuge tubes and centrifuged (at 8500 rpm) using acetone only (6 times: three at 10 minutes and three at 8 minutes). This resulted in 2.8 nm PbS QDs.
(2.50 g, 11.2 mmol) and acetonitrile (5 mL) were combined in a vial and were stirred in an ice bath for 10 minutes. Triflluoroacetic acid (0.175 mL) and trifluoroacetic anhydride were added to the solution and it was allowed to warm to room temperature. Oleic acid (6.36 g, 22.5 mmol), isopropanol (45 mL), and triethylamine (2.56 g, 3.53 mL) were combined in a round bottom flask. The solution from the vial was added to the solution in the flask and stirred until a white precipitate formed. The mixture was heated to reflux. The flask was allowed to cool to room temperature then placed in a freezer overnight. The solid was isolated via suction filtration and washed with methanol. The resulting lead oleate was dried under vacuum for >6 hours. The product was stored in a desiccator. To make the QDs, Pb(oleate)2 (2.94 g, 3.81 mmol, 1.5 eq.) and 1-octene (50 mL) were combined in a 100 mL 3-neck round bottom flask equipped with a stir bar, thermocouple, condenser, and stopper. The mixture was carefully degassed by vacuuming and refilling with nitrogen eight times to avoid solvent evaporation. In a 2-neck pear flask, N, N’-diphenylthiourea (0.581 g, 2.54 mmol, 1 eq.) and diglyme (1.67 mL) were combined and attached to a Schlenck line. Both flasks were placed under positive nitrogen flow and the lead mixture was brought to 95 °C. Once the temperature was stable, the thiourea solution was rapidly injected. The reaction was allowed to run for 60 seconds before being removed from the heating mantle. After the QDs were cooled to room temperature, the volatiles were removed under vacuum. The QD solution was split between six 15 mL centrifuge tubes filled with acetone, and centrifuged (8500 rpm, 10 minutes). The pale liquid was removed and the QDs were redispersed in pentane. Acetone was added and the QDs were centrifuged again. This cycle was repeated until the QDs had been cleaned six times. QDs were stored dry outside of the glovebox. The final PbS QDs had a diameter of 3.1 nm as determined by the sizing curve in Moreels et al.13
vi. Sample preparation for 1H NMR titrations. The NMR samples were prepared using a modifying literature procedure.10 Dried PbS QDs were dissolved in benzene-d6 to make a stock
solution. An aliquot was removed and diluted with benzene, and the concentration was determined from the absorbance at 400 nm, using published size-dependent extinction coefficients.13 50 µM samples of QDs were prepared in benzene-d
6. Ferrocene (0.5 µmol) was
time of 15 seconds. The multipeak fitting function in MestraNova was used to integrate peaks and determine the ligand concentrations and exchange ratios.
vii. Sample Preparation for UV-Vis Titrations. UV-Vis samples were prepared in a similar manner to the NMR samples. Stock PbS QDs were diluted to 25 µM in benzene in a 0.2 mm path-length cuvette. Ligand was added in 20 equivalent intervals, and the absorbance was recorded after each addition. In the phosphonic acid titration, time was also factored in at the end of the titration, as discussed in detail below.
viii. Sample Preparation for XPS Measurements. X-ray photoelectron spectroscopy (XPS) samples were prepared by drop-casting a dilute sample of PbS QDs suspended in benzene or pentane onto gold-coated silicon plates. Samples were run by staff members of the Chapel Hill Analytical and Nanofabrication Laboratory (CHANL) on a Kratos Axis Ultra DLD X-ray photoelectron spectrometer with a monochromatic Al Ka X-ray source.
III. Comparison of QDs:
We made two types of QDs, O-PbS and HS-PbS. O-PbS was a modified synthesis from the Owen group, where PbS QDs are made from a pre-synthesized lead oleate (Pb(OA)2) compound and thiourea precursor.8 HS-PbS QDs are made by forming Pb(OA)2 in situ during the initial stages of the reaction and then injecting hexamethyldisilathiane.12 The syntheses for O-PbS and HS-O-PbS QDs both utilize a hot injection method. The O-PbS QDs were purified via centrifugation in acetone with the exception of HS-PbS Batch A, which used both acetone and methanol.
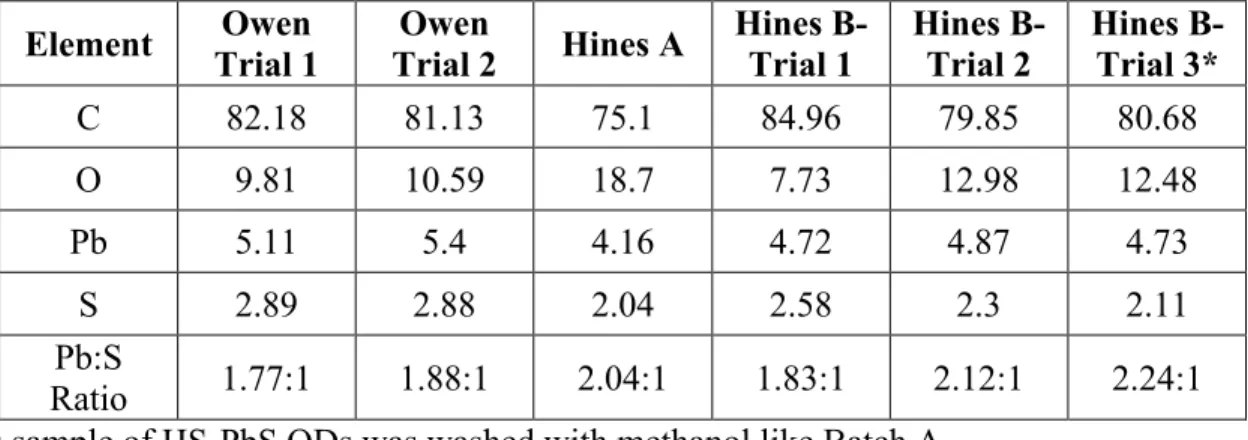
XPS was used to evaluate the Pb:S ratio in each batch of QDs. These results indicated that both O-PbS and HS-PbS are lead-rich, but the HS-PbS QDs have more lead.
Table 1. Atomic ratio percentages determined via X-ray photoelectron spectroscopy elemental analysis.
Element Trial 1 Owen Trial 2 Owen Hines A Hines B-Trial 1 Hines B-Trial 2 Hines B-Trial 3*
C 82.18 81.13 75.1 84.96 79.85 80.68
O 9.81 10.59 18.7 7.73 12.98 12.48
Pb 5.11 5.4 4.16 4.72 4.87 4.73
S 2.89 2.88 2.04 2.58 2.3 2.11
Pb:S
Ratio 1.77:1 1.88:1 2.04:1 1.83:1 2.12:1 2.24:1 *This sample of HS-PbS QDs was washed with methanol like Batch A.
IV. 1H NMR Spectra
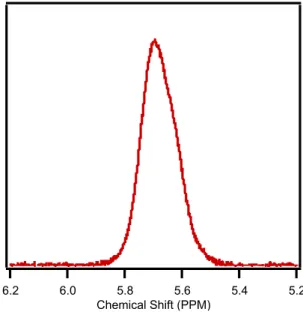
1H NMR spectra were collected throughout the titrations to determine ligand concentrations. Signals for the alkenyl protons (see appendix) of bound and free oleic acid were easily detectable around 5.65 ppm. This region of the spectra was otherwise clean, allowing space for ligand peaks to grow in (see Figure 4).
Figure 3 shows the region of interest for O-PbS. The surface-bound oleic acid provides a useful spectroscopic handle with a broad singlet at 5.65 ppm, corresponding to the alkenyl protons. The absence of peaks on either side leaves room for peaks attributed to the titrant ligand (discussed below). The asymmetry of the peak indicates that there is some free oleic acid initially in the O-PbS. This is also true for HS-PbS Batch B, but HS-PbS Batch A does not contain any initial free oleic acid. Figure 3 is the initial spectrum prior to any titrant, and the peak is a combination of free and bound oleic acid. Following titration, the free oleic acid peak from the alkenyl proton grows and shifts to about 5.55 ppm.
6.2 6.0 5.8 5.6 5.4 5.2
Chemical Shift (PPM)
Figure 3. O-PbS at 50 µM before the addition of any ligand.
V. UDA Exchange
i. Overview
To monitor the ligand exchange between oleic acid and the carboxylic acid terminated exchange ligand UDA, we titrated UDA into an NMR tube with 50 µM oleate-capped PbS QDs in benzene-d6, adding equivalents of UDA dissolved in benzene-d6, and acquiring an NMR
spectrum after each addition. The spectra were referenced against an internal standard, ferrocene. From these spectra, an increase of bound and free UDA and free oleic acid, as well as a decrease in the bound oleic acid peak was observed.
6.0 5.6 5.2 4.8
Chemical Shift (ppm)
Bound UDA
Bound UDA Free UDA
Free UDA
Free OA
Bound OA QD Only
20 eq 40 eq 60 eq 80 eq 100 eq 120 eq 140 eq 160 eq 200 eq
Figure 4. 1H NMR of 50 µM O-PbS QDs (3.05 nm, O-PbS) titrated with undec-10-enoic acid (UDA) in benzene-d6.
6.0 5.6 5.2 4.8
Chemical Shift (ppm)
Bound UDA
Bound UDA
Free UDA
Free UDA
Free OA
Bound OA +200 eq UDA
+200 eq OA
Figure 5. 1H NMR of 50 µM O-PbS QDs showing reversibility upon addition of oleic acid. After titration with UDA, dilution (by a factor of two), as seen in Figure 6, causes the bound oleic acid peak to decrease, indicating that some of the oleate dissociates. This has consequences on total ligand coverage, as the ligand coverage is concentration dependent. Despite the change in bound oleate, there is little change in the bound UDA, indicating that UDA binding to the surface of the QD is not as susceptible to dilution effects. As each 20 equivalent addition of ligand is 10 µL, the volume of solution can change by as much as 50% over the course of a titration. This means that ligand coverage is not solely based on ligand concentration in solution, but also on QD concentration.
6.0 5.6 5.2 4.8
Chemical Shift (PPM) UDA
UDA Diluted
ii. UV-Vis Titration
In addition to 1H NMR titrations, ligand exchange was also monitored qualitatively via UV-Vis spectroscopy, as seen in Figure 7.
0.6 0.5 0.4 0.3 0.2 0.1 0.0 N or ma liz ed A bs or ba nc e 1100 1000 900 800 700 600 500 Wavelength (nm) 0 eq 20 eq 40 eq 60 eq 80 eq 100 eq 120 eq 160 eq 200 eq 240 eq 320 eq 360 eq 400 eq
Figure 7. UV-Vis titration of O-PbS with UDA.
Titration with UDA showed very little change in the QD absorbance, as observed via UV-Vis spectroscopy. A slight blue shift of about 4 nm was observed at very high concentrations of UDA, but no major shift or loss of absorbance was detected indicating that titration with UDA does not significantly alter core structure of the QDs. The blue shift is indicative of a decrease in size of the QD.
iii. Exchange Ratio
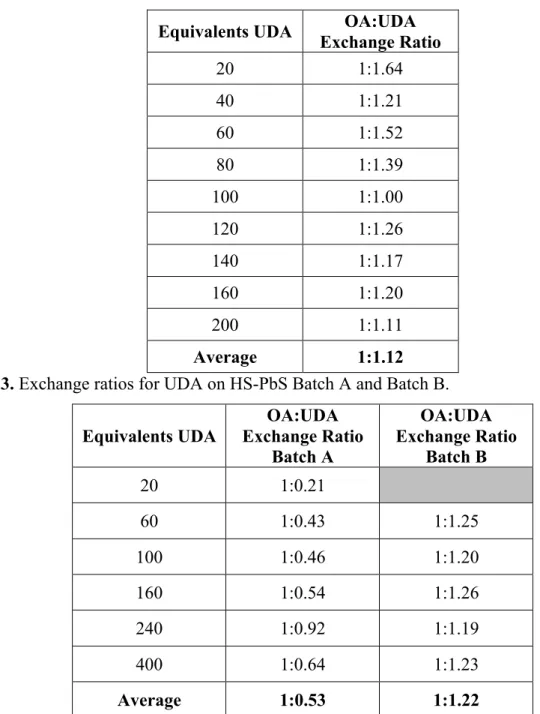
UDA exchanges with oleic acid on O-PbS in a nearly 1:1 OA:UDA exchange ratio, as summarized in Table 1 (the average was 1:1.12). The exchange ratios for HS-PbS varied depending of the samples, from 1:0.53 on average for for Batch A to 1:1.22 for Batch B. The equation for determining the ligand exchange is shown below:
Exchange=moles(OAfree,t)−moles(OAfree,i)
Table 2. Exchange ratios for UDA on O-PbS.
Equivalents UDA Exchange Ratio OA:UDA
20 1:1.64
40 1:1.21
60 1:1.52
80 1:1.39
100 1:1.00
120 1:1.26
140 1:1.17
160 1:1.20
200 1:1.11
Average 1:1.12
Table 3. Exchange ratios for UDA on HS-PbS Batch A and Batch B.
Equivalents UDA
OA:UDA Exchange Ratio
Batch A
OA:UDA Exchange Ratio
Batch B
20 1:0.21
60 1:0.43 1:1.25
100 1:0.46 1:1.20
160 1:0.54 1:1.26
240 1:0.92 1:1.19
400 1:0.64 1:1.23
Average 1:0.53 1:1.22
is much closer to 1:1. This suggests X-type ligand exchange, where each equivalent of UDA displaces one equivalent of oleic acid.
Differences between the two batches of HS-PbS (1:0.53 for Batch A and 1:1.22 for Batch B) are more difficult to understand. The Pb:S ratio and identical syntheses suggests that the material should behave similarly. The only difference in the synthesis was the purification and isolation method. Cleaning with methanol may weaken Z-type ligands, making them easier to remove, or methanol may displace Z-type ligands completely. If the Z-type ligands are weakened, the exchange ratio should favor oleic acid removal. If all Z-type ligands are removed prior to titration, the exchange ratio will either be 1:1 (X-type exchange) or it will favor UDA. Another possible cause of the differences could be due to aging.. Batch A was synthesized in June 2016, whereas Batch B was synthesized in January 2017. If there was any surface oxidation or QD degradation over time. this could affect the surface chemistry, and therefore alter how the QDs exchange.
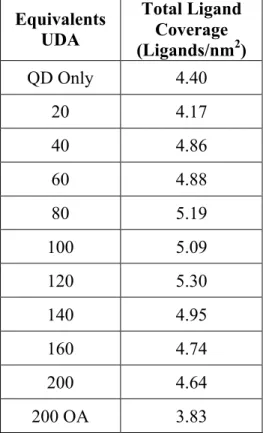
iv. Ligand Coverage
The ligand coverage was calculated by summing the bound oleic acid and the bound UDA. An in-depth representation of the calculation is found in the appendix.
Table 4. Total ligand coverage for O-PbS undergoing titration with UDA.
Equivalents UDA
Total Ligand Coverage (Ligands/nm2)
QD Only 4.40
20 4.17
40 4.86
60 4.88
80 5.19
100 5.09
120 5.30
140 4.95
160 4.74
200 4.64
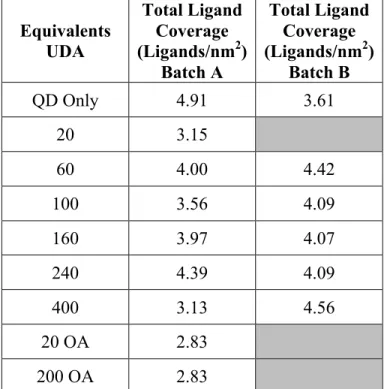
Table 5. Total ligand coverage for both batches of HS-PbS undergoing titration with UDA.
Equivalents UDA
Total Ligand Coverage (Ligands/nm2)
Batch A
Total Ligand Coverage (Ligands/nm2)
Batch B
QD Only 4.91 3.61
20 3.15
60 4.00 4.42
100 3.56 4.09
160 3.97 4.07
240 4.39 4.09
400 3.13 4.56
20 OA 2.83
200 OA 2.83
The total ligand coverage for O-PbS stays relatively consistent (within 4.17-5.30 ligands/nm2) across the titration, until oleic acid is added at the end, at which point the total ligand coverage decreases. The Owen group reports that their 3.4 nm PbS QDs have a total ligand coverage of 5.7 oleate ligands per square nanometer, which seems reasonable in comparison given that their QDs were slightly larger, and could have been in a more concentrated solution, which we hypothesize increases ligand coverage. This consistency in coverage is consistent with a ca. 1:1 exchange because for every ligand removed, a different ligand is added, thus keeping the total ligand coverage constant. Dilution causes slight ligand loss, as seen in Figure 7, indicating that part of the observed decrease in ligand coverage could come from the change in volume associated with the acid addition. This is currently being investigated via dilution studies. HS-PbS Batch A does not have consistent ligand coverage. Given the inconsistency in the exchange ratio, this is expected since there is no longer one ligand added for every one ligand removed. In contrast, HS-PbS Batch B has a more constant ligand coverage, similar to O-PbS. This can be understood given the more consistent (close to 1:1) ligand exchange ratio.
The reversibility of the ligand exchange with UDA was presented in Figure 5. Given the reversibility, an equilibrium expression, shown below, was used to determine equilibrium constants for each of the titrations. Note that analysis is slightly different for HS-PbS Batch A, for which non-stoichiometric exchange was observed. This will be discussed in Section VI, Part iii.
Keq=
[OA]F[X
−
]B [oleate−
]B[XH]F
Table 6. Equilibrium constants for the titration of O-PbS with UDA. Equivalents
UDA Keq
60 2.75
80 1.55
100 2.35
120 2.04
140 2.40
160 2.20
200 2.35
200 OA 2.42
Average 2.26 Table 7. HS-PbS equilibrium constants for titration with UDA.
Equivalents UDA
Keq Batch A
Keq Batch B
20 1.10
60 1.14 1.54
100 1.24 1.81
160 1.38 2.12
240 3.03 1.97
400 3.40 2.24
20 OA 3.48
200 OA 4.00
The equilibrium constants for O-PbS undergoing exchange with UDA are greater than 1 (K = 2.26). Equilibrium constants for HS-PbS Batch B are similar to each other. Larger variability in the equilibrium constants is observed for HS-PbS. For Batch A, the Keq value
increases across the course of the titration. This suggests that UDA binds more easily after oleic acid has been removed and a small amount of UDA binds. This could indicate different types of exchange over the course of the reaction. For example, first there can be Z-type exchange, followed by X-type exchange. Batch B does not follow this trend, but rather behaves similarly to O-PbS. Both of these batches were cleaned using only acetone rather than methanol, and XPS results showed a similar Pb:S ratio. The similar exchange ratios indicate that the ligands are likely binding in a similar fashion, and it does not appear that there is a large contribution from Z-type ligand exchange. This could indicate that the Z-type ligands are tightly bound to the surface that has not been treated with a protic solvent. The difference in cleaning is likely the cause of the variation between the HS-PbS constants. Batch A had no free oleic acid initially, while Batch B did. The large Keq values observed for Batch A suggest that oleic acid is more
readily displaced from these nanocrystals.
Kroupa et al. recently reported that exchange of oleate-capped PbS with a fluorinated carboxylic acid was accompanied by an increasing equilibrium constant.7 This is similar to our observations of UDA exchange on HS-PbS Batch A in Table 7. This suggests that the surface chemistry of the QDs used by Kroupa et al. is similar to that of HS-PbS Batch A in our studies, which is unexpected given that they used a prep similar to that of O-PbS. Despite this similarity, the Beard group reports a 1:1 exchange, which is not consistent with 1:0.53 for HS-PbS Batch A. However, it is worth noting that the exchange ratio was determined in a more qualitative manner in the Beard paper compared to our quantitative study. Indeed, they measured the number of titrant ligands on the surface after saturation, and because that value was within the error of the original ligand coverage, they considered this a 1:1 exchange. The coverage was only estimated at the initial time point and after saturation, without monitoring the evolution of ligand coverage during titration. While an increase in Keq was reported, it was attributed to a “cooperative effect”
VI. UDT Exchange
i. Overview
Next, to further probe the surface of PbS QDs and explore how they interact with different functional groups, the ligand exchange with a thiol-terminated ligand, UDT, was evaluated. The UDT titration was completed in a manner similar to UDA titration. Briefly, a 50 µM solution of oleate-capped PbS QDs was prepared in an NMR tube and a standardized solution of UDT was added over the course of a titration. 1H NMR spectra were acquired following each addition and referenced against an internal standard. Peaks corresponding to bound and free oleic acid and bound and free UDT were fit and used to calculate the exchange ratio, total ligand coverage, and equilibrium constant.
The NMR spectra recorded across the course of the UDT titration appear qualitatively similar to those recorded for the UDA titration. Specifically, both free and bound UDT signals are observed as UDT is titrated in, and the peak corresponding to free oleic acid grows in over the titration as oleic acid de-coordinates from the surface of the QD.
6.0 5.6 5.2 4.8
Chemical Shift (PPM) Bound UDT
Free UDT
Bound OA
Free Oleic Acid
Bound UDT
Free UDT QDs Only
20 eq 40 eq 80 eq 160 eq 200 eq
6.2 6.0 5.8 5.6 5.4
PPM
Bound OA Bound UDT
200 eq UDT 40 eq OA 200 eq OA
Figure 9. Titration of oleic acid following UDT titration indicates reversibility.
Addition of oleic acid following completion of the UDT titration (Figure 9) causes the bound oleic acid peak to increase, while the bound UDT peaks decrease. This indicates that UDT ligands are being displaced by oleic acid, and the reaction is reversible. In the literature, thiol binding to ZnS QDs and CdSe QDs is quite strong. It can replace native phosphonate ligands with ease, and drastically alter quantum yield.14 The results on PbS do not seem to be as drastic given the transient nature of the thiolate ligands.
2.60 2.56
2.52
Chemical Shift (PPM) 80 eq 160 eq 200 eq
Figure 10. Disulfide formation occurs when PbS QDs are titrated with UDT.
The alkenyl peaks of the disulfide appear at the identical resonances to the alkenyl peaks of the free UDT. As such, any quantification of free UDT must account for the additional disulfide, as discussed below.
Dilution of the PbS QDs following titration with UDT is slightly different than the dilution following UDA titration (Figure 11). Dilution does not lead to a decrease in the bound oleic acid peak, as observed in the UDA titration (Figure 6); by contrast, a decrease in the bound UDT signal is observed. This likely indicates that UDT is less tightly bound than the remaining oleic acid. This lability if the UDT ligands provides some further evidence into the reversibility of this exchange.
6.2 6.0 5.8 5.6 5.4 5.2 5.0 4.8
Chemical Shift (PPM) UDT
UDT Diluted
ii. UV-Vis Titration
Unlike UDA exchange, large absorbance changes were observed via UV-Vis absorbance spectroscopy for the UDT titration (Figure 12).
0.6 0.5 0.4 0.3 0.2 0.1 0.0 N or ma liz ed A bs or ba nc e 1100 1000 900 800 700 600 500 Wavelength (nm) A 0 eq 20 eq 40 eq 60 eq 80 eq 100 eq 120 eq 140 eq 160 eq 180 eq 200 eq 240 eq 280 eq 320 eq 360 eq 400 eq 0.6 0.5 0.4 0.3 0.2 0.1 0.0 N or ma liz ed A bs or ba nc e 1100 1000 900 800 700 600 500 Wavelength (nm) B
400 eq UDT 40 eq OA 400 eq UDT 80 eq OA 400 eq UDT 160 eq OA 400 eq UDT 240 eq OA 400 eq UDT 320 eq OA 400 eq UDT 400 eq OA 400 eq UDT 600 eq OA
Figure 12. A) UV-Vis spectra of the addition of UDT to PbS QDs. B) UV-Vis spectra of the addition of oleic acid following the UDT exchange.
iii. Exchange Ratio
The equation for the exchange ratio for UDT is the same as the exchange ratio for UDA, just with bound UDT rather than bound UDA. The exchange ratio for O-PbS is 1:1.55, and for HS-PbS Batch A, it is 1:0.785. The results, for two runs of O-PbS and HS-PbS Batch A, are shown below. The results for HS-PbS Batch B are not yet consistent enough to report.
Table 8. Exchange ratios for two runs for UDT titrations into 50 µM solutions of oleic acid-capped O-PbS QDs.
Equivalents UDT
OA:UDT Exchange Ratio
OA:UDT Exchange Ratio
20 1:1.41
40 1:1.44 1:1.14
80 1:1.42 1:1.55
120 1:1.51
160 1:1.56 1:1.77
200 1:1.61
240 1:1.73
320 1:1.80
400 1:1.64
Table 9. Exchange ratios for two runs where UDT is titrated into 50 µM solutions of oleic acid-capped HS-PbS QDs.
Equivalents
UDT Exchange Ratio OA:UDT Exchange Ratio OA:UDT
60 1:0.600 1:0.706
100 1:0.789 1:0.831
160 1:1.06 1:0.931
240 1:0.935 1:1.01
Average 1:0.782 1:0.788
The exchange ratios are drastically different for O-PbS and HS-PbS. The exchange ratio for O-PbS (1:1.55) indicates that each UDT equivalent displaces <1 oleate ligand. This suggests that UDT initially binds to open coordination sites and can also participate in 1:1 ligand exchange. There is also the possibility that the native oleate ligands bind in a bidentate fashion. Evidence for this bidentate binding has observed by the Cossairt group, where Gary et al observed bidentate binding crystallographically on In atoms in InP nanocrystals.16 Displacement of a bridging oleate by thiol, which cannot bridge two Pb ions could lead to a 1:2 displacement ratio. While Z-type ligand exchange cannot be completely ruled out, it seems unlikely that O-PbS exchanges with UDT via Z-type ligand exchange where a 2:1 OA:UDT exchange would be expected.
O O
PbS OH
O PbS
SH
S
X
X
Figure 13. The exchange ratio of OA:UDT where nonstoichiometric thiol/thiolate ligands displace OA.
Figure 13 will be useful when calculating the equilibrium constant, described below. Another important note is that the disulfide shows up with the signal for the free thiol at 5.15 ppm and 5.82 ppm, so this must be accounted for in the equilibrium constant calculations.
iv. Total Ligand Coverage
Table 10. O-PbS QDs of 3.1 nm diameter at a concentration of 50 µM were titrated with UDT.
Equivalents UDT Total Ligand Coverage (Ligands/nm2)
QD Only 4.37
20 4.01
40 4.21
80 4.40
160 5.26
240 5.15
320 5.33
400 5.99
20 eq. OA 5.95
Table 11. HS-PbS QDs of 2.9 nm diameter at a concentration of 50 µM were titrated with UDT.
Equivalents UDT Total Ligand Coverage (ligands/nm2)
QDs only 4.23
20 3.11
40 3.03
60 3.10
100 3.66
160 3.89
240 4.23
20 eq. OA 3.77
40 eq. OA 3.77
100 eq. OA 4.08
200 eq. OA 4.49
Ligand coverage increases for most additions of UDT in O-PbS QDs. Some exceptions are the lower additions, which are especially challenging to fit. More UDT is binding than oleic acid is being removed, so the total coverage is increasing. The slight drop in ligand coverage when the oleic acid is added is expected given the favorability for UDT over oleic acid.
For HS-PbS QDs, the ligand coverage drops initially, then increases again as more UDT is added. The coverage for the strictly oleic acid-capped QDs and the QDs after 240 equivalents of UDT were added was exactly the same. This could indicate that the presence of UDT causes rapid removal of ligands, likely Z-type ligands, then more regulation and binding to open sites after that initial drop to bring the QDs back to a stable coverage.
v. Equilibrium Constants
Keq=
[OA]F[UDT]B x
[oleate−
]B([UDT]F) x
[UDT]F =[vinyl−containing species]−[disulfide]
The above relationship is used for all exchanges that are not 1:1, excluding the disulfide formation when referring to UDA exchange.
Table 12. Equilibrium constants for 50 µM O-PbS QDs titrated with UDT.
Equivalents UDT Keq
80 5.23
120 4.30
160 3.60
200 2.75
40 eq. OA 2.87
200 eq. OA 3.06
Table 13. Equilibrium constants for 50 µM HS-PbS QDs titrated with UDT. Equivalents
UDT Keq
20 2.04
40 6.12
60 12.99
100 6.26
160 4.82
240 4.14
20 eq. OA 4.02
40 eq. OA 3.93
100 eq. OA 4.37 200 eq. OA 5.01
Average (Excluding the first three data
points)
4.65
VII. UDPA Exchange
The final ligand that was used for exchange was for the phosphonic-acid terminated UDPA ligand. UDPA did not behave at all like the other two ligands. In fact, it rapidly destroyed the PbS QDs, as indicated by the blue shift and significant decrease in absorbance over the course of the titration (Figure 14).
The initial trial of this exchange was monitored via NMR, just as UDA and UDT, but the NMR quickly began to show unexpected peaks that were broad and overlapped with the expected peaks. UV-Vis titration was used to elucidate the reactivity, as it could be carried out on a much shorter time scale. Figure 14 shows an initial blue shift, followed by a decrease in absorbance. A blue shift indicates higher energy, and smaller size for QDs. This degradation in the QDs could be attributed to the UDPA being strong enough to etch the QD. This is supported by the blue shift in the absorbance. Higher energy indicates a smaller QD, so it is possible that UDPA is stripping layers from the QD. An interesting observation was that the QDs did not crash out of solution following this degradation. Whatever product formed during this reaction must still remain soluble in benzene. No quantifiable information was obtained from UDPA titrations. 0.6 0.5 0.4 0.3 0.2 0.1 0.0 A bs or ba nc e 1000 800 600 400 Wavelength (nm) QD Only 40 eq 60 eq 80 eq 100 eq 120 eq 140 eq 160 eq 180 eq 200 eq 220 eq 240 eq 260 eq 300 eq 340 eq 380 eq 420 eq 460 eq 500 eq 500 eq 10 min 500 eq 20 min
VIII: Conclusions
i. Summary of Pertinent Conclusions.
Ligand exchange reactions between oleic acid-capped PbS QDs and UDA, UDT, and UDPA were monitored via 1H NMR and UV-Vis spectroscopy. The reaction with UDA was reversible with a product-favored equilibrium constant. The ligand exchange ratio was close to 1:1 oleic acid to UDA, with the exception of HS-PbS Batch A, which averaged 1:0.53.
The exchange with UDT was also product-favored. O-PbS exchanged in a 1:1.51 oleic acid:UDT exchange ratio while HS-PbS exchanged in a 1:0.782 oleic acid:UDT ratio. This indicates that the surface chemistry of these two types of PbS QDs is quite different, despite the lack of major difference in their Pb:S ratios. The equilibrium constants for each type of QD are different, but both are product favored. The total ligand coverage is consistent with the exchange ratios, and both O-PbS and HS-PbS bind to UDT reversibly. Dilution causes loss of UDT more than oleic acid, which is the opposite of what is seen in the dilution following UDA titration.
UDPA exchange irreversibly destroys both types of PbS QDS. Figure 14 shows the blue shift and the bleach in absorbance. Since the QDs degraded so quickly, no quantifiable information was obtained from their 1H NMR titration. All results are summarized in Figure 15.
O OO O
O O O O O O O O O O O O PbS
O OO O
O O O O O O O O O O O O PbS
S O O
S O O S S S O O PbS S SH OH O P O OH HO
Owen K
eq = 2.26
Hines B
Keq = 1.94
Owen K
eq = 3.63 Hine
s A Keq = 4.65
= =
ii. Future Work.
This project will continue with the final collection and analysis of titration data. Specifically, HS-PbS Batch B will be titrated with UDT to determine how it differs from the other two. Experiments for which inconsistent data sets were obtained will be examined more closely by completing additional titrations to determine more general trends and increase the reliability of the data. Inductively–coupled plasma mass spectrometry will be used to confirm the XPS results of the Pb:S ratio in each type of PbS QD.
iii. Project Directions.
This project was the continuation of the work summarized in Knauf, et al.10 Following completion of this project, this ligand exchange framework will be applied to CdTe QDs to gain a better understanding of their properties as well. One of the goals in the Dempsey lab is to link QDs together to create a QD dimer that can transfer an electron from one QD to the next. These dimers will need to be linked by a ligand that is connected to both QDs. Understanding how certain functional groups exchange or destroy the QDs is essential to finding a ligand bridge. Bridging ligands can promote charge transfer, therefore increasing the efficiency of solar devices made from QDs, and allowing QDs to be used for a variety of solar energy conversion applications.
IX: Acknowledgements
X: References
(1) Evans, C. M.; Cass, L. C.; Knowles, K. E.; Tice, D. B.; Chang, R. P. H.; Weiss, E. a. Review of the Synthesis and Properties of Colloidal Quantum Dots: The Evolving Role of Coordinating Surface Ligands. J. Coord. Chem. 2012, 65, 2391–2414.
(2) García-Rodríguez, R.; Hendricks, M. P.; Cossairt, B. M.; Liu, H.; Owen, J. S. Conversion Reactions of Cadmium Chalcogenide Nanocrystal Precursors. Chem. Mater. 2013, 25, 1233–1249.
(3) Boles, M. a.; Ling, D.; Hyeon, T.; Talapin, D. V. The Surface Science of Nanocrystals. Nat. Mater. 2016, 15, 141–153.
(4) De Roo, J.; De Keukeleere, K.; Hens, Z.; Van Driessche, I. From Ligands to Binding Motifs and Beyond; the Enhanced Versatility of Nanocrystal Surfaces. Dalt. Trans. 2016, 13277–13283.
(5) Cademartiri, L.; Montanari, E.; Calestani, G.; Migliori, A.; Guagliardi, A.; Ozin, G. a. Size-Dependent Extinction Coefficients of PbS Quantum Dots. J. Am. Chem. Soc. 2006, 128, 10337–10346.
(6) Hara, Y.; Gadisa, A.; Fu, Y.; Garvey, T.; Vrouwenvelder, K. T.; Miller, C. W.; Dempsey, J. L.; Lopez, R. Gains and Losses in PbS Quantum Dot Solar Cells with Submicron Periodic Grating Structures. J. Phys. Chem. C 2016, 120, 8005–8013.
(7) Kroupa, D. M.; Anderson, N. C.; Castaneda, C. V.; Nozik, a. J.; Beard, M. C. In Situ Spectroscopic Characterization of a Solution-Phase X-Type Ligand Exchange at Colloidal Lead Sulphide Quantum Dot Surfaces. Chem. Commun. 2016, 13, 13893–13896.
(8) Hendricks, M. P.; Campos, M. P.; Cleveland, G. T.; Plante, I. J.; Owen, J. S. A Tunable Library of Substituted Thiourea Precursors to Metal Sulfide Nanocrystals. 2015.
(9) Weinberg, D. J.; He, C.; Weiss, E. a. Control of the Redox Activity of Quantum Dots through Introduction of Fluoroalkanethiolates into Their Ligand Shells. J. Am. Chem. Soc. 2016, 138, 2319–2326.
(10) Knauf, R. R.; Lennox, J. C.; Dempsey, J. L. Quantifying Ligand Exchange Reactions at CdSe Nanocrystal Surfaces. Chem. Mater. 2016, 28, 4762–4770.
(11) Owen, B. J. The Coordination Chemistry of Nanocrystal Surfaces.
(13) Moreels, I.; Lambert, K.; Smeets, D.; De Muynck, D.; Nollet, T.; Martins, J. C.; Vanhaecke, F.; Vantomme, A.; Delerue, C.; Allan, G.; et al. Size-Dependent Optical Properties of Colloidal PbS Quantum Dots. ACS Nano 2009, 3, 3023–3030.
(14) Aguilera-Sigalat, J.; Rocton, S.; Sánchez-Royo, J. F.; Galian, R. E.; Pérez-Prieto, J. Highly Fluorescent and Photostable Organic- and Water-Soluble CdSe/ZnS Core-Shell Quantum Dots Capped with Thiols. RSC Adv., 2012, 2, 1632–1638.
(15) Shestha, A.; Yin, Y.; Andersson, G. G.; Spooner, N. a.; Qiao, S.; Dai, S. Versatile PbS Quantum Dot Ligand Exchange Systems in the Presence of Pb-Thiolates. Small, 2016, 1– 6.
Appendix
OH
O
H
H
Figure S2. Oleic acid structure with the alkenyl protons that produce the bound oleic acid signal
at 5.65 ppm highlighted.
Figure S2. Multifit function used on an UDA titration on O-PbS. The blue traces are the fits, the maroon trace is the 1H NMR spectrum, and the red along the baseline is the residual.
Calculations Using Moles:
Ferrocene was used as an internal standard. The amount of moles was determined by adding a known amount of a stock solution of known concentration.
mol Fc fit Fc =
mol OA
5fit OA
mol OA=mol Fc×5×fit OA fit Fc