PHYTOPLANKTON DYNAMICS OF TWO NORTH CAROLINA COASTAL PLAIN SWAMPS:
SPECIES COMPOSITION, SEASONAL PERIODICITY AND IMPACT OF WASTEWATER DISCHARGE
ACKNOULEDGEMENTS
1 would like to thank Dr. Edward J. Kuenzler for his interest, guidance,
and support of my research, as well as for keeping his sense of humor
throughout this research. 1 am also very grateful to Dr. Val H. Smith for his
advice and support during this project, particularly concerning problems with
statistical analyses. Dr. Charles M. Weiss provided positive criticism and
support during the preparation of this technical report. Drs. Peter H.
Campbell and Max Hommersand provide invaluable assistance in phytoplankton
identification. Dr. Campbell's manuscript of North Carolina phytoplankton was
also greatly appreciated. Alice Carberry and Tom Jones provided innumerable
hours of swamp trotting and lab analyses, as well as cheerful support. Many
volunteers helped with the field sampling: Tom Shahady, Randy Wynne, Laura
Yost, Alan Belenz, Joe Rudek, David Carberry, John Currie, and Rich Hall.
Sharon Long was especially helpful in field work, laboratory analyses, and late
night sustenance. Jim Fisher and Jay Sauber, N.C. Division of Environmental
Management, were helpful and encouraging throughout the study. The staff of
the D.E.M. analytical laboratory conducted chemical and biological analyses on
the samples collected after August 10, 1985. Special thanks must be given to
my husband, Michael, who courageously volunteered to go sampling, work in the
lab, and put data on the computer, and who was always understanding and
supportive.TABLE OF CONTENTS
Page
ABSTRACT ii
ACKNOWLEDGEMENTS iii
LIST OF FIGURE AND TABLES vi
INTRODUCTION
Wetland Values 1
Nutrient Removal by Wetlands 2
Algal Response to Nutrient Loading 3
Predictive Models 4Wetland Algae
Community Structure 5
Response to Pollution 5
Practical Implications 6
Objectives 7
METHODS 8
SITE DESCRIPTIONSCashie River 12
Brown Marsh Swamp 15
RESULTS
Natural Swamp Phytoplankton Community Structure 20
Sewage Lagoon Phytoplankton Community Structure 21
Spatial Variation Within the Swamps 22
Cashie River Impacted Phytoplankton Biomass and Community
Structure 23
Brown Marsh Swamp Impacted Phytoplankton Biomass and Community 24
Structure
DISCUSSION
Species Composition of Unimpacted Area of Swamp Stream
Comparison to Previous Studies 46
Phytoplankton Community Structure 47
Oxidation Pond Community Structure 49
Spatial Variation in Cashie River 49
Spatial Variation in Brown Marsh Swamp 51
Modelling of Chlorophylla Concentrations
Cashie River 54 Brown Marsh Swamp 55
Comparison to Published Models 56 CONCLUSIONS . 58
REFERENCES 63
APPENDIX: Two diskettes formatted for use with IBM personal computers and
compatible machines, written in Lotus 1-2-3. Files contain data on biovolumes
(um3/ml) of all algal species found.
Diskette Al: Brown Marsh Swamp data. Files: BIOVOLl.WKS = MAY THROUGH NOVEMBER BI0V0L2.UKS=DECEMBER THROUGH APRIL Diskette A2: Cashie River data. Files: CRBIOVOL = MAY THROUGH DECEMBER
LIST OF FIGURES AND TABLES
Figure Page I. Diagrams of the Brown Marsh Swamp and the Cashie River 19 2A. Cashie River Algal Class Variation 29 2B. Brown Marsh Swamp Algal Class Variation 30 3A/B. Cashie River Important Genera 31-32 4A/B. Brown Marsh Swamp Important Genera 33-34 5. Cashie River Important Spring Genera 35 6. Clarkton Lagoon Class Variation 36
7. Clarkton Lagoon Important Genera 37 8A/B. Cashie River Biovolume Variation 38-39 9A/B. Brown Marsh Swamp Biovolume Variation 40-41
10. Brown Marsh Swamp Similarities to Control 42 II. Brown Marsh Swamp Similarities to Effluent 43 12. Brown Marsh Swamp Class Variation: June, 1985 44 13. Cashie River and Brown Marsh Swamp Water Volume Variation 45 14. Cashie River Scatterplots of Chla Predicted by Models 59 15. Brown Marsh Swamp Scatterplots of Chla Predicted by Models 60
Tables
PHYTOPLANKTON DYNAMICS IN TWO NORTH CAROLINA COASTAL PLAIN SWAMPS:
SPECIES COMPOSITION, SEASONAL PERIODICITY, AND RESPONSE TO WASTEWATER DISCHARGE
Mary Beth H. Sutton
INTRODUCTION Wetland Values
Wetlands are valuable ecosystems which serve to interface land and water
systems. Saturation of the soil and type of vegetation are major criteria
which define wetlands (Cowardin, et al. 1979). These ecosystems supportdiverse plant and animal communities and the magnitude of primary productivity
in wetlands is of global importance. In addition, wetlands provide sanctuary
to many threatened and endangered species of plants and animals. Wetlandecosystems also have many valuable hydrologic functions. In palustrine
forested wetlands, commonly called swamps, the inundation of the soil varies with the season and the amount of precipitation and runoff. One of the predominant values of wetlands is their capacity to serve as sites of water retention and flood control. They are also traps for suspended sediments and nutrients, thus improving the water quality downstream (Carter, et al.,1979). Because of their potential to improve water quality, wetlands have also been used as tertiary treatment for municipal wastewater discharge (Brinson and
Westall, 1983; Richardson and Nichols, 1986), However, such uses are
inappropriate if using the wetland as a site for sewage treatment will alter the valuable ecologic and hydrologic functions of the wetland.
Nutrient Removal By Wetlands
Many studies have been done on wetlands receiving sewage effluent, but none has
nutrients and suspended solids from wastewater without detrimental effects on the wetland itself. Many studies have shown that the concentrations of
nutrients in the water are reduced downstream of wetlands, although the
wetlands seem to have a limited capacity to retain the nutrients. For example, some wetlands have become phosphorus-saturated and have lost their nutrient retention capacity (Dodd, et al., 1985; Nichols, 1983). Other wetlands are not
suited for tertiary treatment and will export nutrients in similar
concentrations to those entering the wetland (Schwartz and Gruendling, 1983).
The mechanisms of nutrient removal are physical and chemical as well as biological. Simple dilution plays a major role in many cases. Interaction with the sediments is thought to be one of the most important processes
involved, but perhaps this mechanism may be limited by the amount of nutrients the sediment can adsorb (Nichols, 1983). Biological uptake can also be an
important mechanism, but this is also limited to certain types wetlands or the time of year supporting the highest rates of primary productivity (Klopatek, 1978; Mudroch and Capobianco, 1979). Uptake by non-woody macrophytes (e.g. Carex sp., Typha sp., Sci rpus sp.) occurs at a higher rate than by trees, and
springtime blooms of attached filamentous algae can take up nutrients at a rate
comparable to macrophytes. Both Atchue, et al. (1983) and Brinson, et al.
(1981) found that the late winter/early spring filamentous algae bloom in
swamps accounted for as much nutrient uptake as the herbaceous macrophytes. This finding is particularly significant since it would allow swamps to retain nutrients before the summer growing season began (Atchue,et al., 1983).
Kuenzler, et al. (1980) and Yarbro, et al. (1984) also found a significant
3 Biological uptake occurs during the growing season. After fall dieback of
leaves and emergent macrophytes occurs, the nutrients are once again returned
to the water, although at this time the nutrients are typically released in a
different chemical form than at the time of uptake. The retention and
subsequent release of nutrients by emergent vegetation are beneficial in
improving water quality. The nutrients retained in the emergent vegetation are
not available for excessive algal growth in the growing season, there is
typically more water available for dilution in the dormant season, and the
nutrients are often re-released in forms unavailable to algae, such as in
lignins, cellulose or other plant material (Nichols, 1983).
It appears that the hydrology of the wetland is one of the most important
factors in determining the capacity of a wetland to take up nutrients since it
determines, among other things, the contact time between the incoming
nutrients, the biota and the sediments. Unfortunately, wetland hydrology can
also be difficult to quantify. It is particularly difficult in swamps with
many braided channels which can flood a width of several kilometers with a few
centimeters of water. Every wetland has its own hydrological system, so it
appears that to determine the feasibility of sewage disposal in a particular
wetland one must first study its hydrology, chemistry, and biology.
Algal Response to Nutrient Loading
In other water bodies, particularly lakes and rivers, the response of
biological communities to pollutant loading has been well studied. Many
in the suspended algal biomass, particularly in cyanophytes and ch lorophytes,
downstream of a sewage effluent discharge into the Susquehanna River (New
York). Olsen and Willen (1980) found that the phytoplankton biomass in LakeVattern (Sweden) increased with increased nutrient loading but decreased after
improved sewage treatment reduced the wastewater and nutrient loads. The
changes in algal biomass were also accompanied by shifts in speciescomposition, from oligotrophic species, mainly diatoms, to eutrophic species,
primarily blue greens, and then back to oligotrophic species following nutrient
diversion. The well known eutrophication and subsequent decrease inphytoplankton biomass of Lake Washington were also due to increased and
decreased wastewater and nutrient loading (Edmondson and Lehman, 1981). A
number of investigators artificially increased the nutrient concentrations inponds and lakes and found higher suspended algal biomass after increasing the
nutrients (for example, Schindler, 1974; DeNoyelles and O'Brien, 1978).
Predictive Models: Eutrophication, evidenced by increased nutrients and
phytoplankton biomass, has become a prime concern of those involved in lake
management. Many of the eutrophication studies use the phytoplankton biomassas estimated by chlorophyll a (chla) concentrations and correlate the changes
in chla to changes in nutrients and other factors (OECD, 1982). Dillon and
Rigler (1974), Canfield (1983), and Smith (1982) developed models which predict
chla concentrations from changes in nutrient concentration or nutrient loadingin the lake. Jones, et al. (1984) have developed similar models for prediction
of chla concentrations in streams. Models predicting summer biomass (Smith
1985, Smith, et al. 1987) and relative biomass (Smith 1986) of nuisanceWetland Algae
Community Structure: Studies of wetland phytoplankton, on the other hand, are
very rare, particularly for the Coastal Plain blackwater swamps. In two
studies in glacially formed peat bogs, diatoms and desmids dominated the
phytoplankton (Hayward, 1957; Duthie, 1965). A Lake Champlain marsh was
similarly dominated by diatoms (Schwartz and Gruendling, 1985). The
phytoplankton in the Porter Ranch Peatland (Michigan) was dominated by desmids
and other chlorophytes (Kasischke, 1974). Two studies have been done on the
phytoplankton of the Great Dismal Swamp in Virginia and North Carolina.
Marshall and Poore (1971) found desmids and diatoms dominated the summerphytoplankton community while Atchue, et al. (1983) found the phytoplankton in
1980 to be dominated by diatoms (Pinnularia sp.; Eunotia sp. ; Cymbella sp. ;
Tabellaria sp.). Other abundant algae which they found included cyanophytes,
(Osci1latoria sp.; Lyngbya sp.). the chlorophyte, Closterium sp., and the
chrysophyte, Mailomonas sp. Whitford and Schumacher (1963) did an extensive
survey of the phytoplankton of North Carolina rivers and streams including the
slow-flowing brown water streams in the Coastal Plain. They also found diatoms
and desmids dominated the phytoplankton community although chrysophytes
(Dinobryon sp. and Synura sp.) and chlorophytes (Eudorina sp. and Pandorina
sp.) were also fairly abundant. Cryptophytes were abundant in shallow, acidic,
blackwater lakes in Finland which have similar water quality to swamps(Ilamvirta, 1983; Arvola, 1983).
Biological Response to Pollution: Studies of the effect of pollution on the
phytoplankton of wetlands are also very uncommon. Stevens Brook Marsh
(northern New York), which received sewage effluent discharge, was dominated by
of studies, however, have examined the effects of wastewater on the growth of filamentous algae. Richardson and Schwegler (1986) performed bioassays in situ using the attached filamentous alga Cladophora sp., and found significantly
increased growth rates near the sewage outfall.
Practical Implications
In the coastal plain of North Carolina and many other coastal states,
small communities do not have the financial resources necessary to upgrade their sewage treatment facilities, although the Clean Water Act requires that they have tertiary treatment of their sewage. Since many of these communities are situated near swamps, the possibility of using the swamps as tertiary treatment would be a financially feasible way of meeting the EPA standards for
effluent water quality. The state of Florida grants wetland disposal permits
only after the state Department of Natural Resources has made a 1-year study to
determine the potential effects the effluent disposal might have on the wetland
(Larry Schwartz, Florida DNR, pers. comm. 1986). Although the blackwaters of the coastal plain swamps generally have low concentrations of nutrients, low conductivity, and low productivity (Kuenzler, et al. 1980), the dissolved
oxygen concentrations are naturally so low that the addition of wastewater
could cause anoxic conditions to occur. The lowest natural oxygen conditions also occur during the summer when the flow rate of the swamp streams might be zero. The ecological implications of wastewater discharge into specific swamps and the possibility of nutrient saturation also must be investigated.
The state of North Carolina has been considering permitting of wetland discharge for some time and has been studying a number of sites which were
as such (EPA, 1983). Two of the sites specially permitted to allow for
research on the effectiveness of Coastal Plain swamps for tertiary treatment
were the subjects of study by researchers at the University of North Carolina.
One study investigated the nutrient retention by the swamp and the effect on
the woody vegetation in one swamp (Kuenzler, 1987). The research presented
here was conducted in conjunction with the study by Kuenzler (1987) mentioned
above. The goals of this report were:
1. Characterization of the species composition and seasonal distribution
of phytoplankton in two Coastal Plain swamps.
2. Characterization of the species composition and seasonal distribution
of algae in the oxidation pond at Clarkton, NC.
3. Determination of the spatial variation in phytoplankton downstream of
the effluent input and the relation of the variation to physical and chemical
factors.
4. Comparison of the relation of the chlorophyll and nutrients in swamps
to other water bodies via use of empirical models.
8 METHODS
Samples were collected once a month from all stations. One grab sample
was collected for each of the nutrient analyses. Dissolved oxygen, pH, water
temperature and air temperature were determined while in the field. Nutrient
analyses of filterable reactive phosphorus, nitrite+nitrate, and ammonium via
E.P.A. approved spectrophotometric methods were performed in our laboratory
until after August 10, 1985, after which they were done in the analytical
laboratory of the N.C. Department of Environmental Management. Additional
analyses performed by the D.E.M included total phosphorus, total kjeldahl
nitrogen, chloride, biological oxygen demand, and fecal coliforms. A detailed
explanation of the methods and the results of the nutrient data can be found in
the report by Kuenzler (1987).
Phytoplankton Counting Methods
Col lection: At each station, two grab samples in 125 ml containers were
collected from just beneath the water's surface. Within one hour, one of the
bottles was preserved with Lugol's solution. The other sample was kept alive.
Both samples were kept on ice and in the dark until analysis.
Examination: The live samples were examined within 3 days. 15 ml of the live
sample was spun down in the centrifuge at the highest speed. The supernatant
was decanted off the material at the bottom. The algae were resuspended in the
remaining drop left in the tube which was then placed on a microscope slide to
9
The dead samples were examined using settling chambers. 1-30 ml of the
fixed sample was settled for quantitative identifications. The samples were
settled at least 1 hour for every 5 ml to insure complete settling. (Lund, et
al., 1958).
Counting Methods: After settling, the samples were examined using a Unitron
inverted microscope. First, the bottom of the chamber was scanned at a low
power to search for large, infrequent species. Then at a higher power
(200x-450x), the phytoplankton along transects of the bottom were identified and
counted until at least 100 specimens of the dominant species had been counted
or at least 300 specimens had been counted. If the phytoplankton was very
sparse and 300 specimens were not likely to be found, either one half or the
entire bottom would be counted. The number of fields were counted and the
counts converted to the number of cells/ml.
Biovolume estimates of most species were determined by either Dr. Peter
Campbell or the biological lab at the DEM. Those biovolumes not available from
these sources were determined measuring the dimensions of the algal cell and
estimating its volume using standard geometric formulas. The total biovolume
at each station was determined by multiplying the cells/ml by volume estimates
of the cells (Lund, et al., 1958).
Verification of the counting was made by recounting a number of samples
and comparing the results with the first count. Aid in identification was
obtained from Drs. Edward J. Kuenzler, Max Homraersand and Peter C. Campbell.
Phytoplankton keys used included those of Prescott (1962), Whitford and
Schumacher (1964), Cocke (1967), Reimer and Patrick (1966), Huber-Pestalozzi
of studies, however, have examined the effects of wastewater on the growth of
filamentous algae. Richardson and Schwegler (1986) performed bioassays in situ
using the attached filamentous alga Cladophora sp., and found significantly
increased growth rates near the sewage outfall.
Practical Implications
In the coastal plain of North Carolina and many other coastal states,
small communities do not have the financial resources necessary to upgrade
their sewage treatment facilities, although the Clean Water Act requires that
they have tertiary treatment of their sewage. Since many of these communities
are situated near swamps, the possibility of using the swamps as tertiary
treatment would be a financially feasible way of meeting the EPA standards for
effluent water quality. The state of Florida grants wetland disposal permits
only after the state Department of Natural Resources has made a 1-year study to
determine the potential effects the effluent disposal might have on the wetland
(Larry Schwartz, Florida DNR, pers. comm. 1986). Although the blackwaters of
the coastal plain swamps generally have low concentrations of nutrients, low
conductivity, and low productivity (Kuenzler, et al. 1980), the dissolved
oxygen concentrations are naturally so low that the addition of wastewater
could cause anoxic conditions to occur. The lowest natural oxygen conditions
also occur during the summer when the flow rate of the swamp streams might be
zero. The ecological implications of wastewater discharge into specific swamps
and the possibility of nutrient saturation also must be investigated.
The state of North Carolina has been considering permitting of wetland
discharge for some time and has been studying a number of sites which were
granted temporary wetland discharge as research sites. The EPA determined
as such (EPA, 1983). Two of the sites specially permitted to allow for
research on the effectiveness of Coastal Plain swamps for tertiary treatment
were the subjects of study by researchers at the University of North Carolina.
One study investigated the nutrient retention by the swamp and the effect on
the woody vegetation in one swamp (Kuenzler, 1987). The research presented
here was conducted in conjunction with the study by Kuenzler (1987) mentioned
above. The goals of this report were:
1. Characterization of the species composition and seasonal distribution
of phytoplankton in two Coastal Plain swamps.
2. Characterization of the species composition and seasonal distribution
of algae in the oxidation pond at Clarkton, NC.
3. Determination of the spatial variation in phytoplankton downstream of the effluent input and the relation of the variation to physical and chemical
factors.
4. Comparison of the relation of the chlorophyll and nutrients in swamps
to other water bodies via use of empirical models.
5. Determination of the importance of the phytoplankton community
8
^^ METHODS
Samples were collected once a month from all stations. One grab sample was collected for each of the nutrient analyses. Dissolved oxygen, pH, water
temperature and air temperature were determined while in the field. Nutrient analyses of filterable reactive phosphorus, nitrite+nitrate, and ammonium via E.P.A. approved spectrophotometric methods were performed in our laboratory
until after August 10, 1985, after which they were done in the analytical
laboratory of the N.C. Department of Environmental Management. Additional
analyses performed by the D.E.M included total phosphorus, total kjeldahl
nitrogen, chloride, biological oxygen demand, and fecal coliforms. A detailed
explanation of the methods and the results of the nutrient data can be found in
the report by Kuenzler (1987).
^If Phytoplankton Counting Methods
Co I 1ection: At each station, two grab samples in 125 ml containers were
collected from just beneath the water's surface. Within one hour, one of the
bottles was preserved with Lugol's solution. The other sample was kept alive.
Both samples were kept on ice and in the dark until analysis.
Examination: The live samples were examined within 3 days. 15 ml of the live
sample was spun down in the centrifuge at the highest speed. The supernatant
was decanted off the material at the bottom. The algae were resuspended in the
remaining drop left in the tube which was then placed on a microscope slide to
10
Diatoms: 15 ml of samples in which diatoms were among the dominant species
were spun down at high speed in the centrifuge. The supernatant was decanted
and the remaining organic matter was placed on a slide and burned off at high
temperature. A drop of Hyrax and a coverslip were then added to the slide.
After the slides were cooled, the dominant species of diatoms were identified.
The proportions of the different species were determined from the quantitative
counts (Peter Campbell, pers. comm., 1986).
Data Analysis
Data handling and graphics were done on a Leading Edge Model D personal
computer using LE Twin, Lotus 1-2-3 and Systat software packages.
The percent change in dilution of the sewage in the swamps was estimated
to give an approximation of the variation in water volume in the swamp stream.
This was accomplished by comparing the chloride concentration at stations
downstream of the effluent input to those of the effluent. The equation used
to estimate the percent change in dilution was:
WV0L=(1-(C.-C /C -C ))»100 1 c e c
where C. is the chloride concentration at the station, C is the chloride1 c
concentration of the control station, and C the chloride concentration of the
eeffluent. This calculation gave the change in dilution of the chloride.
Similarity indices were calculated to give an indication of the biological
similarity among stations. The calculation used the total biovolumes of the
phytoplankton species present at each station. The equation is the PSC percent
similarity index modified to include biovolume (Washington, 1984).
PSC=100-0.5 la-bl
where a and b are, for a given species, the percentages of the total sample
Stepwise aultiple regression analyses were performed on the two year data
set to see if any of the physical or chemical parameters which were measured,
such as water temperature, the variation in water volume present in the swamp,
or different species of phosphorus and nitrogen, could account for most of the
variance in chlorophyll a concentrations. Systat software was used for these
procedures.
12
SITE DESCRIPTIONS
Lewiston-Woodvi 1 1 e
The Lewiston-Woodvilie sewage treatment plant is located beside Highway
42/11 in Bertie County and discharges approximately 0.1 MGD of effluent
directly into the Cashie River. The sewage treatment plant is an extended
aeration package plant designed to overtreat the sewage by having low loading
rates and long detention times during the aeration treatment. It is a simple
activated sludge plant which, when operated properly, can give very
satisfactory treatment (J.C.Lamb,11 I personal communication,1986). However,
when the sludge is not removed from the plant on a regular basis, it will be
discharged with the effluent. This can cause problems for swamp dischargers.
A new sewage treatment facility is planned to be constructed between the
summer of 1986 and the summer of 1987. It will be an activated sludge plant
which discharges its effluent into the swamp using a perforated pipe.
The Cashie River at the point of'effluent input is actually a cypress-gum
swamp which is inundated for most of the year. During summer drydown, the
stream becomes intermittent and sewage accounts for all of the flow for
approximately 300 meters below the effluent input. The forest is dominated by
tupelo gum, black gum and red maple. Bald cypress is also present, as is
sweet gum, cottonwood, green ash, and holly. Saururus cernuus (Lizard's
Tail), Polygonum sp. and Carex lupulina are the most abundant herbaceous
macrophytes.
The Cashie River interconnects with the Roanoke River as they both empty
into the Albemarle Sound. The area of the watershed above the effluent input
2
is 62.1 km and the river's watershed area above the sampling site farthest
2
13
There were up to 9 stations sampled around the effluent input on the
Cashie River and on its tributaries (Figure 1).
1) Station 1 was 120 ra upstream of the sewage input above Hwy 42/11. The
swamp was closely bounded and encroached upon by agricultural fields to the
east and extensive timber cutting to the west. Since the cutting occurred,
the swamp forest was reduced to approximately 50 m wide. There was no water
present at this station during the summer drydown.
2 it 2A) Station 2 was in the swamp directly in the path of the sewage flow,
about 2 m away from the effluent pipe. It was in one of the braided channels
of the swamp. For about four months, the sewage flow was blocked by a fallen
tree which diverted the flow to another channel. During this time we sampled
the new sewage route as Station 2A, also about 2 m from the effluent pipe.
Uhen the sludge built up so much that it blocked the sewage flow to Station
2A, the sewage stream was rediverted back to Station 2. During dry weather,
some of the sewage also flows upstream and under the highway bridge, as
evidenced by a dye study performed by the DEM (Lewiston-Woodvi1le special
study report,1985) and by our water quality data (Kuenzler,1987).
3) Station 3 was about 30 meters downstream of the effluent input. The
vegetation was much the same, but more cypress trees were present. The main
stream is very shallow here (<0.3m). When flooded, the swamp is nearly 1 km
wide. ͣ<
4) Station 4 was about 200 meters downstream of the effluent input in the main
channel of the swamp, which was up to 0.7 ra deep. Macrophytes were common,
particularly Saururus cernuus. The stream and forest here contained many
fish, turtles, dragonflies, daraselflies, and numerous birds (e.g. kingfishers,
5) Station 5 was about 3.2 km downstream of the effluent input and was near
the junctions of many tributaries. Therefore, the swamp was very wide and
deep at this point. This site was less encroached upon by agricultural fields
and seemed undisturbed. This site is approximately 50 m upstream of the
junction of the Cashie River and the Uhatom Swamp. It was also about 600 a
downstream of the joining of the LD tributary from the west. We observed that the swamp here provided habitat for many animals and birds such as muskrat, raccoon, deer, heron, prothonotary warblers, kingfishers, anhingas, pileated
woodpeckers, yellow bellied sapsuckers, red headed woodpeckers, red eyed
vireos, blue gray gnatcatchers, barred owls, and many others.
6) WS was the station at which we monitor the Whatom Swamp. It was about 50 m
upstream of the bridge on SR1205. Many trees had recently fallen, presumably
because of strong winds, and the swamp was closely bounded by corn fields.
7) Station 5 was the furthest station downstream and was 4.5 km from the
sewage input. It appeared to be fairly undisturbed by humans since there were
many very large tupelo and cypress trees here draped with Spanish moss. The
flow was affected for a number of months at the end of the study when a beaver
dam backed up the water considerably. The dam also caused a significant rise in water level at Station 5. The site was 30 m upstream of the bridge over
SR1219.
8) Station LD was a dredged tributary to the Cashie which drained part of
Lewiston-Uoodvi1le and all of the N.C. Agricultural Experiment Station and its
fields. It was a small tributary whose flow doubled or trebled during heavy
runoff from the adjacent concrete roadside ditches. It was about 30 m
15 Clarkton
The sewage treatment facility at Clarkton is an oxidation pond which
previously discharged into a small ditch at a rate of about 0.1 MGD. The
ditch joined the swamp system about 750 m downstream. The discharge system
was altered in May, 1985 when pipes and pumps were installed to carry the
effluent to Brown Marsh Swamp where it was being discharged by a spray
aeration system.
An oxidation pond is generally 3 to 5 feet deep and can reduce the BOD
and suspended solids in the wastewater by 75 to 85% utilizing a complex
combination of treatment methods. The detention time for a simple oxidation
pond should be as long as 30 days with a one acre pond serving 200 to 300
people. Processes included in this treatment include settling of suspended
matter, aerobic and anaerobic digestion of organic matter, and further
reduction in BOD by biochemical reactions. Oxygen is primarily provided by the
photosynthetic activities of the algae which grow abundantly in the pond.
(J.C. Lamb, pers. comm., 1986). The single lagoon at Clarkton is also
sporadically aerated by a small boat being driven around it. The abundance of
algae proves to be a problem in small streams and swamps where discharge of
great amounts of algae increases the stress on the discharge ecosystem.
The Brown Marsh/Elkton Swamp system forms the Red Hill Swamp which is a
tributary to the Waccamaw River. The area of the watershed above the effluent
2
input is 235 km and the river's watershed to the last sampling station is
2 approximately 300 km .
There were up to 12 stations sampled around the previous discharge site
and along the swamp system and its tributaries (Figure 1).
1) BMS was on the Brown Marsh Swamp approximately 0.8 km upstream of the spray
tupelo gum, black gun and ash with some cypress; details of tree abundances
are given in Kuenzler (1987). The sampling site was about 40 m north of Hwy
211. The swamp was very shallow here, never exceeding 0.3 m deep during our
sampling and often being completely dry.
2) ES was on Elkton Swamp about 45 m north of Hwy 211. We sampled near the
head of a deep pool which often still had water when the swamp became
intermittent during summer drydown. The Elkton and Brown Marsh Swamps are
probably joined upstream of these sites at a railroad bridge. Therefore, both
were considered to be control stations for the study.
3)EFF was the effluent sample taken directly from the wetwell of the treatment
plant.
4) Station A was the first station sampled downstream of the sprayers in the
swamp. It was approximately 30 m south of the cross in the sprayer pipes.
The swamp here is primarily tupelo gum, black gum, cottonwood, ash, red maple
and cypress. Before the spraying began, a lush undergrowth of macrophytes was
also present. The sampling occurred in the deepest part of the stream, which
reached a maximum depth of 0.4 m. The sludge from the effluent accumulated
here in an unbroken blanket.
5)Station lA was a small channel which formed during periods of higher water
and branched off Brown Marsh Swamp just below the main pipe of the spray
system. At times this channel also received part of the effluent, but on most
sampling dates this station appears to be undisturbed. The sampling point was
marked by a break in a raised railway bed and the swamp forest here was
comprised of tupelo gum, red maple and some cypress.
6) Station B was 170 n downstream of the effluent discharge in a shallow
(maximum depth of 0.4 m) tupelo gum-dominated area. The sludge also formed a
17
at 228 m below the sprayers.
7) Station C was 320 m downstream from the sprayers, after the junction of the
two branches and below a deep pool at the junction. The tupelo gum/cypress
swamp was wider and the water deeper here. An old raised railway bed with big
gaps in it marked the site. Even the deeper sections of this part of the
swamp became isolated pools during the drought of the study year.
8) RHS was 4.5 km downstream of the sprayers on the Red Hill Swamp. The swamp
system is about 1.6 km wide at this point and has many braided channels. The
sampling point was on the main channel about 50 o above the second bridge from
the east on SR 1700. Tupelo gum, cypress, and red aaple dominated and many of
the cypress knees reached a height of 1.4 m. Macrophytes include Cyperus sp.
and Saururus cernuus. One time during the sampling period, this swamp was
reduced to a series of small pools.
9) SS was the sampling station on a tributary to the Brown Marsh Swamp called
2
Slades Swamp. It has a watershed area of 41 km and the joining of Slades and
Brown Marsh Swamps forms the Red Hill Swamp. Slades Swamp is a very shallow
swamp with abundant Saururus cernuus. The trees are mostly tupelo gum and red
maple. The sampling site is about 40 m upstream of the bridge on SR 1758.
10) UT was the station on the unnamed tributary which flowed beside the sewage
lagoon and into which the effluent was previously discharged. It is a dredged
ditch which also drains a number of agricultural fields.
11) BFCR was the station on Big Foot Creek which previously flowed through a
forest which had been clear cut near the beginning of our sampling period
(probably winter 1985). It is a shallow, blackwater creek and is very
responsive to heavy rainfall events which cause surges in its flow. BFCR and
UT join to form Big Foot Swamp. It is a small swamp and was only flooded once
12) BFB was the station on the main channel of Big Foot Swamp about 15 m below
the junction of UT and BFCR. its sediments are very deep and sticky and we
often sunk up to our knees while trying to sample. Part of the sediments are
likely residual sludge from the sewage effluent. The channel is dredged out
past our sampling point. The Big Foot Swamp joins Brown Harsh Swanp about 1
BROWK MARSH
SW.
134 lun»
ELKTON SW.
101 km'
NOT TO SCALE
HWY. 211 BMS , lES -0.80
0.03
BIG FOOT
CR 0.17
18 km'
BFCR
0.32
SLAOES SW 41 km'
CASHIE RIVER 62.1 km» LEWISTON
DITCH
8.6 km' km
-0.12
WHATOM SW. 31.7 kro»
1
\
1 / HWY.11-V r n
2 3
0 0.08
><^
ͣ
V c
S1ft> 1^
1219\ ' *
. 0.20 ./
NOT TO SCALE
/
/
' /
3.23, 6 4.55
1219
1
RD.RD. 1700
Figure 1. Diagrammatic maps of the Brown Marsh Swamp, the Cashie
River, and their tributaries, with watershed areas,
20
RESULTS
Natural Swamp Phytoplankton Community Structure
Total phytoplankton volumes were generally low in the two blackwater swamp
streams. For the Cashie River control stations, 1 and 6, the phytoplankton
3 3 7
biovolume ranged from 6.1x10 um /ml in November to a maximum of 1.64x10
3 5 3ua /ml in June. The median value was 5.1x10 um /ml, the mean value was
CO CO2.1x10 um /ml, and all of the values over 1x10 um /ml occurred from May
through September. The lowest biovolumes occurred during the winter months
when the amount of water in the swamps was high. For the Brown Marsh Swamp
control stations, BMS, ES and RHS, the phytoplankton biovolume ranged from
4 3 7 3
7.2x10 um /ml in August to 1.4x10 um /ml in September. The median value was
5 3 6 3
5.0x10 um /ml and the mean was 1.6x10 um /ml . There was much more scatter
in the biovolume data in the Cashie River, but lower values generally occurred
in the cooler months, except for June and August, when more water than the
summertime norm was in the swamps.
Both swamps also exhibited seasonal patterns in the species composition of
the phytoplankton communities. The Cashie River phytoplankton was dominated by
the Euglenophyceae from May through October, but the dominance pattern was more
complicated in the cooler months when smaller cryptophytes, chrysophytes and
chlorophytes vied for dominance (Figure 2A). One species of the
Chloromonadophyceae dominated in April. The same general pattern was exhibited
by the community of the Brown Marsh Swamp (Figure 2B). However, in summer the
euglenophytes shared dominance with other classes, primarily cryptophytes and
chrysophytes. The winter assemblages were dominated by cryptophytes and
chrysophytes, but they were more complex, and euglenophytes, baci1lariophytes,
21
Analysis of the control site species composition in both swamps showed
that the most inportant genera by percent composition by biovolume were
Trachelofflonas sp., Cryptomonas sp., Euglena sp., and Synura sp. (Figures 3, 4,
and 5); they often comprised over 75* of the total biovolume sampled. Certain
species within these genera were consistently important at both swamps. These
include Trachelomonas volvocina, Trachelomonas hispida, Cryptomonas marssoni i,
Cryptomonas erosa, Euglena chlamydomorpha, and Synura uve 11a. Other genera
which played an important role in the Brown Marsh Swamp were Chromulina sp.,
Phacus sp., Nitzschia sp., Polycystis sp., Chilomonas sp., Closterium sp.,
Chlamydomonas sp., Ma 11omonas sp. and Pheaster sp.(Figure 4). The spring was a
time of major transition, particularly at the Cashie River. From January to
April, 1986, the dominant genus in the Cashie River phytoplankton community
changed every month (Figure 5). These dominants included Synura sp., Pheaster
sp., Pleurotaenium sp., and Gonyostomum sp. When up to eight genera were
included, they nearly always accounted for over 75* of the total biovolume
sampled. In the Cashie River, other important genera include Phacus sp.,
Nitzschia sp. and Chlamydomonas sp.(Figure 3).
Although filamentous and attached algae were not systematically examined
in this study, they were very important in both swamps in the spring. Some of
the genera which grew extensively before canopy closure in the spring were the
chlorophytes Oedogonium sp., Spirogyra sp., Zygnema sp., and Mougeotia sp. and
the xanthophyte Tribonema sp.
Sewage Lagoon Phytoplankton Coratnunity Structure
The sewage lagoon at Clarkton also displayed marked seasonal variation.
Excluding the April sample which was taken in the stream into which the
8 300
6 3 7
September to 3.1x10 um /ml in March. The mean of the 11 months was 5.2x10
and the median was 4.0x10 . All of the values over 5.0x10 occurred in the
warm season, between June and September. The Euglenophyceae dominated the
lagoon phytoplankton community for half of the year, in the months of January,
May, June, October, November, and December. In July through September, the
Cyanophyceae dominated the community and in February, March, and April the
Chforophyceae dominated (Figure 6). In every month except August, one class
constituted over half of the biovolume of the lagoon phytoplankton community.
Analysis of the lagoon data showed that the most important genera, by
biovolume percent composition, were Euglena sp., Oocystis sp., Qsci1latoria
sp., Arthrospira sp. and, in June only, Pandorina sp. (Figure 7). The species
within these genera which occurred most frequently were: Euglena graci11s, E.
plsci formis, Oocystis parva, Qsci1latoria 1imosa, 0. chlorina. Arthrospira
jenneri, and Pandorina morum. Other genera which were important in the lagoon
phytoplankton community include the chlorophytes Actinastrum sp.,
Anklstrodesmus sp., Coelastrum sp., Chlore1 la sp., and the colorless
euglenophyte Menoidium sp. The species which were most common in these genera
were Actinastrum hantzschi i, Anklstrodesmus falcatus, Coelastrum microporum,
Chlorella vulgaris, and Menoidium pellucidum. Many species of the genus
Scenedesmus sp. were also commonly present, including S. quadricauda, S.
opoliensis, S. bi juga var.alternans, S. acuminatus, and S. dlmorphus.
Ni tzschia sp. was only important in the sample taken from the receiving stream.
Spatial Variation Within the Impacted Swamps
Each of these swamp systems received a point source input of sewage
effluent from a different type of treatment plant. The Lewiston-Uoodvi1le
treatment plant primarily added nutrients and suspended solids to the Cashie
23
to the Brown Marsh Swamp from its oxidation pond. These differences in the
treatment systems should result in different phytoplankton communities
downstream of the input.
Cashie River
Blomass: At the Cashie River, the effluent had little effect on the
phytoplankton relative to the control site. Although there was rarely much
phytoplankton within 2 m of the effluent pipe, higher total biovolunes were
found further downstream after the effluent stream became more fully mixed with
the swamp waters (Figure 8). The biomass of phytoplankton did not appear to be
overtly affected by the wastewater input since total biovolumes at sites
up-and down-stream of the effluent input were nearly always greater than the
effluent site, suggesting simple dilution. In addition, the patterns of total
biovolume varied widely with the highest biovolumes occurring at various
stations and sampling dates. The particular months when the biovolume of one
genus or species at a station was greater than 40X of the total biovolume for
that station were:
OCTOBER 1985 Station 1 44% Cryptomonas
NOVEMBER 1985 Station 2 89X Chlamydomonas
MARCH 1986 Station 5 48% Pleurotaenium
APRIL 1986 Station 5 48% Nitschia
In the winter months, there was less biovolume found at the stations, and the
biovolume at Station 2 was commonly close to or slightly larger than the next
station downstream. However, in many months of the year, two main patterns
emerged in the biovolumes downstream of the effluent input. In June, August,
September, January, and March, the total biovolume had a gradual increase to
24
October, and April, the maximum biovolume was found at Station 5. However, the
patterns in total biovolume were not consistent for more than two consecutive
months.
Community Structure; The structure of the phytoplankton community of the Cashie
River did not show any consistent variation downstream from the effluent
input. Similarity indices based on all species showed that Stations 1, 3, and
4 were very similar as were Stations 5 and 6, whereas Station 2 was very
different from the others.
Brown Marsh Swamp
Biomass: At Brown Marsh Swamp, where the sewage treatment system continually
discharged algae as well as suspended solids and nutrients into the swamp
stream, a clear pattern of biovolume change was seen downstream of the sewage
input by the spray diffuser system. In all months sampled, except the first
month that sewage was discharged into the swamp, the algal biovolume found in
the swamp decreased downstream of the input (Figure 9). In the cooler months,
the drop in phytoplankton biovolume downstream from the sprayers occurred very
rapidly and often dropped down to background swamp stream conditions within 300
m downstream of the sprayers .
Community Structure: The spray diffuser system began distributing effluent
into the Brown Marsh Swamp in early May, 1985. The initial impact on the the
phytoplankton community structure was that the natural phytoplankton community
was displaced by the lagoon phytoplankton. The contrast of the similarity of
station A to the effluent and controls from April to May illustrates the change
in species composition (Figures 10 and 11). In April, the sample from station
25
stations (Figure 10). After the spraying began in May, the community was
composed primarily of Euglena graci1 is, E.pisciformis. and other members of the
lagoon community (Figure 10). The percent similarity of station A to the
control stations in April was 47% whereas in May the similarity to the control
stations was only 8%. Conversely, the similarity of station A to the effluent
in April was only 12% but in May it was 76% similar to the effluent.
The species composition of the phytoplankton displayed a marked pattern
downstream of the sprayers. While the area within 100m was generally dominated
by species found in the sewage lagoon, farther downstream the natural
phytoplankton community of the swamp again became dominant (Figure 12). In the
summer, the change in algal dominants downstream is not evident at the class
level since the euglenophytes dominate both the lagoon and the swamp stream. A
change from only the genus Euglena to a combination of many species of
Trachelomonas and Euglena occurs in the swamp stream. A number of species of
the genera Phacus and Lepocinclis were also present in the swamp stream in
lower numbers. In addition, only two species of Euglena were found in the
lagoon, Euglena graci1 is and E. pisciformis while there were many species of
the four euglenophyte genera found in the swamp stream. Among those species
commonly found in the swamp stream are Trachelomonas vo1vocina, T.hispida,
T.granulosa, T.lacustris, T.acanthostoma, T.horrida. Euglena proxima. E.acus.
E. tripteris, E.chlamydomorpha, E.sprirogyra, Phacus longicauda, P.orbicularis,
P. curvicauda, P.inflexus, P.acuminatus. P.helikoides. P.pleuronectes,
Lepocinclis ovum. L.steini i, and L.fusiformis.
In the cooler months, the effluent algae did not dominate as far
downstream as in the warmer months. Percent similarity of phytoplankton
communities at different stations to the effluent also shows the change in
26
months, the stations within 300m of the effluent were generally more than 75%
similar to the lagoon but that dropped to about 50% similar or less in the
cooler months. Similarity to control stations show the opposite pattern
(Fi gure 10).
Blooms of cyanobacteria (Osci1latoria sp.) and purple photosynthetic
sulfur bacteria (Chromatium sp.) commonly occurred below the sprayers in the
spring and summer, covering the bottom of the swamp with dark blue-green mats
or pink patches. The cyanobacterial blooms commonly extended for over 50m. In
July at station B, Osci11atoria spp. (primarily Osci1latoria 1imosa) accounted
for 48% of the total phytoplankton sample collected. Another bacteria present
in the swa«p stream below the sprayers was the "sewage fungus", Sphaerotilus
natans. which would form long white filaments on top of the water and on the
bottom of the stream. There were also occasional phytoplankton blooms of
species not found in the sewage lagoon. For example, at RHS in June and ES in
October, Microcystis sp. respectively accounted for 49% and 45% of the total
phytoplankton sample at that station.
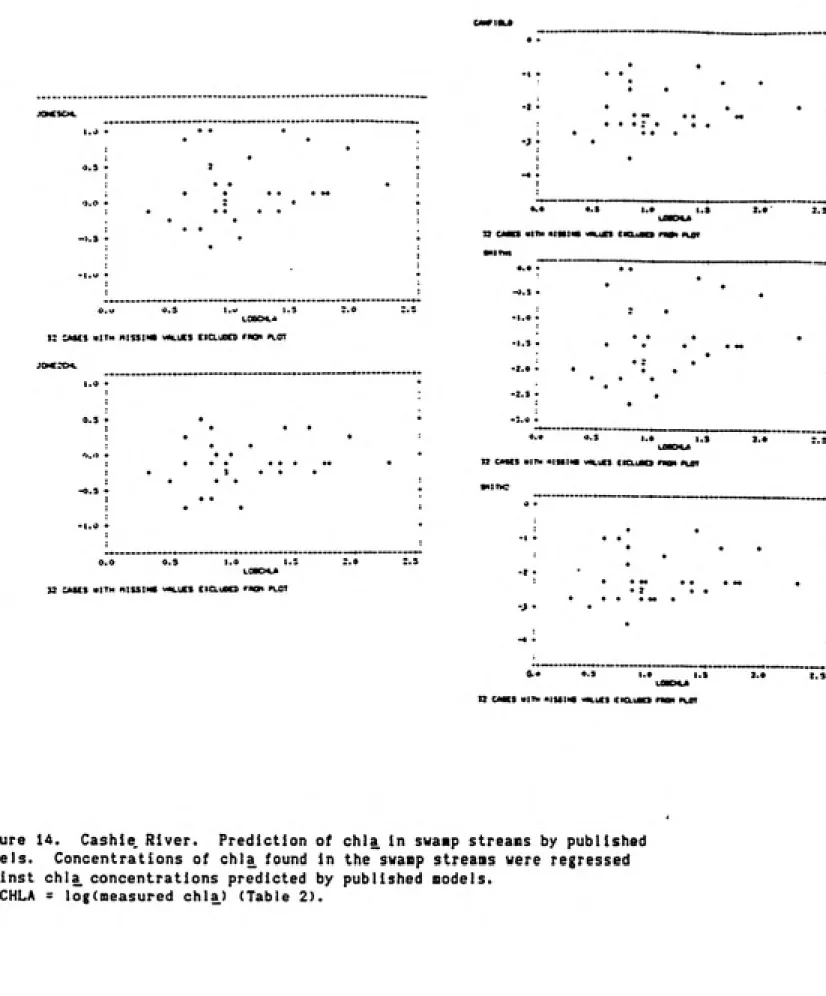
Variation in Chlorophylla Concentrations
Stepwise multiple regression analysis was performed on the chlorophyll and
physical and chemical data, in order to determine if the concentration of
chlorophyll covaried with any of the water quality parameters which were
measured and to see if predictive models could be formulated for swamp stream
chlorophyll concentrations.
Cashie River; The Cashie River chlorophyll values were generally very low. A
relatively small amount of the the variation in the chlorophyll concentrations
27
characteristics which were measured. Water temperature was a significant
(p<0.01) factor, which alone accounted for 31.3X of the chlorophyll variance.
The variation in two nutrient concentrations, those of total phosphorus and
nitrite+nitrate, were also significant factors. The multiple regression model
obtained utilizing all three factors is Equation 1.
(1) LOGCHLA= -0.141 + 0,467 TOTP - 0.309 LOGNOX + 0.039 WTEMP R'^=0.421 P<.05
The season of the year and the nutrient combined to account for about half of
the variance in the chlorophyll concentrations of the Cashie River.
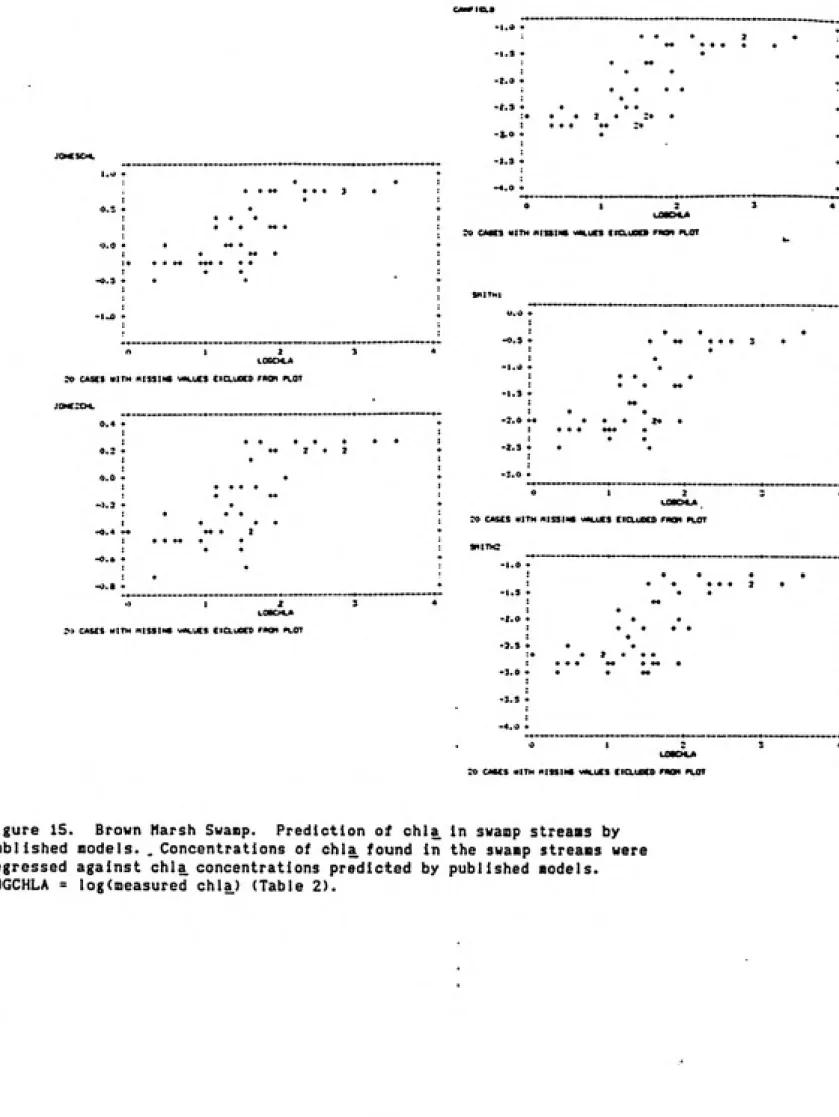
Brown Marsh Swamp: The variance in the Brown Marsh Swamp chlorophyll
concentrations was also significantly related to total phosphorus (p<0.05).
Total phosphorus(TP) alone accounted for 61* of the chlorophyll variance for
all stations and sampling dates (Equation 2)
(2) LOGCHLA = 1.768 + 0.786L0GTP R^=0.61
When only the data from the main stem sampling stations were used, the model
obtained included phosphate and nitrite+nitrate (Equation 3). Both total
phosphorus and total nitrogen were also significant, but more variance was
accounted for by phosphate and nitrite+nitrate.
(3) LOGCHLA = 2.571 + 0.454L0GN0X + 0.394LOGP04 R'^=0.65
For further analyses, the data was then divided into summer and winter data
28
significantly different models were obtained. The variation In water volume,
as estimated by chloride concentration, also was a significant factor and alone
accounted for 27% of the chlorophyll variance. When it was added to the
multiple regression model, however, it was not significant. The nutrients,
particularly nitrite+nitrate and orthophosphate, played the major role in
accounting for the variance in the chlorophyll concentrations in the Brown
29
[ZZ
J V///.
CASHIE RIVER CLASS DISTRIBUTION
CHLORO EUGLEMO BACCILAR CRYPTO CYANO CHRY30 CHLOROMO
^. TOTAL BIOVOLUME
125
100
75
50
25
-k
M S O N D n
TOTAL BI0V0L(uM3/ML)
10000000
3000000
8000000
-?000000
6000000
5000000
MOOOOOO
3000000
-2000U00
luOOOOO
-MONTH
Figrure 2A. Cashie River Phytoplankton
BROWM MARSH SWAMP CLASS DISTRIBUTION CHLORO EUGLEN BACILL CRYPTO CYAHO CHRYSO OINO
ͣ
<---T——r"
y X > n\\\
y. TOTAL BIOVOLUME
125
100
-H
M SON M
TOTAL BIOVOLluM3^mI)
5000000
MOOOOOO
-3000000
2000000
1000000
-^
M
Figrure 2B. Phytoplanhton class
distribution at Brown Marsh Swamp
S 0
MONTH
CASHIE RIVER IMPORTANT GENERA
SYNURA CRYPT0M0NA3 EUGLENA TRACHEL0M0NA3 PHACUS
Tl^^"^
NITZSCHIH CHLAnVDOnONAS
•-: TOTAL BIOVOLUME
100
50
25
-1 \ s )
K V. ^. \ "I
31
\ \' ^^^^B
\\\
^H
X X :/
-\\
^^^^^^H ^r—T- ͣͣ^H
1
i
M
\ N\ "^
TOTAL BI0V0Huf13/ML]i
10000000
9000000
SOOOOOO
7000000
6000000
5000000
MOOOOOO
-3000000
2000000
1000000
-0
m
1^ Mrm
J A MONTH
Figrure 3A. Distribution of Important
Genera in the Cashie River.
32
CASHIE RIVER IMPORTANT GENERA
SYNURA CRYPTONONAS PHEASTER TRACHELOMONAS QOHYOSTOMLfl
XX3
R??^
. 'ͣ ͣ- V ^WWI NITZSCHIA CHLAMYDOnONAS PLEUROTAENIUM
XZ3
TTT^
Vim
'/. TOT«. BIOVOLUME
100
i Q 0
n
TOTAL BIOVOLUME
1250000
1000000
750000
500000
250000
-MC3NTH
Fisrw* 38, DistriHrtion of Luportanf
33
BROWN MARSH SWAMP IMPORTANT GENERA
TRACHELOMONAS CRYPTOMONAS CKROMULINA PHACUS EUGLEMA
Effi] \ZZ2 KS3
NITZSCHIA SYNURA POLYCYSTIS
VZm EX3EX3
JiTOTAL BIOVOLUME
1
-0.75
05
-0.25
TOTAL BI0V0L(uM3/'ML)
6000000
5000000
MOOOOOO
-3000000
2000000
IfflHfflH)
-MONTH
Rgrurc MA. Important 9«n«ra of control
34
BROWN MARSH SWAMP IMPORTANT GENERA
TRACHEL0M0NA3 CRYPT0M0NA3 CLOSTERIUM PHACUS EUGLENA
KVvM
THITZSCHIA SYNURA PHEASTER
LIZ
X X >^
r^TOTAL BIOVOLUME 0.875 0.75 0.625 0.5 0.375 0.25 0.125
-0 -^
N~^H r>'
g
\v
i
XS
\\\^m
/ͣ / /m
n\X
x?<x:
N O -r F,-
ͣ
//
m
<A)
M TOTAL BI0V0LiuM3/ML) MOOOOO ͣ ; 350000 -300000 " 250000-m.
y y ' 'V V
m
200000150000
-100000 -
y/)
///J
r;-.-' T- 7,50000
-Vyx
XXXi
/ f—t.
\ \ \ "H
N. \ 1
XXY
kxx;
i/ /
rt ;xxx
Yxy
0 N 1... D r 1 J 10NTH - ]--F ---1 M
35
SYNURh
CASHIE RIVER IMPORTrtfST GENERA
PHEhSTER GONYOSTOIiUM PLEUROThENIUM
:; TOTAL eiOVOLUME
:"J n
30r
A
/ j
70
r-60
f-1 > j
50 H
j A
1
MOr
/ \ /
/ \/
X
30 '^
/ X/ \
20 k
ͣ
" /- /\
\ j j"\ \ j
10 r / \ , \ jI 1
i
n 1
\j^l-^
1 /
ͣ
•
ͣ
•
N J F
MONTH
Figrure 5. Distribution of Important
Genera in the Cathie River.
36
CLARKTON LAGOON CLASS DISTRIBUTION
CHLORO EUGLEN BACILL CRYPTO CYANO CHRYSO DINO
17777! K^^fV^
v. TOTAL BIOVOLUME
100
SX3
.\\\i
^
^
m
/
A
'A
/,
A
TOTAL BI0V0L(uM3^ml)
250000000
200000000
150000000
100000000
50000000
-MONTH
0 ^-f
Figrure 6. Clarkton Sewagre Lagroon
CLARKTON LAGOON IMPORTAMT GENERA
EUGLENA OOCYSTIS OSCILLATORIA PANDORINA ARTHROSPIRA
ͣ
7-7! k .A. A ..'ͣ A K V \ \
\ \ \ ^
ͣ
:—K—K]
ACTINASTRUM COELASTRUN NITZSCHIA
I 7^
i / \ / \ <•
K TOTAL BIOVOLUriE
T 1 -• 0.75 0.5 H 0.25
-^
yr^
/ A'A
'A
N M \ \ V/ /f%
\ n^
K A /n
V J / / J /. /11
\A
A ^/ 'A
y A ' A / /
/
N F 37 N TOTAL BI0V0L(uM3/ML) 175000000 150000000 125000000 H 100000000 -75000000 H 50000000 25000000 -i/
MONTHi 1
Figrure 7. Important genera of Clarkton's
38
riAY
CASHIE RIVER CONTROL STATIONS VARIATION IN PHYTOPLANKTON BIOVOLUnE
JUNE JULY AUGUST SEPTEMBER OCTOBER T^ f.—":—r—r—^
•; TOTAL BIOVOLUNE 90 n---SO H
70
SO
-50 -i
i
MO
30
-20 -in
10
0 JX
/ /' /
s
i
K
K
m
\TOTAL BIOVOLfuMS/ML)
20000000
17500000 i
15IJUUU00
12500000 -',
luuuOuOO
-500000 ^
5000000 -•
^500000
--SITE
Figrure 8A. Phytoplankton biovolume
39
CASHIE RIVER CONTROL STATIONS VARIATION IN PHYTOPLANKTON BIOVOLUNE
MOVEMBER DECEMBER JANUARY FEBRUARY MARCH APRIL
1
\////l
K TOTAL BIOVOLUME
100 190 80 70 60 50 MO -30 20 10
-0
ll^
n^
IJe
1
2
TOTAL BI0V0LfuM3/ML) 3000000 2500000 -jj
2000000 -i 1500000 -1 i I I1000000 -j
I
500000-in—n
ͣ
jDel
N
si
Hn r--nffln -,
K !
r
j
nN
N—« in I3 M
SITE
i
5
Figrure 3B. Phytoplankton biovolume
variation at stem stations.
i
N 1^40
BROWN MARSH SWAMP BIOVOLUME VARIATION
rtPRIL MAY JUNE
K \ V % ^
\ \ \ \i
JULY AUGUST SEPTEMBER
:: TOTAL BIOVOLUME
' 1
1
0.875 - ^
^
0.75 - s
-0.625 -
L'"
0.5
-1 s
1
0.375
-Si V
m
0.25 - *i^
i
1 s
1
i_
0.125
-1
1
:
>>
\ 1
0 -^
I r r I 1
BMS EM EFF B C RHS
TOTAL BIOVOLCuMS/MLi
250000000
200000000 -I
150000000 H
100000000 -\
50000000
-^JL
41
BROWM MARSH SWAMP BIOVOLUME VARIATION
OCTOBER NOVEMBER DECEMBER JANUARY FEBRUARY MARCH
E3S
\i' / /Tl-Ay. TOTAL BIOVOLUME
1
0.75
0.5
0.25
-1 n ^n p n
BMS EM EFF 6 RHS
TOTAL BI0V0L(uM3/ML.1
50000000
-1---MOOOOOOO H
30000000
20000000
10000000
-JL
BMS
r-iH ͣ
S
EM
fr.
SITE
..nr-.-^Bl-EFF B
Figure 98. PhytoplanKton biovolume
VAri^tion at ft«m stations.1^^
42
APRIL MAY
8R0WM MARSH SWAMP
SIMILARITY OF STATIONS TO CONTROL PHYTOPLANKTOri SPECIES COMPOSITION
JUINE JULY AUGUST SEPTEMBER
K V '. ', 1 K .', ,\,\ A r—7—7—] I V' V ' ^J
SIMILARITY 0.75 0.625 -i EFF 0.375 H SPRA SPRB STATION >PRC
OCTOBER HOVEMBER DECEMBER JANUARY FEBRUARY MARCH
SIMILARITY 0.75 0.625 H I I 0.5 -\ EFF Z
7----7----! i -. / \ / VJ
/ A i A A .'1
tM
-0.375 -|
V.
0.25-->
0.125 -"
- "
\ > 1—1 *1 / \
Nr«i '^
>0 ~ i 1
i>1
J
N
N SPRA SPRBSTATION
n
I
_L_i
K 1
ki
\
_ I
,1 'ͣ
SPRC
Figure 10. Brown Marsh Swamp, Slillarlty of phytoplankton species coaposition
43
BROWN MARSH SUAMP
ͣ
SIMILARITY OF STATIONS TO EFFLUENT PHYTOPLANKTON SPECIES COMPOSITION
APRIL MAY JLINE JULY AUGUST SEPTEMBER
ZZ3
SIMILARITY 1 0.875 0.75 i 0.&25 0.5 0.375 0.25 0.125 0 /In n
i
SPRA 3PRB SPRC EM
STATION
BMS RHS
OCTOBER NOVEMBER DECEMBER JANUARY FEBRUARY MARCH
t. \ \ S"K \ \ \
SIMILARITY 1 ~---0.875 -1 0.75
in
J
0.625 0.5 0.375 -0.25 -1 II I0.125 ^| I
ii I 0 -U_l ir n KlkJ .ͣ1/ 'l\ V ^Ni
il
If
SPRA 3PRB SPRC EM
5TATI0N
EMS P.H3
AA
BROWN MARSH SWAMP CLASS DISTRIBUTIOM
JUME 1385
CHLORO EUGLENO BACCILAR CRYPTO CYANO CHRYSO DINO
K%^ rXYH 177771 R-nX\1
\ \
v. TOTAL BIOVOLUME
100
75
50
25
-\
CON EFF 6 RHS
TOTAL BI0V0HuM3/ML)
CON
ouuuuuuu ^
50000000
MOOOOOOO
-.
KV
k \ N
30000000 -*
ͣ
\\
20000000
10000000
-•!
!ͣ
i
' I
K^
1—i—rn0 - \ 1 1 1 1
EFF A SITE
e RHS
45
SHOWN UAMSH SWAMP STA. ͣ WATtP» OCPTM
a. ar
i
§
X
8
a
0.08
0.06
-0.0*
BROWN MARSH SW. EXCESS CONOUCTVirr'
CA5HIC Riven EXCESS CONOOCTIVITY
MONTH STA. 3
1989-1»e8
Figure 13. station B watar dapth (A) and axcaaa con«»»f^^^i^y <^>„**^.,
Brown Marah Swamp; axcaaa conductivity in tha Caahia Rivar
DISCUSSION
Phytoplankton Species Composition of the Unimpacted Swamps
Comparison to Previous Studies: Similarities observed in phytoplankton
community composition between the Brown Marsh Swamp and the Cashie River
differed from those communities observed in other wetlands. In the Cashie
River and other blackwater rivers in the Coastal Plain of North Carolina,
Whitford and Schumacher (1963), in the only other study of wetlands with
flowing water, found many of the same genera as found in this study, although
in different frequencies. However, other studies, including two in the Great
Dismal Swamp, described very different phytoplankton communities (Table 1).
Other studies consistently found that diatoms played major role in the algal
flora whereas in the Brown Marsh Swamp and the Cashie River, they only were
abundant for a short time in the spring (Figures 2A and 2B). Only one station
on the Cashie River, Station 5, always had diatoms, mainly long filaments of
Eunotia pectinalis. This species was commonly found by Uhitford and Schumacher
(1963). In addition, the Cryptophyceae dominated in both swamps many months
of the study year but were not even mentioned by Whitford and Schumacher.
However, their enumeration methods did not allow for identification of very
small flagellates, so it is possible cryptophytes were missed in the counting,
llmavirta (1982) and Arvola (1983) found cryptophytes dominated the
phytoplankton of shallow, acidic, brownwater lakes in Finland, whose summer
water chemistry is very similar to the winter water chemistry in these swamps.
The euglenophyte dominance found in the Cashie River and the Brown Marsh Swamp
in the summer (Figures 2A and 23) has not been noted in other swamp