Abstract
HIV reservoirs are major barriers to the eradication of this infection despite the widespread use of combination antiretroviral therapy. Antiretroviral drugs have restricted entry into the brain due to the inherent complexities of this tissue (e.g. uniquely structured blood-brain barrier, presence of efficient efflux pumps) which makes the brain an ideal potential anatomic reservoir for HIV replication. Cerebrospinal fluid (CSF) and plasma blood concentrations are often used to
approximate drug concentrations within brain tissue; however, for reasons previously listed, drug concentrations in these compartments do not necessarily reflect those in the brain. The objective of this study was to evaluate the extent of penetration of select antiretroviral agents into the brain tissue of two preclinical models of HIV infection: rhesus macaques (n=6) and humanized mice (n=12). Liquid chromatography-tandem mass spectrometry (LC-MS/MS) was used to quantify efavirenz (EFV), emtricitabine (FTC), and tenofovir (TFV) in blood plasma, CSF, and brain tissue. EFV penetrated best into brain tissue in both animal models, and was up to 3.1-fold higher in macaques versus mice (p=0.026). FTC and TFV penetration into brain tissue was 1.3 to 25-fold higher macaques (p=0.004 and p=0.093, respectively). In infected macaques, the CSF-to-plasma ratios (CPRs) for TFV and FTC were 1.6 and 4-fold higher than the brain tissue-to-plasma ratio (TPR). CPRs for the remaining macaque samples were 1.3 to 61-fold lower than the TPRs, suggesting that more drug is getting into the brain tissue compared to the CSF. These results illustrate that CSF drug concentrations may provide underestimations of the penetration of antiretrovirals into brain tissue, and that HIV infection may result in lower brain tissue drug concentrations.
Introduction
More than 1.2 million people in the United States are currently infected with the human
immunodeficiency virus (HIV) and almost 1 in 8 (12.8%) are unaware of their infection. 1 HIV
can progress to acquired immune deficiency syndrome (AIDS) which is characterized by having a severely compromised immune system, making those with AIDS more susceptible to life-threatening complications from opportunistic infections or certain cancers. Though first discovered several decades ago, HIV/AIDS remains a major global health concern as there is currently no cure or universal vaccination available to combat this deadly disease. Combination antiretroviral therapy (cART), the use of a combination of three or more antiretroviral drugs, can suppress HIV replication and slow or stop progression to AIDS. Despite this, the virus rebounds to its pre-cART level in the plasma of nearly all patients after interrupting treatment, even in those with previously undetectable plasma viral loads, 2 indicating that current antiretroviral
treatment options only control viral replication within the blood and do not allow for complete eradication of the infection.
HIV establishes a viral reservoir rapidly after infection and these reservoirs are capable of re-establishing viremia soon after discontinuation of antiretroviral therapy.3 Some of the infected
2 | Moody
these areas of the body could represent a major barrier to HIV cure efforts and must be considered in all HIV curative strategies.
HIV crosses the blood-brain barrier and enters the central nervous system early during infection and can cause persistent infection and inflammation.5 Both HIV DNA and RNA have been found
within the brain and CSF from persons at all stages of HIV disease, including those receiving antiretroviral therapy.6-7Continuous inflammation in the brain resulting from HIV infection may
lead to neurological complications such as HIV-associated dementia or mild neurocognitive disorder. Neurocognitive impairment ranging from subtle to severe remains common among people with HIV despite widespread use of cART, according to findings from the large CHARTER study in 2010.8 In one study, 87% of individuals diagnosed with HIV-associated
dementia were found to have genetically distinct HIV variants in their CSF that were not detected in the periphery, 9 suggesting that independent viral replication occurs in the central
nervous system of HIV infected patients with severe neurological disease.Viral mutations accumulated during this time can lead to drug resistance which may cause certain antiretroviral drugs that effectively suppress plasma viral loads to have limited effects on the mutant viral strains residing within the central nervous system.
Several studies have shed light on the phenomenon of HIV viral escape.10-12 HIV CSF viral
escape can be defined as the presence of detectable HIV in the CSF of patients with undetectable plasma HIV RNA levels. One study reported data on 11 HIV infected patients with neurological symptoms and HIV CSF viral escape while receiving combined antiretroviral therapy.12 The
median CSF HIV RNA level was 880 copies/mL and patients had been receiving stable
combination antiretroviral therapy for a median of 13 months (range: 10-32 months). Eight of 11 patients had a plasma HIV RNA level < 50 copies/mL, and 3 had plasma HIV RNA blips with their CSF HIV RNA level > 1 log higher than their plasma HIV RNA level. Additionally, resistance associated mutations were detected in 7 of 8 CSF HIV RNA genotypic strains.12 Such
studies note the remarkable discrepancy between plasma and CSF HIV viral loads, showing how the virus may be present in the CSF even in the absence of detectable plasma HIV RNA levels.
Antiretroviral (ARV) drugs differ considerably in their ability to cross the blood-brain barrier,5
preventing some of these agents from easily accessing the brain tissue.With restricted access to the brain, these drugs are limited in their ability to exert their full effect, thus allowing for ongoing HIV replication and reservoir development within this compartment. Absent the ability to perform brain biopsies on patients receiving antiretroviral therapy, it is difficult to determine the relative penetration of these drugs into human brain tissue. Currently, CSF drug
concentrations are used as surrogate markers for assessing antiretroviral exposure within the central nervous system; however, the absolute correlation between the two compartments is unknown. Evidence from preclinical and clinical studies suggests that drug concentration in CSF seems to be reasonably accurate in predicting drug concentration in the brain.13-15 However,
3 | Moody
As evidenced above, the central nervous system is an essential compartment to consider when evaluating HIV treatment, prevention, and curative strategies. The purpose of this study was to quantify the commonly used antiretroviral agents efavirenz (EFV), emtricitabine (FTC), and tenofovir (TFV) in the brain tissue of two preclinical models of HIV infection: rhesus macaques and humanized mice by liquid chromatography-tandem mass spectrometry (LC-MS/MS). Rhesus macaques and humanized mice are two well-known preclinical models of HIV infection that have allowed for more invasive investigation of HIV infection and also for preclinical testing of anti-HIV therapies for more than 20 years.17 These specific drugs were not only chosen for the
popularity of the fixed-dose, “one pill once daily” regimen, but also chosen because of their different physiochemical properties. EFV is a small, lipophilic molecule that has central nervous system side effects when used therapeutically. Conversely, FTC and TFV are small, hydrophilic molecules that do not cross the blood-brain barrier as easily as EFV. My hypothesis is that there is a substantial difference in the extent of drug penetration into the central nervous system and, although convenient, measurements of CSF concentrations may not be an accurate estimation of antiretroviral drug concentrations within brain tissue. Furthermore, ongoing inflammation associated with HIV infection compromises the blood-brain barrier and may lead to increased antiretroviral drug concentrations with the central nervous system.
Methods
Two commonly used preclinical models of HIV infection were used for this study: rhesus macaques and hu-HSC-Rag humanized mice. Male rhesus macaques (Macaca mulatta) between 3 and 7 years of age were dosed once daily with EFV 200 mg orally, TFV 30mg/kg
subcutaneously, and FTC 16 mg/kg subcutaneously for 10 days. A total of 6 macaques were used, 3 of which were uninfected and 3 of which were infected with simian-human
immunodeficiency virus (SHIV). SHIV infected macaques were infected intravenously with 104.5
TCID50 of RT-SHIVmac235, with viral loads measured weekly after inoculation. ARV drug dosing
ended once 4 weeks of durable HIV infection was established, and a final viral load was measured during therapy. One day after the final ARV dose was administered, animals were euthanized and underwent necropsy. Blood plasma, CSF, and brain tissue were collected during necropsy.
Two cohorts of female hu-HSC-Rag humanized mice, aged 3-6 months (n=6 each) were used for this analysis. Flow cytometry was used to quantify the extent of humanization at baseline and at 4 weeks post-infection. In the first cohort, HIV infected humanized mice (n=3) and uninfected humanized mice (n=3) were dosed with EFV 10 mg/kg once daily for 10 days. In the second cohort, HIV infected humanized mice (n=3) and uninfected humanized mice (n=3) were dosed once daily with TFV 208 mg/kg and FTC 240 mg/kg for 10 days (Figure 1). All drugs were administered by oral gavage, and dosing solutions were prepared by solubilizing formulated drug. HIV infected mice were infected intraperitoneally with 200 L 2.1 x 10⁶ IU/mL HIV
Bal D7.
4 | Moody
final ARV dose was administered, animals were euthanized and underwent necropsy. Blood plasma and brain tissue were collected during necropsy. The antiretroviral drug doses used for each animal model were chosen based on commonly used treatment doses that have been
previously studied in HIV cure strategies.18-21 All samples were snap frozen on dry ice and stored
at -80°C until analysis.
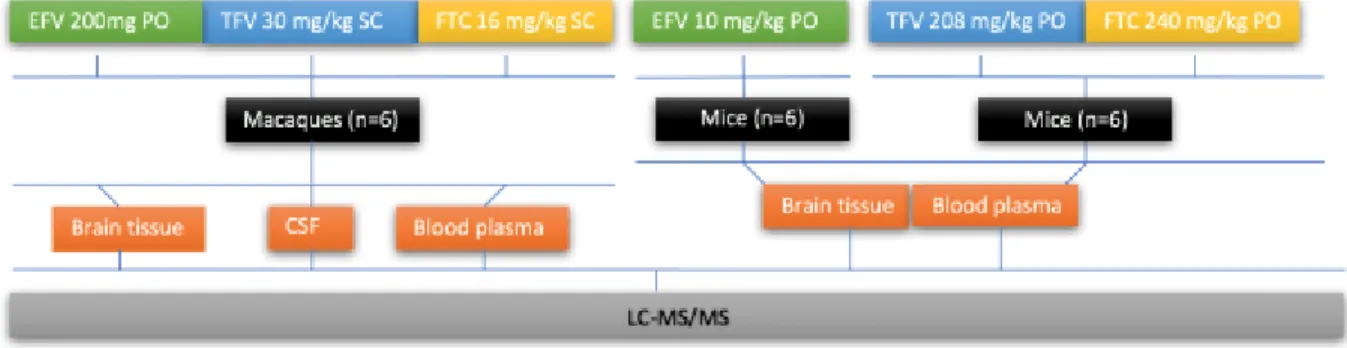
Figure 1: Schematic Representation of the Study Design
All six macaques (3 uninfected; 3 infected with SHIV) were dosed daily with EFV, TFV, and FTC for 10 days. Six mice (3 uninfected; 3 infected with HIV) were dosed once daily with only EFV for 10 days. The other six mice (3 uninfected; 3 infected with HIV) mice were dosed once daily with TFV and FTC for 10 days.
Liquid chromatography coupled with tandem mass spectrometry (LC-MS/MS) was utilized to quantify drug concentrations within CSF, blood plasma, and brain tissue samples. Brain tissue was sliced into 10 µm serial tissue sections for mass spectroscopy imaging analyses not included in this study. For this study, a single 10 µm slice was homogenized for 3 cycles of 60 seconds at 5500rpm in 1 mL of 70:30 acetonitrile-1mM ammonium phosphate with a Precellys 24 tissue homogenizer (Bertin Technologies, Montigny-le-Bretonneux, France). Plasma, CSF and tissue homogenate samples were extracted by protein precipitation with methanol with stable,
isotopically labeled 13C
5-TFV, 13C15N2-FTC, and d5-EFV added as internal standards. A
Shimadzu high-performance liquid chromatography system was used for separation, and an AB SCIEX API 5000 mass spectrometer (AB SCIEX, Foster City, CA, USA) equipped with a turbo spray interface was used as the detector under negative ionization for TFV and EFV and positive ionization for FTC. Tissue homogenates were analyzed with a set of 10 calibration standards and 3 quality control samples. Plasma and CSF were analyzed with a set of 11 calibrations standards and 5 quality control samples. The analytical range for tissue homogenates was 0.01-50ng/mL, while plasma and CSF had a calibration range from 1-20000ng/mL. The precision and accuracy of the calibration standards and the quality control samples were within the acceptable range of 15%.
Standard curves were used to determine drug concentrations in each sample using tissue slice area to calculate the concentration of each drug per mL of sample. Macaque brain tissue areas were measured experimentally, and mouse brain tissue slice areas were estimated at 80 mm2.
5 | Moody
tissue-to-plasma ratios (TPRs) were calculated for each sample. CPR and TPR ratios are indicators of drug penetration from plasma into the CSF, and from plasma into brain tissue, respectively. TPRs >1 indicate that there is a higher concentration of drug in brain tissue than blood plasma, while a ratio <1 indicates that there is a lower concentration of drug in brain tissue than blood plasma. A ratio of one indicates that there is equal concentration in brain tissue and blood plasma. CPRs are interpreted similarly. CPRs were compared to TPRs in macaques to determine how well the CSF reflects brain tissue antiretroviral concentrations. TPRs were used to compare drug penetration into brain tissue across macaque and mice species. Wilcoxon rank sum tests were used to compare TPR values for infected vs uninfected animal cohorts, pooled mouse and pooled NHP values were used for interspecies comparisons. P values less than 0.05 were considered statistically significant.
Results
Table 1 shows the median ARV drug concentrations and ranges for macaques (NHP) and humanized mice. Figures 2, 3, and 4 show the interspecies drug comparison for FTC, TFV, and EFV respectively.
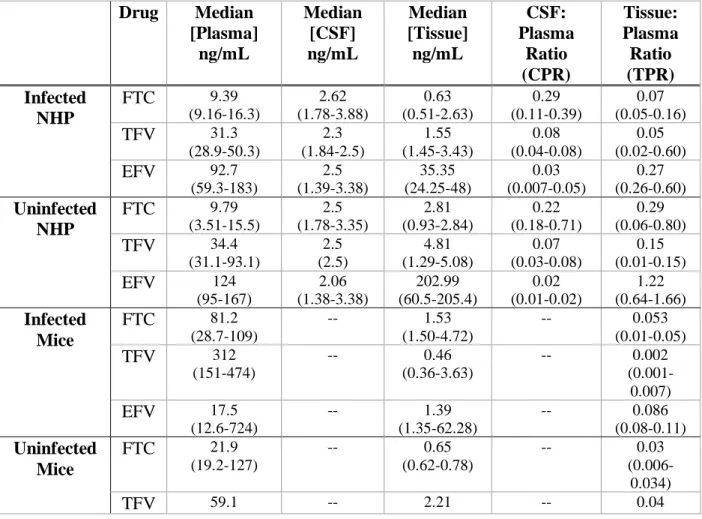
Table 1: Median Drug Concentrations in Macaques and Humanized Mice
Drug Median
[Plasma] ng/mL Median [CSF] ng/mL Median [Tissue] ng/mL CSF: Plasma Ratio (CPR) Tissue: Plasma Ratio (TPR) Infected NHP
FTC 9.39
(9.16-16.3) 2.62 (1.78-3.88) 0.63 (0.51-2.63) 0.29 (0.11-0.39) 0.07 (0.05-0.16)
TFV 31.3
(28.9-50.3) 2.3 (1.84-2.5) 1.55 (1.45-3.43) 0.08 (0.04-0.08) 0.05 (0.02-0.60)
EFV 92.7
(59.3-183) 2.5 (1.39-3.38) 35.35 (24.25-48) 0.03 (0.007-0.05) 0.27 (0.26-0.60) Uninfected NHP
FTC 9.79
(3.51-15.5) 2.5 (1.78-3.35) 2.81 (0.93-2.84) 0.22 (0.18-0.71) 0.29 (0.06-0.80)
TFV 34.4
(31.1-93.1) 2.5 (2.5) 4.81 (1.29-5.08) 0.07 (0.03-0.08) 0.15 (0.01-0.15)
EFV 124
(95-167) 2.06 (1.38-3.38) 202.99 (60.5-205.4) 0.02 (0.01-0.02) 1.22 (0.64-1.66) Infected Mice
FTC 81.2
(28.7-109)
-- 1.53
(1.50-4.72)
-- 0.053
(0.01-0.05)
TFV 312
(151-474)
-- 0.46
(0.36-3.63)
-- 0.002
(0.001-0.007)
EFV 17.5
(12.6-724)
-- 1.39
(1.35-62.28)
-- 0.086
(0.08-0.11) Uninfected
Mice
FTC 21.9
(19.2-127)
-- 0.65
(0.62-0.78)
-- 0.03
(0.006-0.034)
6 | Moody
(10-62.8) (0.80-2.28) (0.035-0.08)
EFV 3.57
(2.74-4.23)
-- 1.34
(0.73-2.12)
-- 0.49
(0.17-0.60) *Ranges in parentheses
*Sufficient mouse CSF volume could not be collected
TPR values for FTC in macaques ranged from 0.05-0.80. Brain tissue penetration of FTC was 4-fold higher in uninfected versus infected macaques (p=0.40) despite similar penetration of drug into the CSF, although this did not reach statistical significance. Conversely, mouse data showed FTC tissue penetration approximately 2-fold higher in infected animals (p=0.40), but this also did not reach statistical significance. Overall, mouse TPR values were up to 9.7-fold lower than corresponding macaque values (Figure 2; p=0.004).
Figure 2: FTC Interspecies Comparison
The Y axis represents median FTC TPR values. Each species is identified on the X axis, with blue bars representing infected animals and orange bars representing uninfected animals. Error bars represent FTC TPR range values. Macaque TPR was 1.3 to 9.7-fold higher than mice TPR for FTC brain penetration. Infected macaque FTC TPR was 1.3-fold higher than infected mice. Uninfected macaque FTC TPR was 9.7-fold higher than uninfected mice TPR.
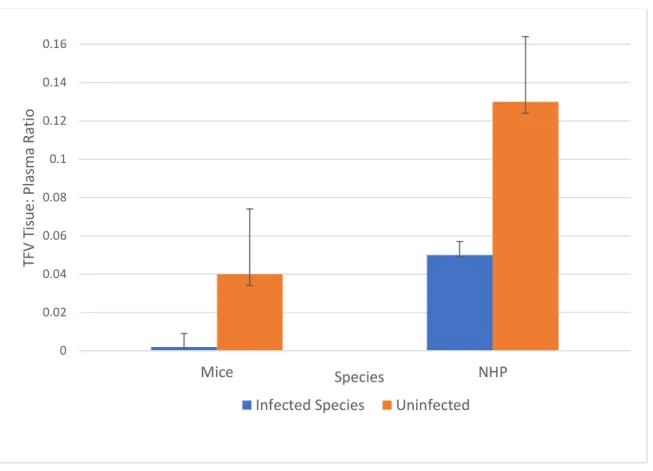
TPR values for TFV in macaques ranged from 0.01-0.60. Brain tissue penetration of TFV was 3-fold higher in uninfected versus infected macaques (although not statistically significant;
p=0.70), although CSF penetration was comparable. Mouse data showed TFV tissue penetration 0
0.05 0.1 0.15 0.2 0.25 0.3 0.35
Mice NHP
FT
C
Tis
sue:
P
la
sm
a Rat
io
Species
7 | Moody
20-fold higher in uninfected animals (p=0.10), but this was also not statistically significant. Overall, mouse TPR values were nearly 4-fold lower than corresponding macaque values, but not statistically significant (Figure 3; p=0.093).
Figure 3: TFV Interspecies Comparison
The Y axis represents median TFV TPR values. Each species is identified on the X axis, with blue bars representing infected animals and orange bars representing uninfected animals. Error bars represent TFV TPR range values. Macaque TPR was 3.8 to fold higher than mice TPR for TFV penetration. Infected macaque TFV TPR was 25-fold higher than infected mice and uninfected FTC TPR was 3.8-25-fold higher than uninfected mice TPR.
TPR values for EFV in macaques ranged from 0.26-1.66. Brain tissue penetration of EFV was 4.5-fold higher in uninfected versus infected macaques (not statistically significant; p=0.10), again despite similar penetration of drug into the CSF. Mouse data also showed higher EFV tissue penetration in uninfected animals (approximately 6-fold higher; p=0.10). Overall, mouse TPR values were up to 3.1-fold lower than corresponding macaque values (Figure 4; p=0.026).
0 0.02 0.04 0.06 0.08 0.1 0.12 0.14 0.16
Mice NHP
TF
V
Tis
ue:
P
la
sm
a Rat
io
Species
8 | Moody
Figure 4: EFV Interspecies Comparison
The Y axis represents median EFV TPR values. Each species is identified on the X axis, with blue bars representing infected animals and orange bars representing uninfected animals. Error bars represent EFV TPR range values. Macaques TPR was 2.5 to fold higher than mice TPR for EFV penetration. Infected macaque EFV TPR was 3.1-fold higher than infected mice and uninfected EFV TPR was 2.5-3.1-fold higher than uninfected mice TPR.
Discussion
Despite advances in antiretroviral therapy, HIV persists during treatment. The brain is a potential HIV reservoir that may be a major barrier in the eradication of HIV as antiretroviral drugs have restricted access to this area. In addition to being an obstacle for eradication, continuous HIV replication in the brain can result in incurable neurological complications. Due to the
impracticality of obtaining brain samples from patients receiving antiretroviral therapy, it is difficult to determine the relative penetration of these drugs into human brain tissue and CSF drug concentrations are often used as surrogate markers. The results from this study give better insight into how well commonly used antiretroviral agents penetrate into brain tissue and how well the CSF drug concentrations serve as surrogate markers.
ARV plasma concentrations were several orders of magnitude lower than reported steady-state plasma trough concentrations in humans, 22-23 despite therapeutic doses being used. EFV plasma
concentrations were 14 to 495-fold lower and FTC plasma concentrations were 1 to 9-fold lower. TFV plasma concentrations were only 1-fold lower in macaques, while mouse concentrations
0 0.2 0.4 0.6 0.8 1 1.2 1.4 1.6 1.8 2
Mice NHP
EF
V
Tis
sue:
P
la
sm
a
Rat
io
Species
9 | Moody
were 1 to 6-fold higher than human plasma concentrations. For this reason, TPRs and CPRs are utilized in an attempt to normalize any discrepancies in plasma exposure between species.
ARV TPRs for uninfected macaques were 1.3 to 61-fold higher than their corresponding CPRs, suggesting that more drug is penetrating brain tissue than CSF. EFV’s TPR in infected macaques was also greater than the CPR. In infected macaques, TFV and FTC had TPR’s 1.6 and 4.1-fold lower than their corresponding CPR’s, indicating that more drug is present in CSF than brain tissue, and again demonstrating how CSF concentrations may not provide accurate estimations of ARV drug concentrations in brain tissue. These results are consistent with previous studies demonstrating that brain tissue concentrations of nevirapine, another antiretroviral drug, and EFV differ from those in the CSF.24-25 Overall, it appears that the extent of brain tissue
penetration is differential for each drug and that the CSF may not be an accurate predictor of tissue concentrations for ARVs.
EFV had the highest TPR, hence best brain tissue penetration, amongst all drugs as expected given that EFV is more lipophilic than FTC and TFV. The higher TPRs in uninfected macaques indicate that the presence of infection may reduce the level of drug penetration into brain tissue. One possible explanation for this finding is the overexpression of efflux pumps and upregulation of proteins within the blood-brain barrier in an attempt to counteract the inflammation associated with HIV infection. In mice, a similar pattern was shown with uninfected mice having a higher TPR than infected mice by 5.7 and 20-fold for EFV and TFV, respectively. FTC was
exceptional, with a TPR 1.8-fold higher in infected mice than uninfected mice indicating that more FTC is present in brain tissue of infected mice. Overall, macaques had increased levels of ARV penetration into brain tissue when compared to humanized mice which is important to note for future pharmacokinetic extrapolation studies across species.
One limitation of this study is the relatively small sample size. With such a small sample size, we did not have enough statistical power to see differences between drug penetration in infected vs uninfected animals. Another limitation of this study is that CSF samples were not obtained for the mice due to the inability to collect sufficient CSF volume. For this reason, tissue penetration ratios could not be compared to the CSF penetration ratios in mice. It would be interesting to see if a similar trend of higher TPRs than CPRs was also found in uninfected mice, despite similar CSF penetration. In a recent study, EFV was found to have higher tissue penetration in vitro and in vivo when compared with CSF and plasma concentrations.25 The animal models used in this
study are a part of a larger cohort project analyzing antiretroviral drug penetration into several other potential HIV reservoirs. Future directions of this research project include evaluating the extent of more antiretroviral drugs in brain tissue and other probable HIV reservoirs,
10 | Moody
References
1. HIV in the United States: At A Glance. Centers for Disease Control and Prevention Web site. http://www.cdc.gov/hiv/statistics/basics/ataglance.html Accessed December 26, 2015.
2. Harrigan P, Whaley M, Montaner J. Rate of HIV-1 RNA rebound upon stopping antiretroviral therapy. AIDS. 1999;13(8):F59-62.
3. Rezaei S, Cameron P. Human immunodeficiency virus (HIV)-1 integration sites in viral latency. Curr HIV/AIDS Rep. 2015. 12(1):88-96.
4. Palmer S, Josefsson L, Coff J. HIV Reservoirs and the possibility of a cure for HIV Infection. J Intern. Med. 2011; 270 (6): 550-560.
5. Ene L, Duiculescu D, Ruta S. How much do antiretroviral drugs penetrate into the central nervous system?. J Med Life. 2011;4(4):432-9.
6. Enting R, Prins J, Jurriaans S, et al. Concentrations of human immunodeficiency virus type 1 (HIV-1) RNA in cerebrospinal fluid after antiretroviral treatment initiated during primary HIV-1 infection. Clin Infect Dis. 2001;32(7):1095-9.
7. Churchill M, Gorry P, Cowley D, et al. Use of laser capture microdissection to detect integrated HIV-1 DNA in macrophages and astrocytes from autopsy brain tissues. J Neurovirol. 2006;12(2):146-52.
8. Heaton R, Franklin D, Ellis R, et al. HIV-associated neurocognitive disorders before and during the era of combination antiretroviral therapy: differences in rates, nature, and predictors. J Neurovirol. 2011;17(1):3-16.
9. Schnell G et al. HIV-1 Replication in the Central Nervous System Occurs in Two Distinct Cell Types. PLoS Pathog 2011: 7(10): e1002286.
doi:10.1371/journal.ppat.1002286
10.Edén A, Fuchs D, Hagberg L, et al. HIV-1 viral escape in cerebrospinal fluid of subjects on suppressive antiretroviral treatment. J Infect Dis. 2010;202(12):1819-25.
11.Dahl V, Peterson J, Fuchs D, et al. Low levels of HIV-1 RNA detected in the
cerebrospinal fluid after up to 10 years of suppressive therapy are associated with local immune activation. AIDS. 2014;28(15):2251-8.
12.Canestri A, Lescure F, Jaureguiberry S, et al. Discordance between cerebral spinal fluid and plasma HIV replication in patients with neurological symptoms who are receiving suppressive antiretroviral therapy. Clin Infect Dis. 2010;50(5):773-8.
13.Walker M, Tong X, Perry H, et al. Comparison of serum, cerebrospinal fluid and brain extracellular fluid pharmacokinetics of lamotrigine. Br J Pharmacol. 2000;130(2):242-8. 14.Wang X, Ratnaraj N, Patsalos P. The pharmacokinetic inter-relationship of tiagabine in
blood, cerebrospinal fluid and brain extracellular fluid (frontal cortex and hippocampus). Seizure. 2004;13(8):574-81.
11 | Moody
Drug Metab. 2008;9(1):46-59.
17.Hatziioannou T, Evans DT. Animal models for HIV/AIDS research. Nat Rev Microbiol. 2012;10(12):852-67.
18.North T, Van rompay K, Higgins J, et al. Suppression of virus load by highly active antiretroviral therapy in rhesus macaques infected with a recombinant simian
immunodeficiency virus containing reverse transcriptase from human immunodeficiency virus type 1. J Virol. 2005;79(12):7349-54.
19.North T, Villalobos A, Hurwitz S, et al. Enhanced antiretroviral therapy in rhesus macaques improves RT-SHIV viral decay kinetics. Antimicrob Agents Chemother. 2014;58(7):3927-33.
20.Apostolova N, Funes H, Blas-garcia A, et al. Efavirenz and the CNS: what we already know and questions that need to be answered. J Antimicrob Chemother.
2015;70(10):2693-708.
21.Schinazi R, Bassit L, Clayton M, et al. Evaluation of single and combination therapies with tenofovir disoproxil fumarate and emtricitabine in vitro and in a robust mouse model supporting high levels of hepatitis B virus replication. Antimicrob Agents Chemother. 2012;56(12):6186-91.
22.Atripla [package insert]. Princeton, NJ; Bristol Myers Squibb. February 2008.
23.Calcagno A, Gonzalez de requena D, Simiele M, et al. Tenofovir plasma concentrations according to companion drugs: a cross-sectional study of HIV-positive patients with normal renal function. Antimicrob Agents Chemother. 2013;57(4):1840-3.
24.Gibbs J, Gaffen Z, Thomas S. Nevirapine uptake into the central nervous system of the Guinea pig: an in situ brain perfusion study. J Pharmacol Exp Ther. 2006;317(2):746-51. 25.Curley P, Rajoli R, Moss D, et al. Efavirenz Is Predicted To Accumulate in Brain Tissue: