(AJIRSET)
Available online at: www.engineeringjournal.info
RESEARCH ARTICLE
Effect of Oven Drying Temperature on Banana Powder Quality
Bayisa Dame
1, Omprakash Sahu
2*1Department of Food Technology and Process Engineering, Haaramaya University Ethiopia. 2School of Chemical and Food Engineering, Bahir Dar University Eithiopia.
*Corresponding Author: Email:[email protected]
Abstract
Processing of green bananas into flour is of interest in view of the surplus fruits often available year round in the production areas. Most banana flour, produced from the green unripe fruit is sun dried or dried in crude ovens, under these conditions the quality of the product is very variable (Wilson, 1975). During processing such as drying processing parameter affect quality of banana powder. The result revealed that oven dried banana powder has moisture content6.25%,crude fat 11.18%,crude protein 7.321%, total ash 3.2%, crude fiber 0.5%, total carbohydrate 71.53%, vitamin C 25.96% at 50◦C and moisture content 5.83%, crude fat9.188%, crude protein6.321%,total ash2.89%, crude fiber 0.435%, total carbohydrate75.34%, vitamin C20.42% at 60OCagain moisture content 3.88%, crude fat 9.11%, crude protein 5.43%, total ash 2.32%, crude fiber0.4%, total carbohydrate 78.86% and vitamin C 9.03%. These indicate that all proximate composition decreased as drying temperature increased except carbohydrate. Drying temperature also affect rehydration ability, solubility and total soluble solid.
Keyword: Composition,Drying, Proximate.
Introduction
Banana is the common name for an edible fruit produced by several kinds of large herbaceous flowering plant of the genus musa. Banana processing, particularly drying using natural sun drying has been carried out for many centuries now. Banana processed to increase shelf life, ability to store and to be supplied when needed. Processing of green bananas into flour is of interest in view of the surplus fruits often available year round in the production areas. Most banana flour, produced from the green unripe fruit is sun dried or dried in crude ovens, under these conditions the quality of the product is very variable [1]. Considerable losses occur during natural sun drying; lowering the qualitative and quantitative value of the dried products.
The slices of unripe fruit are normally spread out on bamboo frameworks or on bare patches of earth, roofs, stone outcrops or on sheets of corrugated iron [2]. Dried products are subject to contamination by extraneous
materials such as sand, stones, soils, tree leaves and incursion by rodents, insects, animal excreta and various forms of micro-organisms. Efforts to improve the above traditional drying methods have been going on. Drying methods have progressively improved from drying on the ground to raised racks to solar dryers, where a product is placed within an enclosed cabinet. Cabinet dryers have evolved from using solar energy alone to currently hybrid drying using both solar and other energy sources such as biomass, diesel and electric. However, these dryers have given products with inferior quality that is reduced nutritional value, collapsed structure, reduced taste and flavor deterioration and discoloration. The discoloration during preparation and drying commonly called “browning” is caused by chemical or biochemical reactions or over heating due to difficulties in controlling the drying conditions notably temperature and time.
In an effort to improve the quality of dried products appropriate drying temperature and drying time have to be used. Currently the market prefers high quality dried products with good reconstitution properties and excellent sensory attributes. In an effort to improve the quality of dried products appropriate drying temperature and drying time have to be used.
Banana is one of the largest fruit grow in sub- Sahara country like Ethiopia, Kenya, and developing countries etc, even if it is one of the largest grown fruit and high nutritional content like starch, it can’t be stored for long period of time and can’t be supplied when needed. To prolong shelf life, various processing and preservation method such as drying, chemical treatment, and various packing methods are used. Drying is the major food processing operation to increase shelf life. The purpose of drying of fruit is to produce a stable and easily handled form of the product, which reconstitute rapidly to a quality product reassembling the original fruit as closely as possible. Completely dried fruit powders are often used for making many delicious food products. In Ethiopia, the number of fruit and vegetable processing industries are limited. Currently, there are only “5”fruit processing plant in the country .These plants presently process a limited variety of product ;tomato paste, orange marmalade, vegetable soup, frozen vegetables and wine. Therefore in order to prolong the shelf life of post-harvest product, processing is necessary. Processing contributes toward expansions of market of processed product in availing it during off season and also increasing it values. During processing, drying temperature is one of factor which may affect quality of final product. The thesis mainly focuses on processing of banana powder which is storable and easily transport by optimizing drying temperature. The main aim of this research work is to analyze different drying temperature on quality of dried banana powder. The work also focus on optimize banana drying temperature, increase shelf life of banana for long period storage and easy transportation, identify the rehydration property of banana powder and measure proximate composition of banana powders.
Materials and Methods
Raw Materials
The basic raw materials were improved Cavendish banana. The banana was obtained from the local market in nearby Haaramaya market Ethiopia. The experiment on oven drying process and product quality analysis were carried out in the Food technology and process engineer of Haaramaya University laboratory.
Equipment’s
Materials needed for conducting the experiment are: stainless steel knives; beaker; 20µm size sieve mesh; Buchner funnel; Filter paper; Crucible; Desiccator; Kjeldahl analytical balance; Digestion flask; Sox let apparatus; Thimble; Porcelain dish; Spector photometer; Oven dry and laboratory grade chemical, H2SO4; NaOH; Na2SO4/K2SO4; CUSO4; Ether; Trichloro acetic acid; Vitamin C; Metaphosporic acid; Bromine; Thiourea
Method of Analysis
Proximate Analysis
All analytical measurements were carried out in duplicate. Determination of moisture content, crude fat, crude protein, total ash and crude fiber of mango, banana puree and powder were determined as described in the AOAC (2000).
Determination of Moisture Content (AOAC 2000, 925.05)
A Dish was dried at 130oC for one hour and was placed in a desiccators for about 15-20 minutes. The mass of the dish was measured (Wa).About 2-3g of the sample was weighed into the moisture dish(Wi).The sample was dried at 130 oC for one hour or at 100 oC for 6 h. After drying is completed, it was measured as Wf.
Where:
MCwbis the moisture content in wet basis (%)
Wi is the initial weight of samples before drying plus aluminum dish and lid (g)
Wf is the final weight of dried samples plus aluminum dish and lid(g) and
Wa is the weight of aluminum dish and lid(g)
Determination of Dietary (crude) Fiber in the Samples (AOAC 2000, 920.169)
About 2g of the sample was weighed .If the sample contains fat>1%, the fat was extracted by hexane. The defatted sample was transferred in to 600ml beaker. Fiber contamination from paper or brush is avoided. 0.25-0.5g bumping granules, followed by 200ml (1.25%) sulfuric acid solution was added to the beaker near-boiling. The sample in the beaker was boiled for 30 minutes by rotating periodically. Near the end of refluxing, it was placed on Buchner funnel fitted with No.9 rubbers topper and filtered. At the end of filtration, the solids were washed by warm water and 1.25%sodium hydroxide. The filtration was continued until dryness. The residue was placed on crucible. The crucible was dried for two hours at 130 oC or overnight 110 oC. Then it was cooled in the desiccators and weighed (W1). Then again it was ashed at 550oC, cooled in desiccators and weighed (W2).
W1-W2/sample*100
Where: W1- Weight of crucible and residue (g)
W2 - Weight of crucible and ash (g)
Crude Protein Determination
Kjeldahl method of crude protein analysis (AOAC 2000, 979.09)
Digestion: About 0.1-1g of the food sample was weighed on an analytical balance into the digestion flask (round- bottom flask with a long neck, similar in appearance to a volumetric flask except for the round bottom and the lack of a calibration line) or larger test tube. Then the sample was digested by addition of small volume (3-5ml) of concentrated H2SO4 (an oxidizing agents which digests the food), anhydrous Na2SO4 or K2SO4 that speed up the reaction by raising the boiling points ofH2SO4 and a catalyst (CuSO4, selenium, titanium or mercury) to speed the reaction. About 1 g of catalyst mixture was made of Na2SO4 or K2SO4 with anhydrous CuSO4 in the ratio of 10:1 used.
Digestion converted any nitrogen in the food (other than that which is in the form of nitrates or nitrites) into ammonia and other organic matter to CO2 and H2O. In acidic solution, ammonia was not liberated as gas because rather it exists as ammonium sulfate salt. N (in food) (NH4)2 SO4
Distillation After digestion had completed, the content in the flask was diluted by water and a concentrated NaOH (40%) solution. It was added to make the solution slightly alkaline and to liberate ammonia gas.
(NH4)2 SO4 +2NaOH 2NH3 + 2H2O + NaS2O4
The ammonia was then distilled into receiving flask that consist a standardized strong acid such as solution of excess boric acid (4%) or sulfuric acid for reaction with ammonia or sulfuric acid.
Titration If H2SO4 was used in the receiving flask, the excess acid was back titrated with NaOH.
NH3 + H2SO4 (NH4) SO4 + H2SO4 (that is excess)
(Back titration reaction)
H2SO4 (the excess) + NaOH Na2SO4 + H2O But if boric acid was used, the borate ion was titrated with standard acid (0.1N HCI). NH3 + H3BO3 (boric acid) NH4 + H2BO3 (borate ion)
H3BO3 + H+ H3BO3
Calculation: Total nitrogen, percent by weight
=(𝑇−𝐵∗𝑁∗14.007∗100𝑊
Where; T= Volume in ml of the standard sulphuric acid solution used in the titration for the test material
B: Volume in ml of the standard sulphuric acid solution used in the titration for the blank determination
N: Normality of standard sulphuric acid W: Weight in grams of the test material
Crude Fat Content Determination (AOAC 2000, 4.5.01)
Fat content was determined using AOAC (2000), fat is extracted with Ether (peroxide free) from dried samples in a soxhlet apparatus, and the other is evaporated from the extraction flask. The amount of fat is calculated from the difference in weight of the extraction flask before and after extraction.
Soxhlet Fat Extraction Method
About 3-4 g of sample was weighed and put into a thimble lined with a circle of filter paper. Thet himble with contents was placed into a 50ml beaker and dried in an oven for 2 h at 1100C. Thimble content was transferred in to extraction apparatus. The beaker was rinsed for several times with the solvent hexane. The sample contained in the thimble was extracted with the solvent hexane in a Soxhlet extraction apparatus (2055 soxtecswiden) for 6-8 hours at a condensation rate of at least 3-6 drops per second.
At the completion of the extraction, the extract was transferred from the extraction flask into a preweighe devaporating small beaker (150-250ml) with several rinsing with the solvent. The hexanewas evaporated until no odor was detected. The beaker and contents was dried in an oven for 30minutes at 1000C.Then it was removed from the oven and cooled inadesiccators. The beaker andcontents were weighed.
Formula: W = W2 – W1
Fat (g/100g) fresh sample = 𝑊∗(100−%𝑚𝑜𝑖𝑠𝑡𝑢𝑟𝑒) 𝑤𝑑
Where: W =weight of fat (g)
W2 = weight of extraction flask after extraction (g)
W1 = weight of extraction flask before extraction (g)
WD = weight of dried sample (g)
Total Ash Determination (AOAC, 2000, 941.12)
The porcelain dish which was used for the analysis was cleaned by drying at 120 oC and igniting at550 oC in furnace for three hours.
Then the dish was removed from the furnace and cooled in a desiccators .The mass of the dish was measured by analytical balance (W1).About 3g of the sample was weighed in to porcelain dish (W2).The sample was dried at 120 oC for one hour in drying oven(Memmert, 854 schwabach, Germany). The sample was removed from the drying oven and carbonizes by blue flame of Bunsen burner by placing the sample dish on wire gauze. The sample was then placed in furnace (Carbolite, astonlane Hope, Sheffield S302RR, England) at about 550 oC until free from carbon and the residues appear grayish white (about 8h).The sample was removed from the furnace and if the ashing was incomplete it was moistened by the few drops of water and placed in an oven at 120 oC for 1h and re-ash at 550 oC until white ash color is obtained .It was removed from the furnace and placed in the desiccators. Finally the mass was weighed (W3).
Ash (%) =
𝑊3 − 𝑊1 ∗ 100% 𝑊2 − 𝑊1
Where: W1= Weight of the dish (g) W2=Weight of fresh sample and dish (g) W3=Weight of ash and dish (g)
Carbohydrates
Total carbohydrate was calculated by difference with the exclusion of crude fiber. C (%) = 100 – P+ F + Fi + A+ W
Where: P = percentage of protein F = Percentage of fat
Fi =Percentage of crude fiber A = Percentage of ash
W = Percentage of water
Vitamin C
The vitamin C content of the juice and powder was determined using 2, dichloroin-dophenol-titrimetry (AOAC Method 967.21 in AOAC, 2000, cit. in Nielson, 2003), Procedure: 5 g of sample was weighed and also 0.6 g of trichloroacetic acid was measured and diluted with100ml of water. To extract the solution each sample was mixed with trichloacetic acid by blending
and transferred in to beaker to settle .Then the solution was filtered by using filter paper in to Erlenmeyer flask. 1 g vitamin C was dissolved with 5% metaphospheric acid. Take from the 100ml and dilute with 50ml and then 1ml saturated Bromine was added in 5 test tubes which are used as standard. Then standard solution prepared and in each test tube with required amount of metphosphate.
In one blank test tube 4ml met phosphate was added. And also 1ml bromine was added to extracted samples, 10 ml Thiourea in 6 conical flask was prepared, 10 ml of filtered sample was added in each conical flask and mixed Then 4ml was taken from each and added in to empty taste tube. 2% 1mlDNPH was added in to each prepared and metaphophate mixed taste tube and also 2%concentrated 1ml DNPH added to the conical flask which contains Thiourea. Then all placed in water bath at 38OC about 3 hours. Then it was taken out from water bath and cooled for 5 minutes in cold water .5ml 85% concentrated sulfuric acid was added in all test tubes including the blank. Then1ml 2%2,4DNPH was added in the blank. After 30 minutes exposure of room temperature the sample was filtered .Then the spectrophotometer calibrated.
Calculation
Mg of Ascorbic
acid/100g=𝐴10𝑚𝑖𝑐𝑟𝑜𝑔𝑚𝑠𝑡𝑑−𝐴𝑏𝑙𝑎𝑛𝑘𝐴𝑠𝑎𝑚𝑝𝑙𝑒−𝐴𝑏𝑙𝑎𝑛𝑘∗10
Total Soluble Solids
The total soluble solids (TSS) level of the fruits powder was determined according to AOAC method by using hand refract meter, at room temperature (range from 18 to 23°C).
Solubility was determined according to the Eastman and Moore method (1984), with some modifications 100 ml of distilled water and 1g of powder were added by mixing at high velocity in a mixer for 5 min. The solution was placed in a tube and centrifuged at maximum speed in 5 min. An aliquot of 25 ml of the supernatant was placed in previously weighed Petri dishes and immediately oven-dried at 105 ºC for 5 h. Solubility (%) was calculated by weight difference.
Sensory Analysis
Sensory evaluation was conducted for each banana powders dried at different temperature. The evaluation was carried out by ten semi-trained panelists of whom three were female and seven were male comprised of students of the Food technology and process engineer stream. Panelists were asked to give acceptance score for five attributes: flavor, color, aroma, taste and overall acceptance using the nine point hedonic scale, in which 1 represent dislike extremely, 2 represent dislike very much, 3 represent dislike moderately, 4 represent dislike slightly, 5 represent neither like nor dislike, 6 represent like slightly, 7 represent like moderately, 8 represent like very much, 9 represent like extremely. The powder was diluted with warm water placed in glasses and coded.The powder samples were served to each panelist in a random order.
Experimental Design and Data Analysis
The experiment was conducted in a completely randomized design at three temperature of drying (500C, 600C AND700C) .Samples was analyzed in duplicates. The data were subjected to analysis of variance, and the level of significance was set at 5% using a statistical software SPSS version 17.
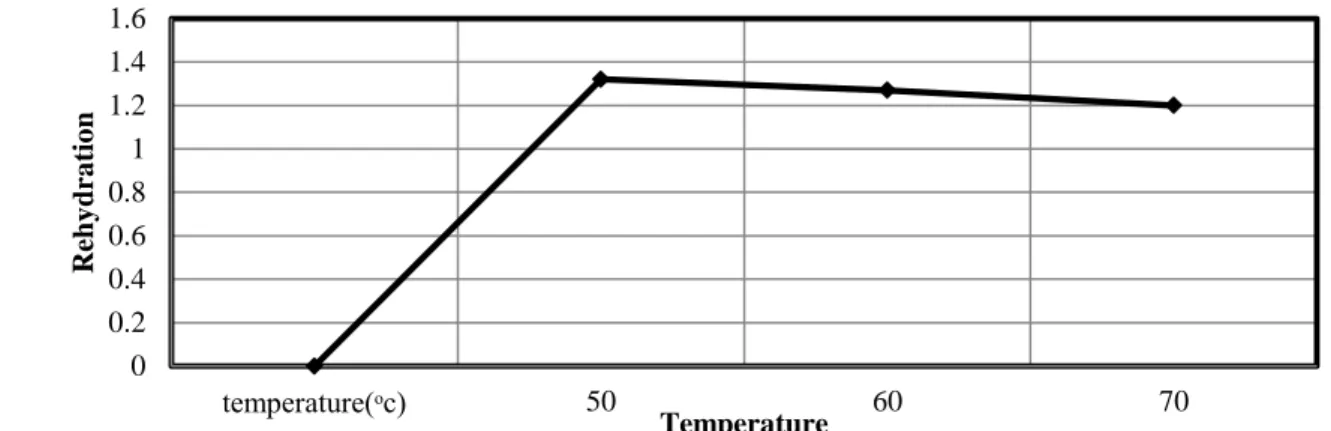
Rehydration
Rehydration is determined as weight ratio R’ =𝑀𝑜◦◦◦𝑀
Where R' is the rehydration, and M, MO are the sample weight after and before placing it in the hot water bath, respectively.
Result and Discussion
Oven Dried Banana Powder
Banana powder dried by oven has characteristics of brittleness, dark color, large in size and show different flavor and aroma at different drying temperature. Rehydration
The rehydration is the ability of food regaining moisture content. The result is presented in Fig.1. From the graph it can see that rehydration ability of banana powder at different temperature of drying increase with increase in temperature.
Fig.1: Rehydration of banana powder Solubility
The instant properties of a powder involve the ability of a powder to dissolve in water. Solubility of most powdered foods are intended for rehydration and the ideal powder would wet quickly and thoroughly, sink rather than float, and disperse/dissolve without lumps. Solubility problems occur when foods are submitted to high temperatures, and especially, in products with high concentration of solids. The result shows that banana powder solubility is functions of temperature. From analysis
result showed that at temperature 50°C, (86%), 60◦C (76.5%) and 70◦C (60%).from this as temperature increase solubility decreased.
Yield of Oven Dried Banana Powder The yield of banana powder obtained from 1Kg of ripe banana pulp which dried by oven is shown in Fig.2. It can be observed that yield of banana powder is high at 70°C (500gm) and decreased as temperature decreased to 60°C and 50°C which is 400gm and 250gm respectively.
Fig.2: Yield of banana
Proximate Analysis
Proximate analysis of banana powder was conducted and summary of results of
moisture content, crude protein, crude fat, crude fiber, ash, vitamin C and total carbohydrate is presented in Tables1.
Table 1: Proximately analysis of banana
Sample Temperature(◦C) Proximate composition Banana
powder Moisture content Crude fat Crude protein Total ash Crude fiber Total carbohydrate Vitamin C
50 6.25 11.18 7.321 3.2 0.5 78.12 25.96
60 5.83 9.188 6.321 2.89 0.435 74.12 20.42
70 3.88 9.11 5.43 2.32 0.4 70.82 9.03
0 0.2 0.4 0.6 0.8 1 1.2 1.4 1.6
temperature(ᵒc) 50 60 70
Rehy
dra
tio
n
Temperature
0
100
200
300
400
500
600
40
50
60
70
80
Y
eil
d
The result revealed that oven dried banana powder has moisture content6.25%,crude fat 11.18%,crude protein 7.321%, total ash 3.2%, crude fiber 0.5%, total carbohydrate 78.12%, vitamin C 25.96% at 50◦C and moisture content 5.83%, crude fat9.188%, crude protein6.321%,total ash2.89%, crude fiber 0.435%, total carbohydrate74.12%, vitamin C20.42% at 60OCagain moisture content 3.88%, crude fat 9.11%, crude protein 5.43%, total ash 2.32%, crude fiber0.4%, total carbohydrate 70.82% and vitamin C 9.03%. These indicate that all proximate composition decreased as drying temperature increased [3-24].
Conclusion
Now days in Ethiopia many agro- processing industries are emerging in an alarming rate due to the current opportunity. These industries are initiating the private sector to
involve in the area of fruit processing. A study aimed at development of banana powder. The results showed that the operating parameters such as drying temperature affect the powder quality properties significantly. The investigation indicated that increasing the drying temperature increase yield of banana powder .In general drying temperature affect product quality attributes .The best conditions to produce lower moisture content; higher yield and best quality banana powder were at temperature of 70 °C, as observed from investigation. Further studies are recommended on: banana powder production by using different drying technology for reducing darkness problem and banana powder production by using value added product (i.e. fortification and the like) in order to increase nutritional composition further.
Reference
1.Van Pelt WHJM (1975) Vacum Concentration of Vegetable Juices. In Vacum Drying and Advanced Food Technology ( Goldblith, SA , Rey L, Rothmayr WW., eds ) . Academic Press , London.
2.FAO (2008) Principles of post-harvest
handling, storage and processing of fruits and vegetables.
3.Adisa V, Okey EN(1987) Carbohydrate and protein composition of banana pulp and peel as influenced by ripening and mold contamination, Food Chem, 25:85-91.
4.CSA (2006) Central Statistical Authority. Agricultural sample survey: Report on area and production for major crops. Statistical Bulletin 427. Addis Ababa, Ethiopia.
5.Dendena C, Desta H, Dvijrenbodl AR (2005) Export potential of Ethiopian processed fruits and vegetables, Export promotion department Addis Ababa, Ethiopia.
6.Elias A (207) Technical Assessment on Viability of Integrated Fruits Processing in Ethiopia. Chemical Engineering Department of Addis Ababa University.
7.FAO Food and Agricultural Organization, Geneva (2009)WWW.fao.org/production/faostat.
8.James GB (2006) Food Processing Handbook .Wiley-VCH Verlag GMBH & KGAA.
9.Loeseck HW (1950) Chemical changes during ripening bananas: Chemistry, physiology and technology, Inter science, 4:67-118.
10. Marriott, Robinsons M, Karikari SK (1981) starch and sugar transformation during the ripening of plantains and bananas, J. Sci. Food Agric, 32:1021-1026.
11. Ministry of Agriculture, Irrigation and
Livestock, Government of Afghanistan, ISBN 978-92-5-105916-6.
12. Mujumdar AS, Beke J, Grain drying: Basic principles, In: Handbook of post-harvest Technology: Cereals, Fruits, Vegetables, Tea, and Spices; Chakraverty, A.
13. Mujumdar AS, Raghavan GSV, Ramaswamy HS, (2001) Eds, Marcel Dekker, Inc., NY.
14. Sharrock S, Lustry C (2000) Nutritive values of banana, in IN I BAP AMUAL Report (I N I BAP, Montpellier, France) , 28-31.
15. Shruti S (2007) Horticulture post-harvest technology, Principles of Food Processing. Indian Agriculture Research Institute New Delhi-110012.
16. Wainwright H, Hughes P (1989) changes in banana pulp color during ripening, Fruits, 45:25-28.
and mineral composition of banana (Musa sp.) and papaya (Carica papaya) cultivars grown in Hawaii, J Food Comp Anal, 19:434-445.
18. Yang XT, Zhang ZQ, Joyce D ,Huang XM, Pang XQ (2009) Characterization of chlorophyll degradation in banana and plantain during ripening at high temperature, Food Chem, 114:338-390.
19. Understanding the Wood Drying Process: A Synthesis of Theory and Practice. 3rd IUFRO.
Vienna: 222-226.
21. Ressel JB (1999) State of the art for the vacuum drying in wood working industry. Edinburgh COST E 15.
22. Brooker DB, Bakker-Arkema FW, Hall CW (1974) Drying CerealGrains.AVI, Westport, CT.
23. Brennan JG, Butters JR, Cowell ND, Lilly AEV (1990) Food Engineering Operations, 3rd ed. Elsevier, London, UK.
24. Oetjen GW (1999 ) Vacuum Oven Drying. Wiley-VCH , Weinheim