INTRA-FAMILIAL CONCORDANCE IN LIFESTYLE BEHAVIORS AND CARDIOMETABOLIC RISK IN RAPIDLY MODERNIZING CHINA
Fei Dong
A dissertation submitted to the faculty at the University of North Carolina at Chapel Hill in partial fulfillment of the requirements for the degree of Doctor of Philosophy in the Department
of Nutrition in the Gillings School of Global Public Health.
Chapel Hill 2016
Approved by:
Penny Gordon-Larsen Barry Popkin
Linda Adair Allison Aiello
© 2016 Fei Dong
ABSTRACT
Fei Dong: Intra-Familial Concordance in Lifestyle Behaviors and Cardiometabolic Risk in Rapidly Modernizing China
(Under the direction of Penny Gordon-Larsen)
China has been experiencing rapid changes in lifestyle behaviors and dramatic increases in cardiometabolic disease (CMD) risk factors in both adults and children in the past two
decades. Lifestyle behaviors are important contributors to cardiometabolic health. Children share lifestyle behaviors, genes, and home environments with parents, which could underlie clustering in CMD risk in households. However, the extent to which children share behaviors and CMD risk factors with each of their parents has not been studied in a geographically-diverse Chinese population undergoing rapid urbanization.
We capitalized on 18-year (1991-2009) longitudinal data from the China Health and Nutrition Survey (>3,000 households with children aged 7-17y), with measured CMD risk factors, diet, physical activity, and sociodemographics. Using random-effects regression, we investigated parent-offspring associations in CMD risk factors (waist-to-height ratio, hemoglobin A1c, blood pressure, and C-reactive protein) and lifestyle behaviors (animal-source foods, away-from-home eating, snacking, screen time, and leisure-time sports). We additionally examined the associations between these behaviors and risk factors in children and their parents, and
We found positive associations in lifestyle behaviors and CMD risk factors between children and their parents. However, the magnitude of parent-offspring associations for behaviors declined over time. We also found faster increases in away-from-home eating and snacking in children than their parents. Compared to children who lived with siblings in the household, only children consumed more animal-source foods, away-from-home foods, snacks, and had higher HbA1c, after adjusting for age, sex, household income, and urbanicity. CMD risk factors in children and their parents were negatively associated with the consumption of fruit and vegetable snacks and positively associated with screen time, with difference in associations between children and their parents for some risk factors.
To my parents,
ACKNOWLEDGMENTS
I would like to express my gratitude to all the people who made these four years of my life in Chapel Hill transformative and memorable. First and foremost, thank you to my advisor, Dr. Penny Gordon-Larsen. I have learned so much from all of our conversations and all your indispensable guidance and feedback on my work. I’m grateful that you were always available, which made me feel guided and supported every step of the way. Your patience in mentoring me, an international student, has given me confidence in my abilities and the motivation to keep exploring. You provided a happy and friendly environment to the China lab meeting where I felt comfortable asking questions and sharing my work throughout these years. It has been a joy working with you, and this work would not have been possible without you. Thank you so much.
To my committee: Barry Popkin, Linda Adair, Annie Green Howard, Amanda
Thompson, and Allison Aiello. Thank you, Barry and Linda, for challenging and guiding me to think deeper about the big picture, the rationale and the implication of my work. Thank you for always taking the time to discuss with me about my work and sharing your exceptional
To the China research team: thank you all for your remarkable help with my work during these four years. Thank you, Dr. Amy Herring, for your statistical help. Your skillful teaching and extraordinary statistical knowledge shaped my interest in statistics and my desire to keep working with data for my career. Thank you, Shufa Du and Guifeng Jin, for always helping me with accessing the data and answering my data questions with patience. Thank you, Samantha Attard, for sharing your knowledge on the dataset and for your insightful opinions on my work. Thank you, Elizabeth Koehler Rowley and Angel Davalos, for giving me helpful ideas about my work. It has been a great pleasure working with all of you.
To my peers and friends: thank you for your friendship and support. Particular thanks go out to my “cohort cuddle” group: Melecia, Pasquale, Lauren, and Melissa. Thank you for always being there for me, letting me share all my joy and stress, up and down moments, always giving me great advice and comfort, and supporting me both in school and in life. I cannot ask for better peers and friends to share the journey with me. I’m also grateful for all the other friends I met at UNC: Xiaofan, Bo, Gong, Carolina, Dalia, Nan, Victor, and Cui. Having you in this country has made my life away from home much easier and more fun. You were like my family in Chapel Hill.
To my parents. Thank you for your unconditional love and generous support in every choice I have made. Thank you for giving me the best education so I can go further, and
encouraging me to follow my interest and pursue the life I want. Thank you for making me who I am by being my parents. I know you are always there for me wherever I go.
TABLE OF CONTENTS
LIST OF TABLES………... ..xii
LIST OF FIGURES..……… …xiv
LIST OF ABBREVIATIONS………..………. …….xv
CHAPTER 1. INTRODUCTION...………...………..1
Background……….……… ………...…..1
Research Aims………..……….. ….4
CHAPTER 2. LITERATURE REVIEW ………..………..7
Prevalence of CMD risk factors in China and its public health burden… ………..7
Concordance of CMD risk factors between children and their parents ...……….…..7
Nutrition transition and behavioral changes in Chinese children and adults....………. ...9
Behavioral concordance between children and their parents and family-based interventions to reduce CMD risk ………...…...10
The role of household structure in children’s health behaviors and CMD risk factors………...12
Are urbanization-related lifestyle behaviors associated with CMD risk factors?... …13
Do behavior-CMD risk factor associations differ between children and adults?...….15
Summary...………. 16
Overview……….………..……….………..….. 18
Introduction……….………..……….…………..….. 19
Methods……….………..……….……….….20
Results……….………..……….……….…..…. 24
Discussion……….………..……….……….…. 25
Tables and figures……….………..……….………..….... 30
ENDNOTES………..39
CHAPTER 4. PARENT-CHILD ASSOCIATIONS FOR CHANGES IN DIET, SCREEN TIME, AND PHYSICAL ACTIVITY ACROSS TWO DECADES IN MODERNIZING CHINA: CHINA HEALTH AND NUTRITION SURVEY 1991-2009……… …….40
Overview……….………..……….………..….. 40
Introduction……….………..……….…………..….. 41
Methods……….………..……….……….….43
Results……….………..……….……….…..…. 48
Discussion……….………..……….……….…. 51
Tables and figures……….………..……….………..….... 57
CHAPTER 5. LONGITUDINAL ASSOCIATIONS BETWEEN DIET, SCREEN TIME, AND PHYSICAL ACTIVITY BEHAVIORS WITH CARDIOMETABOLIC RISK FACTORS AMONG CHINESE CHILDREN AND THEIR PARENTS.…...………..…67
Overview……….………..……….………..….. 67
Introduction……….………..……….…………..….. 68
Methods……….………..……….……….….70
Results……….………..……….……….…...… 75
Tables and figures……….………..……….………..….... 84
CHAPTER 6. SYNTHESIS ……….………..………...95
Overview of findings……….………..……….……. 95
Limitations…..………….……….……….……..100
Strength……….…..………….……….……….…...102
Significance and public health impact…..………….………..103
Future directions…..………….……….……….……….……….……….…………...106
LIST OF TABLES
Table 3.1. Characteristics of the analytic sample ……….… 30 Table 3.2. Predicted mean levels of clinical and anthropometric measures
in children of parents with normal or elevated HbA1c, BP, and CRP ….…..……..…32 Supplemental Table 3.1. Random-effects linear regression analysis of the
relationships between parents’ and children’s HbA1c, BP, and CRP.………..….…..35 Supplemental Table 3.2. Multivariable logistic regression analysis of
parent-child associations for elevated HbA1c, BP, and CRP. ...……….….36 Supplemental Table 3.3. Random-effects linear regression analysis of
the relationships between parents’ and children’s HbA1c, BP,
and CRP, additionally adjusting for child’s weight status.………....……..…37 Supplemental Table 3.4. Odds ratios (95% confidence intervals) of
elevated HbA1c, BP, and CRP according to overweight/obese
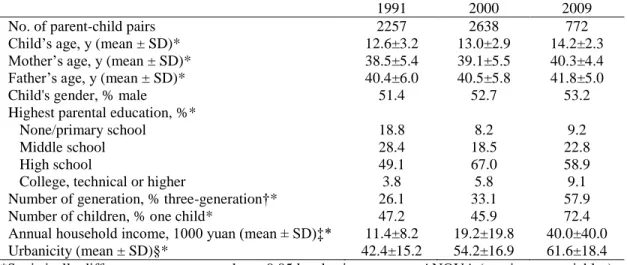
status in children.……….……….………... 38 Table 4.1. Characteristics of analytic sample over time, China Health
and Nutrition Survey 1991-2009.……… …………..………..….57 Table 4.2. Predicted parent-offspring associations for diet (% energy),
screen time (hours/week), and leisure-time sports (any/none)..……..……...…… .….59 Table 4.3. Predicted mean/probability (standard error) of diet, screen
time, and PA in children by household structure.……….…….………...61 Supplemental Table 4.1. Characteristics of children included and excluded
in the analytic sample, CHNS 1991-2009..………..……….. …………..62 Supplemental Table 4.2. Beta coefficients/odds ratios (OR) of diet, screen
time, and PA among children, mothers, and fathers..………...…63 Supplemental Table 4.3. Predicted parent-offspring associations for diet,
screen time, and PA by household income and geographic region…...………….…. 66 Table 5.1. Characteristics of analytic sample at baseline according to
dietary, screen time, and PA behaviors (CHNS 1991 for diet,
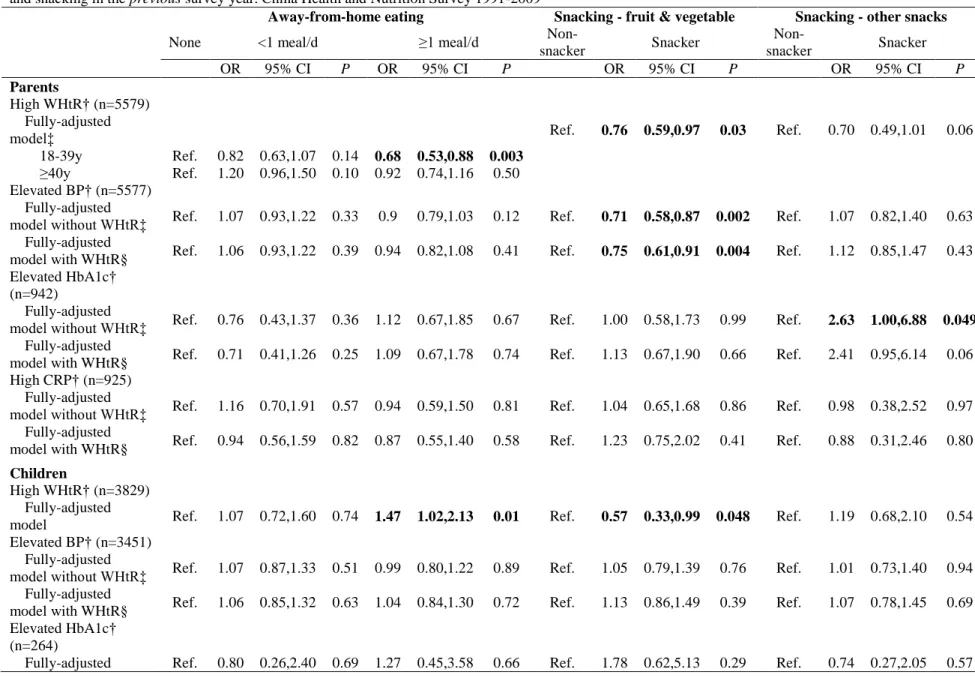
Table 5.2. Odds ratios (95% confidence intervals) of high WHtR, elevated BP, elevated HbA1c, and high CRP among parents and children according to categories of eating-away-from home and snacking in the previous survey year. China Health and Nutrition Survey
1991-2009..……….…..87 Table 5.3. Odds ratios (95% confidence intervals) of high WHtR, elevated
BP, elevated HbA1c, and high CRP among parents and children according to categories of screen time and leisure-time sports participation in the previous survey year. China Health and
Nutrition Survey 2004-2009..………..……….89 Supplemental Table 5.1. Characteristics of analytic sample according to
dietary and physical activity behaviors, China Health and Nutrition
Survey 2000 and 2009……….……….……...91 Supplemental Table 5.2. Prevalence of cardiometabolic disease risk factors
LIST OF FIGURES
Figure 1.1. Conceptual model ………...……….. ………3 Figure 4.1. Predicted mean or probability of diet, screen time and PA
among children, mothers, and fathers…………...………58 Supplemental Figure 4.1. Complete-case analysis: predicted mean (or
LIST OF ABBREVIATIONS
BP Blood pressure
CHNS China Health and Nutrition Survey
CI Confidence interval
CMD Cardiometabolic disease
CRP C-reactive protein
HbA1c Hemoglobin A1c
MET-hours Metabolic equivalent-hours OR Odds ratio
PA Physical activity
CHAPTER 1. INTRODUCTION
Background
The household context has been an important target for intervening on behaviors that influence cardiometabolic disease (CMD), which has increased across the globe among both adults and children, although with faster increases in children. [1, 2] We know from several studies that CMD risk factors (e.g. obesity, diabetes, hypertension, inflammation) cluster in families between children and their parents in Western countries. [3-9]However, we don’t know the extent to which CMD risk factors cluster in urbanizing Chinese households with burgeoning CMD risk.Such clustering is likely due to shared genes, home environments, as well as diet and physical activity (PA) behaviors between children and their parents. [10-19]Determining the strength of associations for CMD risk factors between children and their parents will provide a better understanding of childhood CMD risk and help further identify children at high risk. In addition, lifestyle behaviors such as diet and PA are important contributors to CMD risk factors. [20, 21]Studying how these behaviors are shared between children and their parents will provide guidance for family-based interventions that target both parents and children, which have shown to be more effective than targeting children only on reducing children’s CMD risk. [22] To our knowledge, these important questions have not been addressed in a large, geographically-diverse Chinese population, which has been experiencing rapid urbanization with burgeoning CMD rates.
are more likely to indulge their grandchildren with modern, unhealthy foods and screen-based sedentary behaviors, especially in single-child households. [23-25] Nonetheless, to our
knowledge, no research has examined how household structure (i.e. living with grandparents or not, having siblings or not) relates to children’s CMD risk factors, diet, and PA behaviors in a large Chinese population-based study. Understanding this question will help identify children at high CMD risk and guide behavioral intervention efforts to reduce the risk.
Furthermore, although the associations between dietary and PA behaviors with CMD risk factors have been well-established, as shown in reviews and meta-analyses, [20, 26] as well as diet and PA guidelines and recommendations, [27, 28] few studies have examined and compared the behavior-risk associations among children versus their parents. [29] Previous research has suggested potential disparities in the behavior-risk associations in children versus adults, [2] possibly because of the difference in behavior patterns between children and adults, and potential age-related biological differences in disease etiologies across generations.
To sum up, the literature is lacking how children’s CMD risk factors and lifestyle behaviors associate with those of their parents or household structure in a large Chinese
how lifestyle behaviors (Aim 2) predicted CMD risk factors (Aim 1) in children and their parents.
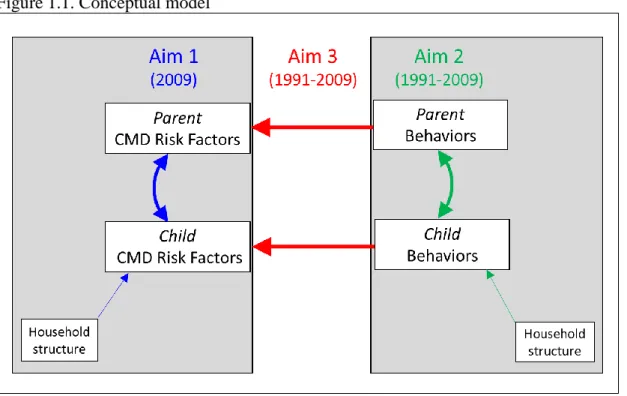
Figure 1.1. Conceptual model
determine the longitudinal associations between lagged urbanization-related diet, screen time, and PA behaviors with high waist-to-height ratio (WHtR), elevated BP, elevated HbA1c, and high CRP at the next survey among children and their parents from 1991 to 2009, and test the difference in behavior-risk associations between children and their parents.
Research Aims
The primary goal of this dissertation was to determine the parent-offspring associations for CMD risk factors and lifestyle behaviors, and examine how these lifestyle behaviors
associate with CMD risk factors in children compared to their parents living in the same
household. We also aimed to test whether household structure is associated with children’s CMD risk factors and lifestyle behaviors.
Aim 1: Determine the associations between children’s and parents’ HbA1c, BP, and CRP
in 2009.
1a: Evaluate HbA1c, BP, and CRP among children aged 7-17 years by household structure (i.e. living with grandparents or not, having siblings or not).
1b: Using random-effects regression modeling, determine the parent-child associations in HbA1c, BP, and CRP; determine whether this association differs by children’s age and sex, and by household structure.
Aim 2: Determine the associations between children’s diet, screen time, and PA behaviors
with those of their parents from 1991 to 2009.
2a: Examine changes in urbanization-related lifestyle behaviors (animal-source foods
consumption, away-from-home eating, snacking, screen time, and leisure-time sports) over time in children, mothers, and fathers.
2b: Using random-effects regression modeling, examine the parent-offspring associations in diet, screen time, and PA behaviors over time. Identify factors related to the concordance in these behaviors between children and their parents (child’s age and sex, survey year, urbanicity, household income, geographic region).
2c: Examine children’s diet, screen time, and PA behaviors by household structure (i.e. living
with grandparents or not, having siblings or not)
We hypothesize differential changes in lifestyle behaviors between children and their parents over time, overall concordance in behaviors between children and their parents, and decreasing concordance over time with urbanization. We also hypothesize less healthy lifestyle behaviors in only children and children who live with grandparents in the same household.
Aim 3: Using longitudinal models, estimate whether lagged urbanization-related lifestyle
behaviors (away-from-home eating, snacking, screen time, and leisure-time sports) are associated with high WHtR, elevated HbA1c, elevated BP, and high CRP at the next survey
CHAPTER 2. LITERATURE REVIEW Prevalence of CMD risk factors in China and its public health burden
CMD has been increasing rapidly and become a global burden. China is one of the countries with the most rapid increase in obesity and other CMD risk factors, [30] and has the world’s highest diabetes prevalence, [31] causing a heavy public health burden. [1, 32]It is estimated that diabetic patients spent 16% of their annual income on the disease. [33] Besides the increasing economic burden, it is particularly essential to study factors associated with CMD risk in this population because 1) China has the largest population in the world. With the highest diabetes prevalence, the absolute number of individuals affected by diabetes is larger than any other country in the world. In 2015, it is estimated that 9.7% and 25.5% adults were diabetic and hypertensive in China, respectively. [34] This comes to 130 million and 340 million adult diabetes and hypertension patients in this one country, respectively. 2) Asian populations have a relatively higher proportion of body fat at a lower BMI compared to Western populations, especially abdominal fat, and develop CMD risk factors at lower BMI and younger ages. Investigating factors associated with the development of CMD risk factors in China not only contributes to better understanding of this issue in Asian populations, but is also a particularly important part of global prevention efforts.
Concordance of CMD risk factors between children and their parents
track into adulthood, [35-37] the increasing prevalence of childhood CMD risk factors will further add to the public health burden in China in the next decade when children with high CMD risk enter adulthood. Therefore, studying factors related to childhood CMD risk factors is of primary importance in this population.
Parents play a particularly important role in the CMD risk status of their children due to shared genetic and environmental influences on CMD risk factors between children and their parents. Studying and documenting familial aggregation of CMD risk factors will not only provide better understanding on the development of CMD risk factor during childhood, which could assist in identifying children at high risk, but will also inform interventions to target both the parent and child to enhance treatment effectiveness. It has been suggested that family-based weight control intervention is more effective and cost-efficient compared with treating the child and parent separately. [22]The concordance of CMD risk factors between children and their parents have been reported in previous studies. [3-7, 9, 38-41] Parental obesity has been
associated with elevated risk of childhood obesity in Germany, France, Australia, US, and China. [3-7] Besides obesity, Sinaiko et al. [9] found a correlation for fasting insulin between mothers and their adolescent children in a U.S. population, whereas Park et al. [39] observed parent-child correlation in both fasting insulin and fasting glucose in Korean adolescents. The current
in a large, geographically-diverse Chinese population with a dramatic surge of metabolic abnormalities.
Nutrition transition and behavioral changes in Chinese children and adults
Urbanization and rapid socioeconomic growth have contributed to dramatic shifts in dietary and PA behaviors in China. Traditional Chinese diets are dominated by cereals and vegetables with few animal-source foods, whereas in the past two decades, China has been experiencing a transition from traditional to westernized diets high in oil and animal-source foods. [44] There has also been a fast change in eating behaviors, such as increasing away-from-home eating and snacking in this population. [45] Percent total energy from foods prepared away-from-home in China increased from 7% in 1991 to 16% in 2011 among 2-18y old children, and from 7% in 1991 to 18% in 2011 among 19-59y old adults. [45] The percentage of snacking in Chinese adults and children increased from 15% in 1991 to 67% in 2011 among 2-18y old children, and from 9% in 1991 to 52% in 2011 among 19-59y old adults. [45]
On the contrary, there have been large declines in total PA, together with increases in sedentary behaviors over the past 20 years in China. [46-48] Average weekly PA among Chinese adults fell by 32% from 1991 to 2006, with the largest fall for occupational activity [47, 49] From 1997 to 2006, urban Chinese boys aged 13-18y increased their screen time from 0.5 hours to 1.7 hours. [46]
elucidate why children have been experiencing a faster increase in obesity than adults in this country. [2]Findings will inform intervention efforts by policy makers to develop effective generation-specific behavioral change strategies in this developing population. Few studies, however, have examined generational differences in lifestyle behavioral changes in countries experiencing behavior transitions. A discrepancy between offspring and maternal changes in obesogenic diet in response to urbanization has been reported in a Filipino population, indicating a more obesogenic diet in offspring than their mothers. [50] To our knowledge, no such study has been done in China, which has the largest population in the world and is undergoing rapid modernization.
Behavioral concordance between children and their parents and family-based interventions to reduce CMD risk
While interventions on reducing CMD risk have been targeting children predominantly, Epstein et al. [22] found that family-based behavioral intervention targeted both the parent and the child was more effective comparing to targeting the child alone for reducing childhood obesity in the long term. This finding highlights the benefits of directing the interventions at relationships rather than solely at individuals. To conduct household-based interventions,
advanced understanding on how parental behaviors are associated with child behaviors is needed. Studies have shown positive correlations between parents’ and children’s dietary intakes in both Western and Chinese populations,[10-15]focusing on macronutrients, certain food groups, and overall dietary patterns. Less is known about the concordance of eating behaviors such as away-from-home eating and snacking in parent-child pairs.
physically active parents were more likely to participate in sports relative to children with inactive parents in France, Finland, Sweden, and Australia [16, 19, 51, 52]; higher parental TV watching was associated with higher TV watching in children in the UK. [53]
A number of mechanisms may explain the observed parent-child associations for health behaviors. First, it is possible that parents act as role models for children, and children adopt their parent’s behavioral habits and attitudes. Cheung et al. and Lau et al. found parental role modeling to be related to higher child PA participation in China. [54, 55] Second, shared household environment may have influenced both children’s and adults’ behaviors in similar ways. For example, studies have found positive associations between accessibility of facilities in the neighborhood (e.g., open space, recreational center, park) and participation in PA in both adults and children. [56, 57] Third, studies have shown that genetic predisposition may also contribute to the familial concordance of preference for food and exercise. [51, 58]
Past research on the parent-offspring association for diet, sedentary behaviors, and PA, however, is mostly cross-sectional. These studies were unable to examine the change in magnitude of associations over time, especially in modernizing populations such as China. Findings will reveal whether urbanization influences the familial aggregation of lifestyle behaviors. Given numerous food commercials targeting children as their main consumers, together with the increasing pocket money associated with growing household income, children are more likely to purchase meals or snacks on their own outside home, resulting in less
The role of household structure in children’s health behaviors and CMD risk factors
One-child households and three-generation (grandparents, parents, and children)
households are more common in China than in Western countries. Due to their past experience of food shortage and deprivation, and a belief that heavier children are healthier and children who eat more will grow taller, grandparents are more likely to indulge their grandchildren with large food portions, modern and unhealthy food, and screen-based sedentary behaviors, especially in single-child households. [23-25] A previous study among Japanese children also found an association between the presence of grandparents and physical inactivity. [59] Additionally, the “One-Child Policy” implemented in 1979 resulted in a high proportion of single-child
households. These only children often receive more attention and the best care in the household than children living with siblings. [60]
Unhealthy diet behaviors and physical inactivity may have contributed to the higher risk of overweight/obesity among children living in only-child and/or three-generation households relative to those who have siblings and live in two-generation households, as observed in previous studies. [61-64] For example, Li et al. found that living with grandparents was
positively associated with childhood obesity in China [24]. Other studies show that only children were more likely to be overweight compared to children with siblings in Europe and Japan. [62, 63] Intervention strategies may focus on improving dietary habits and promoting PA to enhance the ability to improve health outcomes in children in such household situations.
and PA behaviors in a large Chinese population-based study. Understanding these factors will help identify children at high risk of CMD and guide intervention efforts for behavioral changes.
Are urbanization-related lifestyle behaviors associated with CMD risk factors?
1. Dietary behaviors and CMD risk factors
Diet is an important contributor to CMD risk factors. [20] Studies have shown that a westernized diet including high consumption of high-fat animal-source foods is associated with the increasing prevalence of obesity. [65, 66] China is not only experiencing a transition from traditional to westernized diet, but is also having a urbanization-related change in eating
behaviors, such as increasing from-home eating and snacking. [45] Foods prepared away-from-home are generally high in energy density, saturated fat, trans fat, added sugar, and sodium, and low in fiber, [67] which have been associated with weight gain and adverse cardiometabolic profiles in both children [29] and adults [68, 69] in the US and Spain.
Current evidence for the association between snacking and health status is mixed. [70-74] Fisher et al. [72] and Howarth et al. [73] found positive relationships between snacking and obesity among US children and adults, respectively, whereas other studies found inverse [74] or null [70] associations among US children. Few studies examined the association between snacking and other CMD risk factors. Mekary et al. [75] found that snacking was longitudinally positively related to type 2 diabetes in US men. However, these studies did not differentiate types of snacks consumed, which could be a reason for the mixed evidence. Phillips et al. only found a significant association between BMI z-score with soda consumption among US adolescents, but not with total snacks. [76] Snacking is becoming common in China with
among Chinese overweight children, due to the health benefits of high fiber content in fruits. [78] Contrarily, snacks in Western populations are mainly candy, sweetened beverages, and salty snacks, [79] which were found to be associated with weight gain in the US population. [72, 73] 2. Sedentary time, PA, and CMD risk factors
Previous studies of screen time or sedentary behaviors have suggested their relationships with obesity in adults [80-82] and children [83, 84] in various countries such as the US, Canada, France, Australia, and China. Earlier research also found positive associations between screen time with hypertension [85] and high CRP [86] among US children. A number of theories have been proposed to explain these associations. First, screen-based activities, especially TV watching, involve low energy expenditure, even compared to other sedentary behaviors such as reading and doing homework, thus reduce total energy expenditure. [87, 88] Second, TV watching is often accompanied by increased food and snack intakes, [89] which may result in higher caloric consumption. Third, sedentary behaviors may have direct influences on metabolic health through reducing insulin sensitivity and increasing triglycerides levels, [90, 91] in addition to the indirect effect on body weight or other health behaviors.
On the other hand, epidemiological studies have demonstrated health benefits of moderate-intensity PA in both adults and children, in reducing obesity, diabetes, and
placed on promoting an active lifestyle in general rather than emphasizing on leisure-time PA only. [98]
Many of the studies examining the behavior-risk associations are cross-sectional and do not allow temporality between health behaviors and CMD risk factors, which may take years to develop. [83] Previous studies have reported different results examining the association between sedentary time and CMD risk factors cross-sectionally versus longitudinally, suggesting a “delayed effect” of sedentary time on CMD risk factors. [83]For example, Davison et al. did not find a cross-sectional association between non-Hispanic white girls’ TV viewing and BMI, but longer TV time at age 7 was related to higher probability of being overweight at age 11.
[99]Similarly, baseline sedentary time did not predict insulin resistance after 1-year follow-up in UK adults, [100]but was significantly and positively associated with insulin resistance after 5.6 years of follow-up. [101]Therefore, a longitudinal study design with a “latency period” between health behaviors and CMD risk factors is preferred to examine the behavior-risk associations.
Do behavior-CMD risk factor associations differ between children and adults?
considered adult diseases, has also been increasing in pediatric populations around the globe. [102-104]
The difference in increasing rates of obesity and other CMD risk factors in children versus adults are hypothesized to be due to a few reasons. [2]First, children and adults may respond to the changing environment differently, characterized by disparities in change rates or patterns in health behaviors across generations. Studying and comparing the changes in adult versus child behaviors over time can provide more insights into this hypothesis. Second, there could be age-related biological differences between children and adults that cause different responses to the same environment and health behaviors. An examination of the association between eating and PA behaviors with CMD risk factors among adults versus children will improve understanding of this hypothesis. Although dietary and PA correlates of CMD risk factors are well-documented in adults and children, [105-107] few studies have examined or compared the behavior-risk association among children versus adults. [29] The household-level data in CHNS provides a unique opportunity to examine how health behaviors are related to CMD risk factors in children and their parents differently, controlling for shared socioeconomic and living environment.
Summary
CHAPTER 3. CONCORDANCE OF HEMOGLOBIN A1C, BLOOD PRESSURE, AND C-REACTIVE PROTEIN BETWEEN CHILDREN AND THEIR PARENTS IN CHINESE
HOUSEHOLDS1
Overview
China has the world’s highest diabetes prevalence, which along with hypertension and inflammation, continues to grow particularly among children. Little is known about the strength of the association of these cardiometabolic risk factors between parents and their children, thus the potential of household-based strategies to reduce risk is unknown. We aimed to examine the parent-child association for hemoglobin A1c (HbA1c), blood pressure (BP), and C-reactive protein (CRP) in a large, geographically-diverse Chinese sample.
In 940 parent-child pairs (children aged 7-17y) who participated in the 2009 China Health and Nutrition Survey, we measured each individual’s HbA1c and CRP using fasting blood, and BP. We used sex-specific random-effects linear regression to examine the parent-child association for these risk factors, accounting for within-family clustering.
Child’s HbA1c was positively associated with parental HbA1c. Beta coefficients ranged from 0.06 (95% CI 0.03-0.12) for father-daughter to 0.43 (95% CI 0.28-0.58) for mother-son pairs. We also detected a positive mother-daughter association for BP and positive father-child associations for CRP.
Introduction
The prevalence of cardiometabolic disease (CMD) risk factors (e.g., obesity, diabetes, hypertension) has increased dramatically over the past two decades in China, with a faster increase in children relative to adults. [1, 2] Children share genetic and environmental factors, and health behaviors with parents, [12] which could underlie clustering in CMD risk factors in the household. Parental obesity has been associated with childhood obesity. [108] Correlations of fasting insulin [109] and blood pressure (BP) [39] between children and their parents were also observed in Western countries. To our knowledge, no study has determined the parent-child associations for hemoglobin A1c (HbA1c) and BP in a large, geographically-diverse Chinese sample.
Much of the literature in China has focused on the role of grandparents rather than parents. Partially this is because three-generation (grandparents, parents, and children) households are common in China. Li et al. found that living with grandparents was positively associated with childhood obesity, because grandparents are more likely to indulge their
grandchildren with modern, unhealthy food and screen-based sedentary behaviors, especially in single-child households. [24] Nevertheless, to our knowledge, no study has examined whether living with a grandparent is associated with children’s obesity-related CMD risk factors. Furthermore, whether the parent-child concordance in these risk factors differs when
grandparents live in the household has been unaddressed in the literature. Understanding these questions will help identify children at high risk of CMD.
Chinese children. [1] Given existing evidence on the impact of inflammation on the development of CMD risk factors, [110] we also examined the parent-child association for C-reactive protein (CRP). We further tested whether household structure (i.e. living with grandparents or not, having siblings or not) relates to children’s HbA1c, BP, and CRP, or modifies the parent-child association for these factors.
Methods
CHNS. The CHNS collected health data in 228 communities in nine diverse provinces
throughout China (North: Heilongjiang, Liaoning; Central: Shandong, Henan, Jiangsu; South: Hunan, Hubei, Guangxi, Guizhou) in eight survey rounds from 1989-2009. We used
questionnaires to collect sociodemographic, anthropometric, and health information. The 2009 survey collected fasting blood for the first time. Using a multistage, random cluster design, a stratified probability sample was used to select counties and cities stratified by income using State Statistical Office definitions. [111] Communities and households were then selected from these strata. The CHNS cohort initially mirrored national age-sex-education profiles [112] and these initial households were followed over time. Details on the survey procedures are described elsewhere. [113] The study was approved by the Institutional Review Board at the University of North Carolina at Chapel Hill, the China-Japan Friendship Hospital, Ministry of Health, and the National Institute for Nutrition and Health, Chinese Center for Disease Control and Prevention. Subjects gave informed consent for participation.
Analysis sample. We used data from all children and adolescents aged 7-17y in the 2009
CRP data (n=76), or missing any covariates (n=76). We also excluded the parent-offspring pairs if parents were taking diabetes (n=2) or hypertension medication (n=37). For CRP, we excluded subjects who had CRP>10mg/L (n=22) because it indicates current infection. [114] Our final analytic sample has a total of 940 parent-child pairs, including 598 mother-child and 525 father-child pairs for HbA1c, 810 mother-father-child and 735 father-father-child pairs for BP, 577 mother-father-child and 493 father-child pairs for CRP. Excluded children were slightly older, had lower household income, and were more likely to live in the South region and in rural areas than the analytic sample. There were no statistically significant differences in sex, HbA1c, systolic (SBP) or diastolic BP (DBP) z-scores, CRP, or prevalence of overweight/obesity in those included and excluded from the analytic sample.
Measures. Blood samples were collected by venipuncture following overnight fasting.
Laboratory analysis methods are described in detail elsewhere. [32] While we use continuous HbA1c in our central analyses, elevated HbA1c was defined in secondary analyses using HbA1c≥5.7% for both children and adults as recommended by American Diabetes Association for prediabetes and diabetes. [115] We combined prediabetes and diabetes as elevated HbA1c because diabetes (HbA1c≥6.5%) is rare in children and adolescents (1% in our study sample). We defined parental HbA1c status using the same cut-point for consistency.
Trained physicians measured BP in triplicate and the mean was calculated. Children’s SBP and DBP z-scores were calculated based on the age-, sex-, and height-specific BP percentile algorithm for children using the US CDC 2000 growth curve reference. [116] We used
prehypertension and hypertension in children 16. We combined prehypertension and
hypertension as elevated BP because hypertension (SBP z-score or DBP z-score≥95th percentile of the algorithm) is uncommon in children and adolescents (7% in our study sample). We defined parental BP status using the same cut-point for consistency. [117]
We measured high-sensitivity CRP via the immunoturbidimetric method 13. The intra- and inter-assay coefficients of variation were <6.0% and <7.0%, respectively. We used
continuous CRP measures in central analyses, and elevated CRP was defined as CRP 1-10mg/L in children and 3-10mg/L in adults in secondary analyses. [114, 118]
Trained staff measured child’s height (without shoes), weight (in light clothing), and waist circumference (midway between the lower rib margin and the iliac crest). We classified pediatric weight status (normal/overweight/obese) using age- and sex-specific reference data from the International Obesity Task Force. [119]
We collected each individual’s dietary intake using three consecutive 24-hour dietary recalls at the individual level and a food inventory at the household level. [120] We used a seven-day physical activity (PA) recall across a variety of domains to collect each individual’s participation and time spent in different types of PA, and calculated PA using hours spent in each activity multiplied by metabolic equivalents (METs) for that activity. [121]
Covariates. Covariates included in the analyses were child’s age and sex, parental age,
household structure (two-/three-generation; one/more than one child), household income (tertiles), geographic region (North/Central/South), highest parental education (none or primary/middle school/high school/technical, college or higher), household residence
(mg/d, quartiles, BP models only), and PA (MET-hrs/wk, quartiles) as risk factors of child’s HbA1c, BP, and CRP.
Statistical analyses. All analyses were conducted using Stata 14.0 (Stata Corporation,
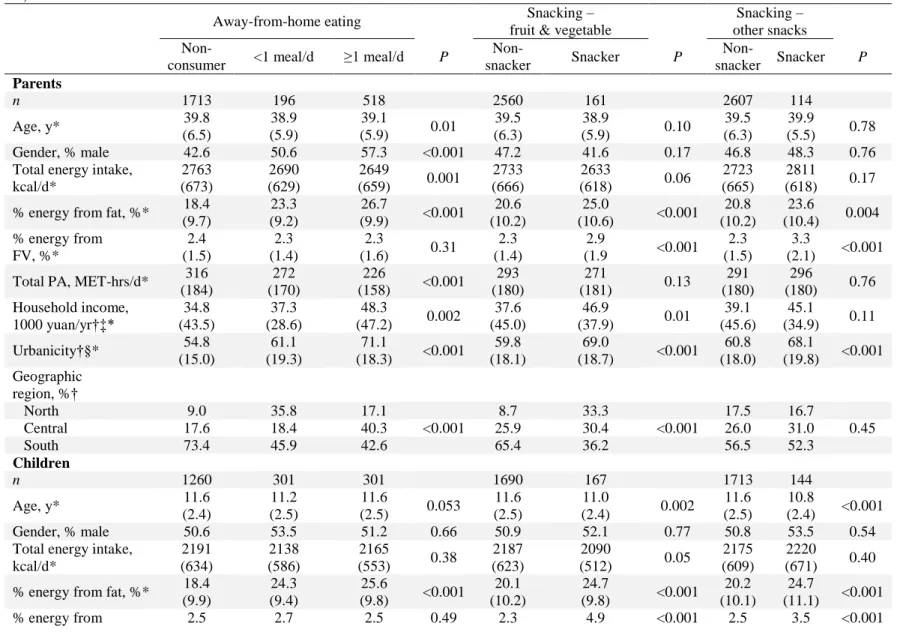
College Station, TX, USA). In descriptive analyses, we examined demographic characteristics of our analytic sample using the chi-squared test. We also tested differences in the predicted mean levels of HbA1c, BP, and CRP in children by household structure using random-effects linear regression, accounting for within-household clustering and adjusting for child’s age and sex. Then, using random-effects linear regression, we compared the predicted mean levels of clinical and anthropometric variables among children whose parents had elevated versus normal HbA1c, BP, or CRP, adjusting for household sociodemographics, child’s energy intake and PA in all models, and sodium intake in BP models only. To maximize sample size, we performed analyses separately for mother-child and father-child pairs. In the mother-child model, mother’s elevated HbA1c, BP, or CRP status was defined as elevated status for mothers, and elevated, or normal, or unknown status for fathers. A similar definition was used in the father-child model.
Last, we used sex-specific random-effects linear regression models to estimate the parent-offspring associations for HbA1c, BP, and CRP, adjusting for the same set of covariates. To examine whether the associations differed by child’s or parental age, household structure, or other household sociodemographics, we tested effect measure modification of these factors using the Wald test.
Sensitivity analyses. We ran three sets of sensitivity tests. First, we ran logistic regression
child’s weight status in the random-effects linear regression models. Third, we tested the associations between overweight/obesity with elevated HbA1c, BP, and CRP in children.
Results
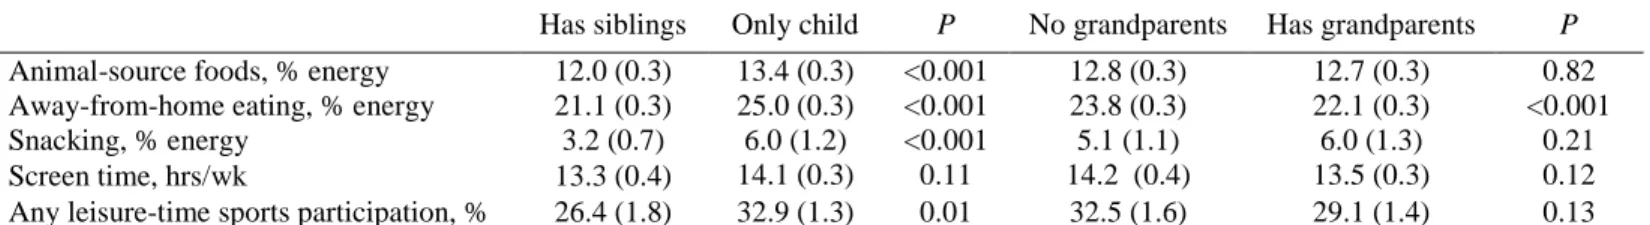
Among the 867 mother-child and 779 father-child pairs, the mean ages of children, mothers, and fathers were 12.1y, 38.5y, and 39.8y, respectively (Table 3.1). A majority of the children lived in three-generation households (65.7%) and had no siblings (73.5%). Mean HbA1c was 5.3% in children, with slightly higher values in only children (5.3%) versus children living with siblings (5.2%, p<0.05). Mean SBP z-scores, DBP z-scores, and CRP in children were -0.5, 0.4, and 0.7mg/L, respectively, and did not differ by household structure.
Boys and girls whose parents had elevated HbA1c had higher HbA1c (Table 3.2). For example, mean levels of HbA1c was 5.61 (95% CI=5.46-5.76) and 5.26 (95% CI=5.19-5.34) in boys whose mother had elevated versus normal HbA1c, respectively. For BP, daughters of mothers with elevated BP had higher SBP (mean=-0.24) and DBP (mean=0.52) z-scores compared to those of mothers with normal BP (SBP=-0.63, DBP=0.32). However, similar patterns were not observed for father-daughter pairs or for boys. Children whose fathers had elevated CRP also had higher CRP compared to children whose fathers had normal CRP
(1.4mg/L versus 0.8 mg/L in boys and 0.9mg/L versus 0.5mg/L in girls, p<0.05). There were no statistically significant differences in obesity measures [prevalence of overweight/obesity, waist circumference, waist-to-height ratio (waist circumference divided by height)] in children whose parents had elevated versus normal HbA1c or BP, whereas boys were more likely to be
overweight/obese if their fathers had elevated CRP.
father-daughter pairs to 0.43 (95% CI 0.28-0.58) for mother-son pairs. The positive association was consistent with logistic regression models (Supplemental Table 3.2), which shows increased odds of having elevated HbA1c comparing children of parents with elevated versus normal HbA1c. ORs ranged from 3.91 (95% CI 1.77-8.67) for father-daughter pairs to 7.88 (95% CI 3.36-18.47) for mother-daughter pairs. For BP, linear regression showed positive associations between girls’ SBP and DBP z-scores with their mothers’ SBP and DBP, respectively
(Supplemental Table 3.1). We also found a positive father-son association for CRP (beta coefficient=0.15, 95% CI=0.03-0.27; OR=2.06, 95% CI=1.05-4.04). There were no significant effect measure modifications by child’s age, parental age, household structure, or any of the household sociodemographic variables at p<0.1 level.
To test whether findings remained once we accounted for childhood obesity, we further adjusted for child’s weight status in the random-effects linear regression models in sensitivity analyses, which did not substantially change our results for HbA1c and BP, but the father-son association for CRP was attenuated (Supplemental Table 3.3). Overweight/obesity was positively associated with BP in boys and with CRP in both boys and girls, but was not associated with HbA1c (Supplemental Table 3.4).
Discussion
Our study suggests positive associations between children and their parents for HbA1c, between girls and their mothers for BP, as well as between children and their fathers for CRP. Additionally, being an only child was associated with higher HbA1c.
This result is consistent with previous studies on the parent-child association for insulin resistance or diabetes in both Western and Asian populations. [9, 39] Sinaiko et al. found a
correlation for fasting insulin between mothers and their adolescent children in a U.S. population, [9] whereas Park et al. observed parent-child correlation in fasting glucose in Korean adolescents. [39]
For BP, We found a positive association for mother-daughter but not father-daughter or parent-son pairs. The current literature on the concordance between children’s and parental BP is inconsistent. Some studies showed positive parent-child correlations for BP 6, whereas others did not. [42] Despite the inconsistency, our observed association between girls’ and their mothers’ BP is supported by existing literature, which suggested that maternal history of hypertension was associated with greater offspring hypertension risk than paternal history. [8]
children whose parents had normal BP, which may underlie the observed similarity in BP in offspring of parents with elevated versus normal BP. Further, we found a significant positive association between overweight/obesity and elevated BP in boys but not girls, as shown in Table S4. Thus, child’s weight status may play a comparatively stronger role in BP in boys compared to the influence of parental BP status.
Children whose fathers had elevated versus normal CRP also had higher CRP, and boys whose fathers had elevated CRP were also more likely to be overweight/obese, suggesting that childhood obesity might have played a role in the father-child association for CRP. We did not find mother-child associations for CRP possibly due to the lack of association between maternal CRP and child’s weight status. Given existing evidence on the impact of inflammation on the development of diabetes, [110] we hypothesize that the association between child’s and paternal CRP might be related to the father-child association for HbA1c. We did not find differences in obesity measures among children of parents with elevated or normal HbA1c or BP. Further, additionally adjusting for child’s weight status in regression models did not alter the parent-child associations for HbA1c or BP. These findings are supported by previous research, [9] which indicated that elevated HbA1c and BP during childhood cannot be directly attributed to greater adiposity among these children, perhaps reflecting shared genetic, environmental, behavioral contributors and potentially other unmeasured factors. However, the mechanisms underlying the association between children’s and parental HbA1c and BP require further study.
or CRP in children. Our findings suggest no differences in BP or CRP by household structure, whereas only children had higher HbA1c compared to children living with siblings.
Our study has several limitations. First, we chose cross-sectional study design because HbA1c was only measured in 2009. Second, we calculated child’s BP z-scores using the US reference because no age-, sex- and height-specific reference for Chinese children is available. Third, as our study fills a gap in the literature by documenting parent-child associations in CMD risk factors, we did not explicitly investigate mechanisms underlying these associations. Thus, we cannot decompose how much of the association resulted from genetic predisposition versus shared familial environment. Fourth, we were unable to examine whether child’s pubertal status played a role in these associations as we did not have data on pubertal markers in children. While menopausal status could theoretically play a role, the vast majority of mothers in our study (96%) were below the mean age of menopause (49y) in China. [123] Nonetheless, we tested
associations among younger versus older children, as well as among children with younger versus older mothers, and found minimal differences in association. Last, self-reported diet and PA data may be subject to recall bias.
Tables and figures
Table 3.1. Characteristics of the analytic sample
No. of children 940
No. of mother-child pairs 867
No. of father-child pairs 779
Child’s age, y (mean ± S.D.) 12.1±2.9
Maternal age, y (mean ± S.D.) 38.5±4.7
Paternal age, y (mean ± S.D.) 39.8±5.0
Child's gender, % male 56.1
Highest parental education, %
None/primary school 5.9
Middle school 16.4
High school 61.9
College, technical or higher 15.8
Annual household income, yuan (mean ± S.D.)* 40787±43522
Household residence, % urban 24.9
Number of generation, % three-generation† 65.7
Number of children, % one child 73.5
Geographic region, %‡
North 15.8
Central 31.4
South 52.8
Child’s HbA1c, %
Overall mean, mean ± S.D. 5.3±0.5
Predicted mean (95% CI) by no. of generation in the household¶
Two-generation 5.3 (5.3, 5.4)
Three-generation 5.3 (5.2, 5.4)
Predicted mean (95% CI) by no. of children in the household¶**
More than one children 5.2 (5.1, 5.3)
One child 5.3 (5.3, 5.4)
Maternal HbA1c, % (mean ± S.D.) 5.3±0.5
Paternal HbA1c, % (mean ± S.D.) 5.5±0.9
Child’s systolic, diastolic BP z-scores, respectively
Overall mean, mean ± S.D. -0.5±1.1, 0.4±0.8
Predicted mean (95% CI) by no. of generation in the household¶
Two-generation -0.56 (-0.68, -0.43), 0.37 (0.28, 0.45)
Three-generation -0.48 (-0.58, -0.38), 0.44 (0.37, 0.51)
Predicted mean (95% CI) by no. of children in the household¶
More than one children -0.62 (-0.78, -0.45), 0.32 (0.20, 0.44)
One child -0.48 (-0.57, -0.40), 0.44 (0.38, 0.50)
Predicted mean (95% CI) by no. of generation in the household¶
Two-generation 0.6 (0.4, 0.8)
Three-generation 0.8 (0.6, 0.9)
Predicted mean (95% CI) by no. of children in the household¶
More than one children 0.7 (0.5, 0.9)
One child 0.7 (0.6, 0.8)
Maternal CRP, mg/L (mean ± S.D.) 1.2±1.6
Paternal CRP, mg/L (mean ± S.D.) 1.5±1.8
*Total household income inflated to 2011.
†Three-generation: children, parents and grandparents.
32
Table 3.2. Predicted mean levels of clinical and anthropometric measures in children of parents with normal or elevated HbA1c, BP, and CRP*
Maternal HbA1c status
P value
Paternal HbA1c status
P value Normal (<5.7%) Elevated (≥5.7%) Normal (<5.7%) Elevated (≥5.7%) Boys
n 281 66 219 95
Age, y† 12.1±0.2 11.9±0.3 0.47 12.2±0.2 12.4±0.3 0.61
HbA1c, %‡ 5.26±0.04 5.61±0.08 <0.001 5.25±0.05 5.52±0.07 0.003
Height, cm‡ 148.3±0.4 147.8±0.9 0.60 149.4±0.5 148.7±0.8 0.48
Weight, kg‡ 40.4±0.4 40.8±0.9 0.94 41.4±0.5 41.2±0.8 0.86
Overweight/obesity, %ठ13.1 13.6 0.90 13.1 13.6 0.91
Waist circumference, cm‡ 64.0±0.5 65.9±1.0 0.10 64.7±0.5 64.6±0.8 0.98 Waist-to-height ratio‡¶ 0.43±0.003 0.46±0.007 0.054 0.43±0.003 0.44±0.005 0.25
Girls
n 219 58 156 76
Age, y 12.1±0.2 12.3±0.3 0.61 12.3±0.2 12.2±0.3 0.76
HbA1c, %‡ 5.22±0.03 5.46±0.05 <0.001 5.19±0.03 5.47±0.05 <0.001
Height, cm‡ 146.2±0.5 143.9±1.0 0.046 145.5±0.6 145.1±0.9 0.63
Weight, kg‡ 39.1±0.5 37.6±1.0 0.17 38.6±0.6 39.3±0.8 0.52
Overweight/obesity, %ठ11.3 8.3 0.44 8.2 13.1 0.41
Waist circumference, cm‡ 62.3±0.5 61.2±1.0 0.29 62.6±0.6 61.9±0.8 0.50 Waist-to-height ratio‡¶ 0.43±0.003 0.42±0.006 0.71 0.43±0.004 0.43±0.005 0.77
Maternal BP status P
value
Paternal BP status
P value Normal (<120/80mmHg) Elevated (≥120/80mmHg) Normal (<120/80mmHg) Elevated (≥120/80mmHg) Boys
n 254 197 144 275
Age, y 12.0±0.2 12.3±0.2 0.39 12.3±0.2 12.3±0.2 0.99
SBP z-score‡ -0.53±0.07 -0.59±0.08 0.61 -0.59±0.09 -0.59±0.06 0.63
DBP z-score‡ 0.42±0.05 0.42±0.05 0.91 0.39±0.06 0.43±0.04 0.61
33
Weight, kg‡ 40.5±0.5 41.2±0.6 0.32 41.3±0.7 41.6±0.5 0.73
Overweight/obesity, %ठ11.6 17.3 0.10 12.1 14.6 0.47
Waist circumference, cm‡ 64.2±0.5 65.6±0.6 0.09 64.8±0.7 65.2±0.5 0.67 Waist-to-height ratio‡¶ 0.43±0.004 0.44±0.004 0.19 0.43±0.005 0.44±0.003 0.63
Sodium intake, mg/d‡ 4218±193 3950±219 0.36 4309±207 3756±155 0.02
Girls
n 208 157 113 208
Age, y 11.7±0.2 12.7±0.2 <0.001 11.9±0.3 12.4±0.2 0.11
SBP z-score‡ -0.63±0.08 -0.24±0.09 0.002 -0.39±0.10 -0.48±0.08 0.49
DBP z-score‡ 0.32±0.06 0.52±0.07 0.03 0.35±0.08 0.47±0.06 0.24
Height, cm‡ 145.3±0.5 145.5±0.6 0.88 144.6±0.8 145.7±0.6 0.28
Weight, kg‡ 38.1±0.5 38.9±0.6 0.35 37.8±0.7 39.1±0.5 0.14
Overweight/obesity, %ठ8.3 13.2 0.20 7.1 12.4 0.15
Waist circumference, cm‡ 61.9±0.5 62.2±0.6 0.77 62.1±0.7 62.3±0.5 0.77 Waist-to-height ratio‡¶ 0.43±0.003 0.43±0.004 0.63 0.43±0.005 0.43±0.003 0.94
Sodium intake, mg/d‡ 3348±132 3558±150 0.29 3324±175 3510±126 0.40
Maternal CRP status P
value
Paternal CRP status
P value Normal
(<3mg/L)
Elevated (3-10mg/L)
Normal (<3mg/L)
Elevated (3-10mg/L)
Boys
n 373 61 325 56
Age, y 11.9±0.2 13.0±0.4 0.01 12.2±0.2 12.6±0.4 0.99
CRP, mg/L‡ 0.8±0.2 0.9±0.5 0.57 0.8±0.1 1.4±0.3 0.02
Height, cm‡ 148.0±0.4 148.3±1.1 0.83 148.4±0.4 151.5±1.0 0.01
Weight, kg‡ 40.2±0.4 40.5±1.1 0.79 40.8±0.5 44.7±1.1 0.001
Overweight/obesity, %ठ13.1 10.0 0.54 11.5 28.1 0.01
Waist circumference, cm‡ 64.4±0.5 64.4±1.2 1.00 64.4±0.7 66.7±0.5 0.08 Waist-to-height ratio‡¶ 0.44±0.003 0.43±0.008 0.74 0.43±0.003 0.44±0.008 0.50
Girls
34
CRP, mg/L ‡ 0.6±0.1 0.5±0.2 0.84 0.5±0.1 0.9±0.2 0.03
Height, cm‡ 145.7±0.5 147.5±1.1 0.17 145.2±0.5 146.1±1.1 0.46
Weight, kg‡ 38.5±0.4 41.2±1.1 0.03 38.4±0.5 40.5±1.0 0.14
Overweight/obesity, %ठ9.8 12.2 0.63 9.4 16.0 0.29
Waist circumference, cm‡ 61.9±0.4 63.2±1.1 0.77 61.7±0.5 65.4±1.0 0.77 Waist-to-height ratio‡¶ 0.42±0.003 0.43±0.007 0.67 0.42±0.003 0.45±0.006 0.94 *We conducted separate analyses for mother-child and father-child pairs.
†Data are means ± S.E. for all such values.
‡Adjusted for child’s age, household income, geographic region, household residence, child’s total energy intake, child’s total physical activity, parental smoking, and parental education using mixed-effects linear regression or logistic regression models.
35
Supplemental Table 3.1. Random-effects linear regression analysis of the relationships between parents’ and children’s HbA1c, BP, and CRP* Maternal HbA1c (%) Paternal HbA1c (%)
Beta 95% CI Beta 95% CI
HbA1c (%)
Boys (n=364) 0.43 0.28, 0.58 0.18 0.08, 0.28
Girls (n=299) 0.25 0.16, 0.34 0.06 0.03, 0.12
Maternal BP (mmHg) Paternal BP (mmHg)
Beta 95% CI Beta 95% CI
BP z-score Boys (n=496)
SBP z-score 0.007 -0.001, 0.016 0.004 -0.004, 0.013 DBP z-score 0.010 0.002, 0.018 0.003 -0.005, 0.011
Girls (n=398)
SBP z-score 0.020 0.011, 0.028 0.004 -0.006, 0.014 DBP z-score 0.016 0.007, 0.025 0.010 0.005, 0.019
Maternal CRP (mg/L) Paternal CRP (mg/L)
Beta 95% CI Beta 95% CI
CRP (mg/L)
Boys (n=364) 0.06 -0.05,0.16 0.15 0.03, 0.27
Girls (n=299) 0.02 -0.08, 1.11 0.04 -0.03, 0.11
Bold estimates are statistically significant at p<0.05 level.
36
Supplemental Table 3.2. Multivariable logistic regression analysis of parent-child associations for elevated HbA1c, BP, and CRP* Maternal elevated HbA1c† Paternal elevated HbA1c†
OR 95% CI OR 95% CI
Elevated HbA1c†
Boys (n=364) 5.47 2.50, 11.96 5.11 2.18, 11.96
Girls (n=299) 7.87 3.18, 19.48 4.33 1.83, 10.23
Maternal elevated BP† Paternal elevated BP†
OR 95% CI OR 95% CI
Elevated BP†
Boys (n=496) 0.81 0.48, 1.37 0.99 0.55, 1.79
Girls (n=398) 1.63 0.89, 2.97 1.26 0.66, 2.41
Maternal elevated CRP† Paternal elevated CRP†
OR 95% CI OR 95% CI
Elevated CRP†
Boys (n=364) 1.30 0.63, 2.72 2.06 1.05, 4.04
Girls (n=299) 1.44 0.63, 3.29 2.00 0.91, 4.38
Bold estimates are statistically significant at p<0.05 level.
*We conducted separate logistic regression models for mother-child and father-child pairs. Results are shown in odds ratios (ORs) and 95% confidence intervals (CIs). Models adjusted for child’s age, household income (tertiles), parental education (none or primary/middle school/high school/technical, college or higher), parental smoking (current smoker/nonsmoker), household residence (urban/rural), geographic region (North/Central/South), child’s total sodium intake (mg/d, quartiles, BP models only), number of generation in households (2-/3-generation), number of child in households (1/>1), child’s total energy intake (kcal/d, quartiles) and child’s physical activity (MET-hrs/wk, quartiles).
†Elevated HbA1c: HbA1c≥5.7%. Elevated BP: SBP z-score or DBP z-score ≥90th
percentile of the age-, sex-, and height- specific BP percentile or
37
Supplemental Table 3.3. Random-effects linear regression analysis of the relationships between parents’ and children’s HbA1c, BP, and CRP, additionally adjusting for child’s weight status*
Maternal HbA1c (%) Paternal HbA1c (%)
Beta 95% CI Beta 95% CI
HbA1c (%)
Boys (n=364) 0.46 0.30, 0.62 0.18 0.08, 0.28
Girls (n=299) 0.24 0.16, 0.33 0.06 0.01, 0.11
Maternal BP (mmHg) Paternal BP (mmHg)
Beta 95% CI Beta 95% CI
BP (z-score)
Boys (n=496)
SBP z-score 0.007 -0.001, 0.015 0.003 -0.005, 0.012
DBP z-score 0.010 0.002, 0.017 0.002 -0.006, 0.010 Girls (n=398)
SBP z-score 0.019 0.010, 0.028 0.005 -0.005, 0.014 DBP z-score 0.016 0.007, 0.025 0.010 0.001, 0.019
Maternal CRP (mg/L) Paternal CRP (mg/L)
Beta 95% CI Beta 95% CI
CRP (mg/L)
Boys (n=364) 0.07 -0.04,0.17 0.12 0.001, 0.25
Girls (n=299) 0.01 -0.08, 0.11 0.04 -0.04, 0.11
Bold estimates are statistically significant at p<0.05 level.
38
Supplemental Table 3.4. Odds ratios (95% confidence intervals) of elevated HbA1c, BP, and CRP* according to overweight/obese status† in children
Elevated HbA1c Elevated BP Elevated CRP
Normal weight
Overweight/
obese
Normal weight
Overweight/
obese
Normal weight
Overweight/
obese
Boys
No. of cases (%) 59 (17.6) 7 (15.9) 66 (15.2) 18 (26.5) 98 (31.4) 24 (58.5)
Multivariable model‡ 1.00 (ref.) 0.75 (0.28, 1.97) 1.00 (ref.) 2.36 (1.29, 4.34) 1.00 (ref.) 3.45 (1.74, 6.89) Girls
No. of cases (%) 41 (14.2) 7 (22.6) 61 (19.6) 13 (31.7) 68 (21.5) 13 (38.2)
Multivariable model‡ 1.00 (ref.) 1.27 (0.44, 3.67) 1.00 (ref.) 1.96 (0.95, 4.02) 1.00 (ref.) 3.00 (1.28, 7.01) Bold estimates are statistically significant at p<0.05 level.
*Elevated HbA1c: HbA1c≥5.7%. Elevated BP: SBP z-score or DBP z-score ≥90th
of the age-, sex-, and height-specific BP percentile or BP≥120/80mmHg for children using the US CDC 2000 growth curve reference; BP≥120/80mmHg for adults. Elevated CRP: 1-10 mg/L for children and 3-10 mg/L for adults.
†Overweight/obese: ≥85th percentile of the age- and sex-specific reference data from the International Obesity Task Force.
ENDNOTES
1
CHAPTER 4. PARENT-CHILD ASSOCIATIONS FOR CHANGES IN DIET, SCREEN TIME, AND PHYSICAL ACTIVITY ACROSS TWO DECADES IN MODERNIZING
CHINA: CHINA HEALTH AND NUTRITION SURVEY 1991-2009
Overview
While the household context is important for lifestyle interventions to reduce cardiometabolic disease, few studies have examined parent-child associations for diet and physical activity (PA) changes over time in a rapidly urbanizing country with burgeoning cardiometabolic disease rates. We aimed to investigate changes in diet, screen time, and PA behaviors over time in children and their parents living in the same household, and examine the parent-child association for these behaviors.
We studied dietary, screen time, and PA behaviors in 5,201 parent-child pairs (children aged 7-17y) using longitudinal data from the China Health and Nutrition Survey (1991, 1993, 1997, 2000, 2004, 2006, and 2009). We collected three-day 24-hour recall diet data to generate percentages of energy from animal-source foods, away-from-home eating, and snacking from 1991-2009, which are known urbanization-related behaviors. We used a seven-day PA recall to collect screen time (hours/week) and leisure-time sports participation (yes/no) since 2004. We examined the changes in children’s and parents’ behaviors over time using random-effects negative binomial regression for diet and screen time, and random-effects logistic regression for leisure-time sports. We then regressed each of the behaviors of offspring on each of their
We observed increases in energy from animal-source foods, eating away-from-home, and snacking, as well as screen time and leisure-time sports in parents and children over time, with different rates of change between children and their parents for some behaviors. We found positive parent-child associations for diet, screen time, and PA. When parental intakes increased by 10% energy from each dietary behavior, children’s increase in intakes ranged from 0.86% to 1.27% total energy for animal-source foods, 0.23% to 0.42% for away-from-home eating, and 3.21% to 7.92% for snacking. Children were also more likely to participate in leisure-time sports if their parents participated in leisure-time sports.
Our findings support household-based health behavior interventions targeting both children and their parents. However, generation-specific intervention strategies may be needed for children and adults, especially for dietary behaviors, which changed differentially in children versus parents in this rapidly modernizing population.
Introduction
with modernization, rates of change in childhood eating behaviors have been shown to differ from those of adults. [50]
Past research on the parent-offspring association for diet and PA, however, is mostly cross-sectional. These studies were unable to examine the change of diet and PA behaviors over time, especially in rapidly modernizing populations such as China. Evaluating and comparing changes in diet and PA behaviors in children and their parents is essential to understand whether urbanization influences children and adults differently and to track whether changes in children mirror those of their parents. Although a few longitudinal studies have investigated the parent-child association for diet and PA behaviors, these studies have focused on high income countries [12] or only examined the mother-child association. [11, 125] Besides the influence of parents, the presence of grandparents and siblings may also play a role in children’s health behaviors, possibly because grandparents are more likely to indulge their grandchildren with modern, unhealthy foods and screen-based sedentary behaviors, especially in single-child households. [23-25] Nonetheless, to our knowledge, no research has examined how household structure (i.e. living with grandparents or not, having siblings or not) relates to children’s diet and PA
behaviors in large Chinese population-based studies.
To address these gaps, we used longitudinal data from children and their parents enrolled in the China Health and Nutrition Survey (CHNS) from 1991 to 2009 to study changes in
Methods
CHNS. The CHNS is a household-based longitudinal cohort study with ongoing data
collection in 228 communities across nine provinces throughout China (North: Heilongjiang, Liaoning; Central: Shandong, Henan, Jiangsu; South: Hunan, Hubei, Guangxi, Guizhou) in nine survey rounds from 1989-2011. Using a multistage, random cluster design, a stratified
probability sample was used to select counties and cities stratified by income using State Statistical Office definitions. [111] Communities and households were then selected from these strata. We used questionnaires to collect demographic, socioeconomic, behavioral, and health information from each household member. The CHNS cohort initially mirrored national age-sex-education profiles [112, 128, 129] and the provinces in the CHNS sample constituted 44% of China’s population in 2009 (according to 2009 census). More details on the survey procedures are described previously. [130] The study was approved by the Institutional Review Board at the University of North Carolina at Chapel Hill, the China-Japan Friendship Hospital, Ministry of Health, and the National Institute for Nutrition and Health, Chinese Center for Disease Control and Prevention. Subjects gave informed consent for participation.
Analysis sample. We used longitudinal data from 1991, 1993, 1997, 2000, 2004, 2006,