O R I G I N A L R E S E A R C H
Open Access
Comprehensive evaluation model of wind
power accommodation ability based on
macroscopic and microscopic indicators
Gengyin Li
*, Guodong Li and Ming Zhou
Abstract
This article explores and establishes comprehensive evaluation index system of wind power accommodation ability considering microscopic index and macroscopic index, and the index system includes conventional evaluation indexes such as forecast deviation, simultaneity factor and anti-peak rate, also newly introduced evaluation indexes such as installed capacity, power adequacy and accommodation space. Bayesian weight modified method is used for solving index weights of 8 wind power accommodation indexes. The paper puts forward a comprehensive evaluation model of wind power accommodation ability based on improved radar chart method, and this model changes traditional radar chart fan-shaped sector to quadrilateral evaluation region, and increasing angle bisector can solve the problem that evaluation results are not unique. It constructs new area and perimeter vectors of radar chart, which make the evaluation results give consideration to level of aggregation and balance degree of evaluation objectives, and case study results show that this model has a certain practical value.
Keywords:Wind power accommodation ability, Comprehensive evaluation, Macroscopic index, Microscopic index, Index weight, Radar chart method
1 Introduction
Wind power has volatility, intermittent and randomness characteristics, and it is different from thermal power, hydro-power and nuclear power. Wind power’s output synchronously changes according to wind speed with volatility characteristics, and these characteristics also increase difficulty of wind power accommodation to grid effectively. At present, effective accommodation for large-scale wind power is a difficult problem, and many countries are also in the hard work and exploration. In power grid planning and construction, wind farms are often located in remote areas with weak grid construc-tion, and wind power accommodation ability is very limited. How to evaluate wind power accommodation ability has already become one of the most important content of electric power researchers, and this problem for power grid operation and wind power development is of far-reaching significance.
Assessment of wind power accommodation ability is based on many factors including power supply, power grid, and load. Its objective is to evaluate wind power or electricity in power system that can be admitted within the agreed time scale and spatial scale. This is a multi-objective optimization problem. It is not only to consider system security, but also to consider economic and environmental issues. And how to find optimal solution for the multi-objective problem is the pursuing goal of vast number of electric power scholars. Prerequisite of evaluating wind power accommodation ability is analyz-ing its influence factors, references [1–4] made in-depth discussion on the key issues of wind power accommoda-tion and its influence factors. Based on the analysis of wind power development in China, reference [1] learned from the advanced experience of Europe, United States and other countries, and discussed the factors affecting wind power accommodation from system regulating capacity, power transmission capacity, wind power tech-nology performance, wind power dispatching and oper-ation level, and proposed measures to promote wind power accommodation from the aspects of technology,
© The Author(s). 2019Open AccessThis article is distributed under the terms of the Creative Commons Attribution 4.0 International License (http://creativecommons.org/licenses/by/4.0/), which permits unrestricted use, distribution, and reproduction in any medium, provided you give appropriate credit to the original author(s) and the source, provide a link to the Creative Commons license, and indicate if changes were made.
* Correspondence:[email protected]
theory, policy, in the light of development characteristics of China power grid. References [2–4] carried out assessment of wind power accommodation ability con-sidering actual situation of regional and provincial power grids. Reference [2] made the calculation of peak regula-tion capacity, and provided accommodaregula-tion ability range of wind power considering peaking constraint, while reference [3] proposed wind power assessment method of accommodation ability allowed wind abandoned in a small amount in the difficult peaking period. Existing evaluation and analysis of wind power accommodation ability focus on the qualitative analysis level despite clear thinking and rich content, but due to lack of necessary practical experience, they are still difficult to get effective application.
Purpose of study on the problem of wind power accommodation is to guide the actual gird operation and to achieve reliable accommodation of renewable energy in power grid. Therefore, it is more practical to study wind power accommodation considering actual grid situation. Reference [5] looked at wind power accommodation problem in the perspective of low car-bon, and put forward the development of renewable energy heating and electric vehicle charging mode according to renewable energy distribution and load characteristics. Its purpose is to promote effective accommodation of renewable energy and to reduce carbon emissions and environment pollution. Reference [6, 7], respectively, proposed new research ideas for the analysis of wind power accommodation ability of actual power grids, and reference [8] presented assessment method of wind power accommodation ability based on Balmorel model, and carried on verification analysis in a provincial power grid.
Many scholars have carried out in-depth research for wind power accommodation. In reference [9], dynamic response index was put forward for wind power fluctu-ation, it also discussed wind power accommodation fac-tors from voltage, power grid and load angles, and more specifically described the effect mechanism of wind power accommodation. Reference [10] constructed multi-objective day-ahead assessment model of wind power accommodation ability for its maximum and economy accommodation, and proposed an evaluation model based on fuzzy multi-objective optimization. For the contradiction between conventional thermal power and renewable energy after wind power and other renewable energy access network, reference [11] constructed grid dispatching decision-making model considering wind power accommo-dation ability, to coordinate the optimal operation between conventional thermal power and renewable energy. Refer-ence [12] creatively proposed online rolling revision strat-egies of generation plan that could effectively improve grid accommodation ability for wind power, and optimized and
coordinated with conventional day-ahead plan scheduling and dispatching. This theory has laid an important foundation for subsequent accommodation ability as-sessment of wind power in multiple time scale. In refer-ences [13–17], calculation and analysis of wind power accommodation ability were carried out combined with actual area power grids, including combination of local accommodation and outward transportation accommo-dation [14], offshore wind power accommodation mode [16], overseas typical experience of wind power accom-modation [17]. The above research further extends the theory and practical application of wind power accom-modation ability assessment, and opens up research ideas. But these research methods were only from a certain point of view, not from a more comprehensive and systematic point of view to study wind power ac-commodation ability assessment.
Assessment of wind power accommodation ability is a systemic problem, restricted by many factors. This paper opens a new road and explores the establishment of comprehensive evaluation index system of wind power accommodation ability from two aspects of microscopic index and macroscopic index, covering power energy, power structure, load level, wind power characteristics, technical level and so on. Then, it intro-duces Bayesian weight modified method to solve index weight coefficients, and adopts improved radar chart method for the comprehensive assessment of wind power accommodation ability. This method is intuitive and convenient, which can be effectively applied in ac-tual operation of power grid.
2 Evaluation index system of wind power accommodation ability
Through the analysis of references at home and abroad, it can be seen that most are in qualitative analysis for a regional accommodation ability of wind power and its influencing factors, and the references with quantitative assessment are relatively less. Existing quantitative evaluation is focused on calculating grid accommoda-tion wind power electricity or energy [11,13,15]. There is lack of consensus on how to measure the accommo-dation ability of power grid [18], while in practical work there is also lack of index system to measure a regional accommodation ability of wind power, which has be-come the problem to be solved in evaluation of renew-able energy accommodation ability.
transmission channel and so on. For convenience of index analysis, this paper divides many indexes into macroscopic and microscopic indexes according to glo-bal or local factors that affect accommodation ability of wind power. For example, minimum technical output of generating units and technical level of wind power belong to microscopic indexes, while load level and power structure belong to macroscopic indexes. Ac-cording to index design principles such as systematic-ness, observability and correlation, this paper designs comprehensive evaluation index system of wind power accommodation ability from macroscopic and micro-scopic perspectives. Different from conventional evalu-ation index system, the macroscopic and microscopic indexes proposed in this paper are not a kind of direct statistical indicators, but comprehensive indicators formed by a variety of related factors.
2.1 Macroscopic indicators
Macroscopic indicators reflecting wind power accom-modation ability are considered from the point of view of the whole network. They could play an important role in the analysis and provide reference for wind power accommodation study. The macro-scopic indicators establishment of this paper is mainly from 4 aspects such as installed generation capacity, generation energy, power supply structure and accom-modation space. And its metering cycle is set on a monthly average [19, 20].
(1). Installed Capacity Index (ICI) is defined as the ratio that installed generation capacity outnumbering maximum load of the local area. Under the condition of certain load level, the larger the installed generation scale, the more limited the system accommodation ability will be [21]. This index is different from installed generation capacity, and compares installed generation capacity with load level to form a relative index, which is an indirect reflection of local wind power accommodation ability. It can be expressed as:
IC ¼ LC
1−
1
100% ð1Þ
Where: C represents the total installed capacity of power supply in a region, and L1 represents the local maximum load. Installed capacity index IC character-izes the degree that power supply capacity exceeds load. When this ratio is greater than a certain value, the power of the area is superfluous. For example, the total installed capacity of some provincial grid in
2014 is 40,000 MW, and its maximum load is 25,000 MW, and calculation result of the installed capacity IC is 60%.
(2). Electricity Consumption Index (ECI) is defined as the proportion within a certain period of time that electricity generation outnumbers electricity consumption. This index is different from power generation or electricity consumption index of the whole power grid. The comparison results of the above two indexes are taken as an index to measure wind power accommodation ability of the local power grid [22], which could reflect the magnitude of system accommodation ability. It can be expressed as:
IE¼ EEG U−1
100% ð2Þ
Where:EGrepresents electricity generation of all supply in theory in a certain period of time, and EUis the total electricity consumption. Electricity consumption index IE characterizes the surplus degree of grid electricity gener-ation, and whenIEis larger than a certain value, indicating that electricity excesses in this region. What’s more, elec-tricity accommodation index IE discussed in this paper does not consider power delivery situation, which will be considered in microscopic indexes.
(3). Power Adequacy Index (PAI) is defined as the ratio of the difference of maximum adjustable output and minimum technical output to maximum prediction output of wind power. The index is influenced by maximum adjustable output, minimum technical output and maximum forecasting output of wind power. It comprehensively reflects the influence of the above 3 factors on accommodation ability of wind power [23]. It can be expressed as:
IP¼PmaxP−Pmin
w 100% ð3Þ
(4). Accommodation Space Index (ASI), which is defined as the ratio of actual generating capacity of wind power to generating capacity in theory, can be expressed as:
IA¼EEA
F100% ð4Þ
Where: EA and EF are respectively actual generating capacity of wind power and forecasting generating cap-acity. Actual generating capacity of wind power can be calculated by time sequel production simulation method, and wind power generating capacity in theory can be ob-tained by using wind energy resources calculation. Ac-commodation space IA directly reflects the wind power accommodation ability of grid (usually less than 100%), less value of which means less accommodation space, and when its value is less than a certain value, aban-doned wind problems of power grid in this region would be more serious.
2.2 Microscopic indicators
The microscopic index reflecting accommodation ability of wind power is based on influence factors, that make the establishment of comprehensive evaluation index, and each factor represents one important aspect of accommodation ability of wind power in some degree. The difference between microscopic and macroscopic indications is that the latter reflects the global problems of wind power accommo-dation, while the former can only reflect one aspect of the problems, but may also have a profound impact on the accommodation ability of wind power [24]. This article es-tablishes index system mainly from the following 4 aspects: wind power transmission section margin, fluctuation charac-teristics, forecast deviation and anti-peak regulation proportion.
(1) Section Margin Index (SMI), which is defined as the ratio of the difference between power supply and local maximum load to the relevant section limit, can be expressed as:
IS ¼CLQ−L2100% ð5Þ
Where: CL is the power supply installed capacity within the cross section of wind power,L2is local max-imum load, and Qis the section limit. The outer trans-mission ability of wind power is reflected by the section margin index IS, and whenIS value is larger than a cer-tain value, it indicates that wind power transmission
ability is limited, and transmission limitation situation of wind power may be serious.
(2) Simultaneity Factor Index (SFI), is the probability of maximum power generation of wind farm, which is a probability statistical index. It is defined as the ratio of maximum generation output of the day to total grid-connected cap-acity in the same day. It reflects the characteris-tics of local wind power output, and is usually expressed as percentage value:
ISF ¼XPnwmax
i¼1 Pi;RC
100% ð6Þ
Where:PwmaxandPi,RCare respectively day wind power maximum output and rated capacity of connected units, simultaneity factor indexISFreflects the wind power char-acteristics, often affects wind power accommodation. The highest and lowest simultaneity factor within a certain period are usually applied, and this paper adopts the aver-age value of highest simultaneity factor.
(3) Forecast Deviation Index (FDI), which is defined as the difference between actual wind power output and forecast value, can be expressed as:
IFD¼jPFP−PAj
A 100%; ðPA≠0Þ ð7Þ
Where:PFand PA are respectively the forecast output and actual value of wind power. Forecast deviation index IFDis also a statistical indicator in different time scales, which reflects the level of wind power forecasting technology, and its accuracy will affect the power grid day-ahead planning and scheduling [25]. When this index value is too large, regular power supply needs to make corresponding power adjustment for the deviation, and it will affect wind power accommodation level in severe cases.
(4) Anti-peak Rate Index (ARI), which is defined as the proportion of wind power output rising in peak period and descending in valley period, can be expressed as:
IAP¼TLþTTH100% ð8Þ
During the circle, wind power output decreases at peak period, but increases at valley period, which is not conducive to wind power accommodation.
3 Bayesian weight modified method
After determining the index system of wind power accommodation ability, it’s needed to determine the weights of each index. Considering that the macro in-dexes and micro inin-dexes of wind power accommoda-tion ability evaluaaccommoda-tion proposed in this paper are all formed by comprehensive calculation of grid’s many aspects. Indicators in this paper are designed manu-ally, although the basic data are generated by actual operation of power grid, there is still a certain degree of subjectivity. Therefore, in order to ensure the feasi-bility and reduce subjective impact, here Bayesian weight modified method will be applied. Bayesian weight modified method revises index weights (sub-jective weights) given by experts using Bayesian for-mula, and then uses the least square method to establish index weight optimization model, and gives the exact solution, so as to achieve the combination objective of subjective weights and objective weights [26, 27]. Specific steps are as follows:
(1) Standardization treatments of evaluation matrix. Let index data matrix of each evaluation pointA= {A1,
A2,…,An}, the collection of indicators isG= {G1,
G2,…,Gm}. The attribute value of evaluation point
Aito indexGjisyij(i= 1, 2,…,n;j= 1, 2,…,m),
the evaluation matrix is:
Y¼ yij nm¼
y11 y12… y1m y21 y22… y2m
… … … …
yn1 yn2… ynm
2 6 6 4
3 7 7
5 ð9Þ
Generally, indexes are divided into benefit-type index and cost-type index. Normalization treatment of benefit-indexGj(such asISF) is as follows:
rij¼ yij max yijj1≤i≤n
n o ð1;2; … ;nÞ ð10Þ
Normalization process of cost-type index Gj (such as
IAP) is as follows:
rij¼
max yijj1≤i≤n
n o
yij
1;2; … ;n
ð Þ ð11Þ
Then the standardized evaluation matrix is:
RA¼ rij nm¼
r11 r12 … r1m
r21 r22 … r2m
… … … …
rn1 rn2 … rnm
2 6 6 4
3 7 7
5 ð12Þ
(2) The weight determination of each evaluation point. In the view of probability theory,
subjective weight can be understood as the prior probability, and the weight of a certain
evaluation point can be understood as posterior probability that is determined with test. In specific evaluation of wind power accommodation ability, correction should be given to the
subjective weights.
The subjective weights of the indexes are u1, u2, …,
um, and then the probability ofGjis:
Xm
j¼1
P Gj ¼
Xm
j¼1
uj¼1; ðj¼1;2; … ;mÞ ð13Þ
Under the indexGj, the probability of evaluating point Aiis:
P G jjAi¼rij ði¼1;2; … ;n; j¼1;2; … ;mÞ
ð14Þ
rijis formed by yijafter standardization, which is deter-mined by the actual situation of each evaluation point. The unified index weight ω(i) of the whole evaluation system is calculated on the basis of rij, sorij is viewd as the conditional probability ofAigivenGj. Using Bayesian
formula, the weight of index j in evaluation point Ai
(posterior probability) is:
P Gj jAi¼ P Gj P AijGj
Xm
j¼1
P Gj P Ai jGj
¼Xmujrij
j¼1
ujrij
¼ωð Þji ði¼1;2; … ;n; j¼1;2; … ;mÞ
ð15Þ
Therefore, the index weight vector of evaluation point is: ω(i)= (ω1(i), ω2(i), …, ωm(i)). For each evalu-ation point, the favorable index is strengthened, and the disadvantage index is weakened.
fi¼
Xm
j¼1
ωð Þjirij ð16Þ
We should choose the weight vectorωj(j= 1, 2,…,m), and for the overall value evaluation of overall evaluation points, the smaller the better, for which the following least squares optimization evaluation model is established:
minX
n
i¼1
Xm
j¼1
ωj−ωð Þji
2
r2
ij
s:t:
Xm
j¼1
ωj¼1
ωj≥0; j¼1;2; … ;m
8 > < > : 8 > > > > > > < > > > > > > :
ð17Þ
To solve the above model as a Lagrange function:
L¼Xn
i¼1
Xm
j¼1
ωj−ωð Þji
2
rijþ2λ
Xm
j¼1
ωj−1
!
ð18Þ
Let ∂∂ωjL ¼0 , ∂∂Lλ¼0 , so that the weight vector of the indexes is obtained:
ωm1¼ðω1;ω2;⋯⋯;ωmÞT ð19Þ
4 Comprehensive evaluation model based on radar chart
Based on refinement and calculation of assessment indica-tors of wind power accommodation ability, this paper introduces radar chart method to comprehensive evalu-ation. Radar chart method is applied to multi-index com-prehensive evaluation model, and it draws radar chart of each evaluation object according to normalized value of each index. Then, derived indicators including area and perimeter of radar chart, could be calculated in a unified agreement rule condition. The quantitative calculation and analysis could be conducted based on the area and perimeter of radar chart, and then gives some qualitative evaluation results or multi-object evaluation compositor.
The advantage of radar chart method is intuitive and vis-ual, and its operation is convenient.
4.1 Basic principles of radar chart method
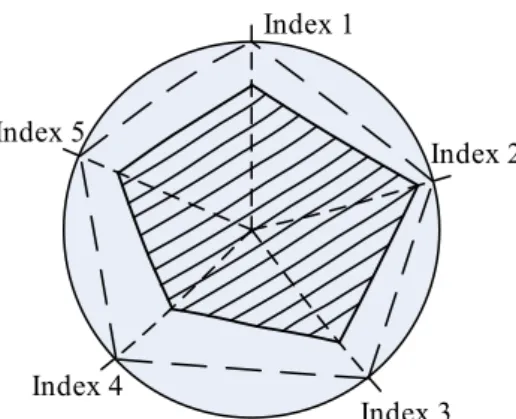
The radar chart analysis method is a common method to display multiple variables, which can map a multi-dimensional space to two-multi-dimensional space. It also can be used to do quantitative comparative analysis by calculating radar chart area. Feature vector of radar chart can be ex-tracted to carry out a specific evaluation, and then to evalu-ate the objects using evaluation function. The traditional radar chart method is a typical method of graphic analysis that does comprehensive evaluation by extract area and perimeter of the graphics. Figure1is a typical radar chart.
In the process of multi-index evaluation using radar chart method, if area value is larger, the overall advantage of evaluation object is larger; and the smaller the area is, the smaller the overall advantage is. When the area of a radar chart is certain, small perimeter value indicates that the radar chart is close to a circle. That is to say, each index corresponding to the order statistics tends to bal-ance, the trend of evaluation object indicators is more coordinated, and the conclusion is opposite with larger perimeter value. However, with regard to the traditional radar chart evaluation method for the same evaluation ob-ject, the area and perimeter feature vectors are closely related to index compositor, even using the same index system. Feature vector value is different with varying com-positor, so that the evaluation results are diverse, and may even be completely contrary to original evaluation results. In view of this shortcoming, radar chart method will be improved based on existing references.
improves the radar chart and feature vectors, which can achieve the quantitative and qualitative assessment to assessment objectives. In this paper, the authors will synthesize the idea of the above documents and make the following improvements to traditional radar chart method:
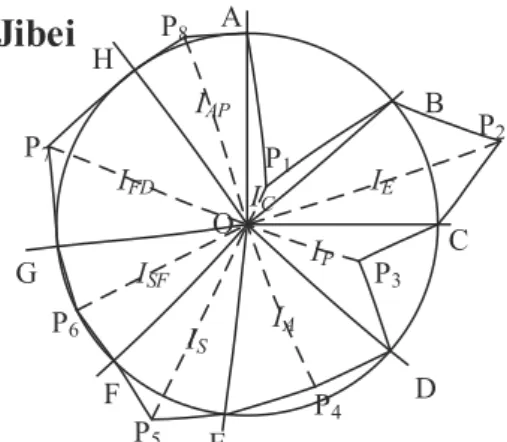
(1) This paper changes angle averaging approach of traditional radar chart method, and adopts corresponding one-to-one relationship between index weight and sector angle, as shown in Fig.2, regional angle of sector OAB and OBC, respectively corresponds to the weight values of index 1 and 2, and weightωicould be conversed to angle valueθi according to following formula:
θi¼2πωi ð20Þ
(2) In order to solve the problem that the evaluation result is not unique, it is necessary to draw a diagonal line of the fan region of each index. OP1
and OP2in Fig.3represents the specific value of
index 1 and 2, respectively, which can be used to
evaluate the corresponding feature vector (mainly includes area and perimeter) of quadrangle OAP1B
and OBP2C as evaluation basis of index 1 and 2.
(3) Each index is set to extract area and perimeter as feature vectorui= (Si,Li), and then the evaluation vector could be constructed as follows:
vi¼ðvi1;vi2Þ ð21Þ
Where:vi1is the evaluation vector area, and the higher the numerical value is, the higher the overall level of evaluation object is, andvi2is the evaluation vector per-imeter, the greater the value is, the better the equilib-rium of evaluation object is. The construction method is as follows:
vi1¼ Si
maxð ÞSi vi2¼ Si
π Li. 2π
ð Þ
2¼
4πSi L2
i
8 > > > > < > > > > :
ð22Þ
Finally, the evaluation result of indexiis obtained: Fig. 2Improved radar chart
fi¼pffiffiffiffiffiffiffiffiffiffiffiffiffiffivi1vi2 ð23Þ
It is not hard to see that the evaluation function repre-sented by formula (23) can meet the basic requirements such as regularity, monotone, and continuity, so that the evaluation results will not change with small changes in the index.
(4) Compared with traditional radar map method, advantages of improved method are mainly reflected in 3 aspects. Firstly, evaluation index is
extended to periphery of radar map (OP1 as
shown in Fig. 2). Secondly, the influence of index weight on sector region of radar map is
optimized. Thirdly, the relative order of all indexes is eliminated by introducing angular bisection line (mainly influence index extraction area Si). As for wind power accommodation
ability assessment, some of assessment indicators after standardization may appear outside of radar map. The evaluation indicators are independent of each other and have inconsistent impact on
Fig. 4Radar chart assessment of wind power accommodation ability in Gansu
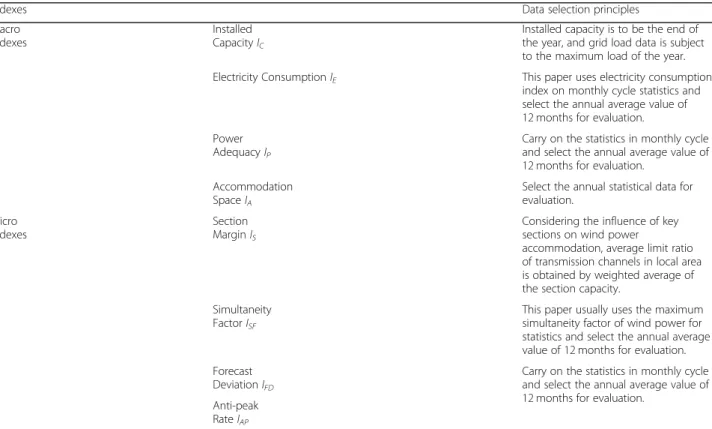
Table 1The boundary conditions of wind power accommodation ability evaluation indicators
Indexes Data selection principles
Macro Indexes
Installed CapacityIC
Installed capacity is to be the end of the year, and grid load data is subject to the maximum load of the year.
Electricity ConsumptionIE This paper uses electricity consumption
index on monthly cycle statistics and select the annual average value of 12 months for evaluation.
Power AdequacyIP
Carry on the statistics in monthly cycle and select the annual average value of 12 months for evaluation.
Accommodation SpaceIA
Select the annual statistical data for evaluation.
Micro Indexes
Section MarginIS
Considering the influence of key sections on wind power
accommodation, average limit ratio of transmission channels in local area is obtained by weighted average of the section capacity.
Simultaneity FactorISF
This paper usually uses the maximum simultaneity factor of wind power for statistics and select the annual average value of 12 months for evaluation.
Forecast DeviationIFD
Carry on the statistics in monthly cycle and select the annual average value of 12 months for evaluation.
assessment results. Therefore, the order of assessment indicators should not affect assessment results. Generally speaking, the improved method in this paper is close to actual wind power accommodation ability evaluation index. However, on the other hand, the improved radar chart method will make operation process more complicated and increase calculation and drawing workload.
5 Case study
5.1 Basic data acquisition
The boundary conditions [31, 32] of each wind power accommodation ability evaluation indicator are shown in Table1.
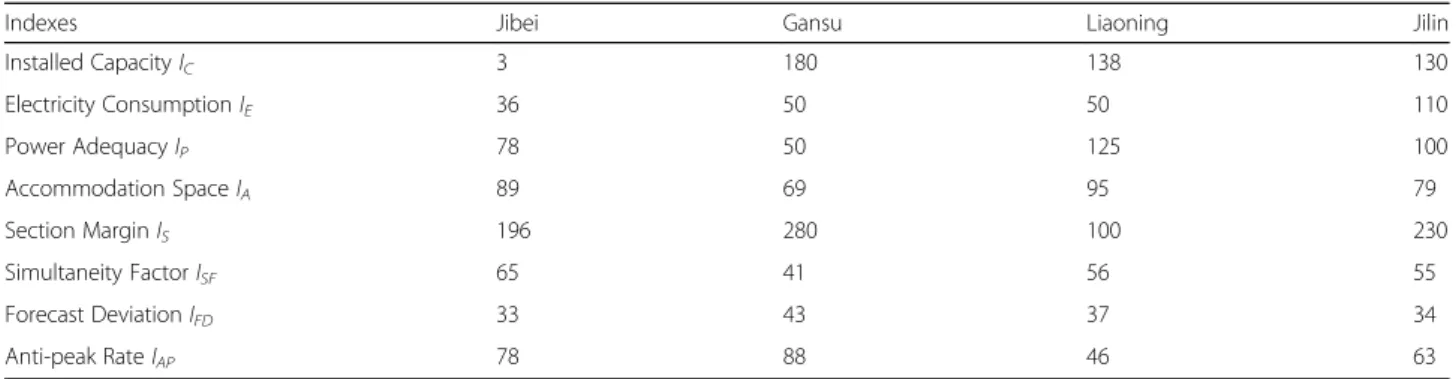
In this paper, 4 provincial power grids in three-north region of China (North, Northwest and Northeast China) are selected as the evaluation objectives of wind power accommodation, respectively including Jibei (in North China), Gansu (in Northwest China), Liaoning (in Northeast China) and Jilin (in Northeast China). They are in terms of existing certain problem on wind power accommodation, based on statistical data in
2014, which could be calculated according to the for-mula (1) to (8), as shown in Table2.
It is necessary to explain that due to the difficulty of data acquisition and data quality reasons, the data of wind power accommodation assessment selected in this paper is optimized on the basis of actual wind power operation in a certain degree, including deletion, modi-fication and filling, only for evaluation examples usage. And the results may be slightly different from actual wind power.
5.2 Evaluation steps of wind power consumption
5.2.1 Index weight calculation
According to the formula (9)-(19), 8 evaluation index weights of wind power accommodation are calculated: ω= (0.141, 0.111, 0.111, 0.146, 0.09, 0.136, 0.156, 0.108). The benefit-type indicators include Installed CapacityIC, Power AdequacyIP, Accommodation Space IA and Sim-ultaneity FactorISF, and cost-type indexes include Elec-tricity Consumption IE, Section Margin IS, Forecast DeviationIFDand Anti-peak RateIAP.
According to the formula (20), weight ωi could be conversed to angleθi:θ= (50.7, 40.0 40.0 52.7 32.5, 49.0, Table 2Comprehensive evaluation data of wind power accommodation of some provincial power grids (%)
Indexes Jibei Gansu Liaoning Jilin
Installed CapacityIC 3 180 138 130
Electricity ConsumptionIE 36 50 50 110
Power AdequacyIP 78 50 125 100
Accommodation SpaceIA 89 69 95 79
Section MarginIS 196 280 100 230
Simultaneity FactorISF 65 41 56 55
Forecast DeviationIFD 33 43 37 34
Anti-peak RateIAP 78 88 46 63
56.3, 38.7), and then radar chart could be mapped ac-cording toθ.
5.2.2 Drawing radar chart
According to the improved radar chart method of Sec-tion 4, radar charts of 4 provincial power grid could be mapped, including Jibei, Gansu, Liaoning and Jilin, as shown in Fig.3,4,5and6.
5.2.3 Assessment results of wind power accommodation ability
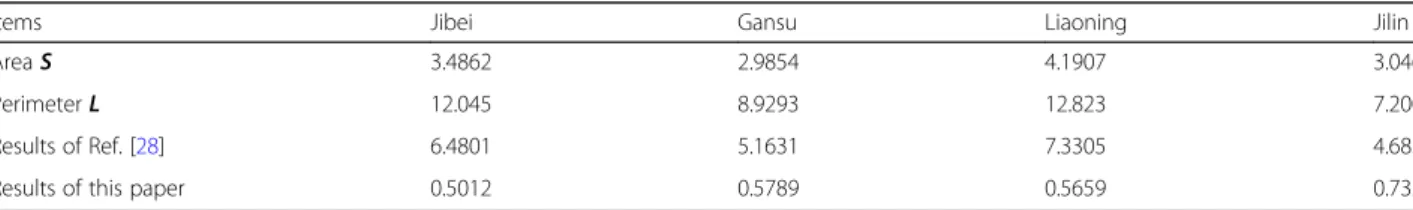
The radar chart vector area and perimeter of wind power accommodation ability assessment of 4 provincial power grids could be calculated. With improved radar chart method and formula (21) and (22), evaluation vector and evaluation results can be obtained, as shown in Table3.
6 Discussion
(1) Based on improved radar chart method, wind power accommodation ability of 4 provincial grids could be comprehensively evaluated. The evaluation results in descending order is: Jilin, Gansu, Liaoning and Jibei, Gansu and Liaoning have little difference, the advantage of Jilin is obvious, and Jibei is relatively poor.
(2) From the point of view of radar chart
appearance, the radar chart area and perimeter corresponding to 8 wind power accommodation ability assessment indexes of each provincial
power grid are fixed, and don’t change with their relative position. It can be seen that relative merits of each index are obvious, so improved radar chart method achieves the effect and radar chart assessment method is intuitive and visual to show wind power accommodation ability of assessment objectives. It provides a new idea for qualitative and quantitative evaluation of wind power accommodation ability.
(3) From the perspective of single evaluation vector, such as area and perimeter of radar chart, the radar chart area 2.98 of Gansu is minimum, Liaoning’s 4.19 is largest, and descending order of radar chart area is Liaoning, Jibei, Jilin and Gansu. The radar chart perimeter 7.20 of Jilin is minimum, Liaoning’s 12.82 is maximum, and descending order of radar chart and descending order of radar chart perimeter is Jilin, Gansu, Jibei and Liaoning. The larger the radar chart area is, the greater of the overall evaluation advantage, and smaller perimeter shows the better equilibrium of evaluation indexes.
(4) By comparing the evaluation results of this paper to reference [28], assessment results sorting of wind power accommodation ability in reference [28] is Liaoning, Jibei, Gansu and Jilin, which is different from this paper’s results. Analyzing the reasons, reference [28] just simply used reference of radar chart area and perimeter for evaluation, but failed to reflect the interaction and impact of
Table 3The comprehensive evaluation result of wind power accommodation ability
Items Jibei Gansu Liaoning Jilin
AreaS 3.4862 2.9854 4.1907 3.0461
PerimeterL 12.045 8.9293 12.823 7.2006
Results of Ref. [28] 6.4801 5.1631 7.3305 4.6833
Results of this paper 0.5012 0.5789 0.5659 0.7325
indexes. After the improvement of this paper, one kind of feature vector with unique properties is proposed, which takes into account both the radar chart evaluation vector area and perimeter of evaluation objects, and ensure the stability of evaluation process. Therefore, the improved radar chart method will get better application in future power grid operation, and has better objectivity and practicality.
It should be pointed out that this paper only chooses typical data of some provinces for evaluation and ana-lysis, and simplifies some data. There may still be some related indicators that have not been fully considered. The main purpose is to verify the effectiveness of the radar chart introduced in this paper. There are still a lot of work to be done in the follow-up, including the model improvement, adaptability analysis of engineering prac-tice, improvement of index system.
7 Conclusions
(1) This paper designs integrated assessment index system of wind power accommodation ability from macroscopic and microscopic angles. Macroeconomic indicators include installed capacity, power consumption, power adequacy and accommodation space index, and
microscopic indicators include section margin, simultaneity factor, prediction deviation and anti-peaking rate index.
(2) The weights of 8 indexes are solved by of Bayesian weight modified method. The method uses the least square method to establish index weight optimization model. The combination of subjective weights and objective weights makes weight calculation results more practical. (3) Radar chart method is introduced to integrated
assessment of wind power accommodation ability, and the method is intuitive and vivid. For traditional radar chart method with not unique assessment results, this paper makes diagonal processing to fan-shaped area corresponding to each indicator, and also constructs a new evaluation feature vector based on area and perimeter feature vectors of radar chart, taking into account comprehensive level and balance degree of evaluation objects. Finally, wind power accommodation ability of 4 provincial power grids is verified, and case study results show that this method has a certain practical application value.
(4) Regarding the future research direction of related content of the manuscript, the authors think that
there are still several key points to be studied in depth, including the selection of specific
indicators, the determination method of index weight, the application improvement of radar chart, etc.. Especially, the establishment of index system is the key of the research. How to select appropriate macroscopic and microscopic indicators is directly related to the evaluation results. In the future, the authors need to analyze the differences between all kinds of indicators in depth and choose more appropriate indicators as research objectives so as to make the evaluation results closer to the engineering reality, so that the research will be more meaningful.
Acknowledgments
This work is supported by project of the National Key Research and Development Program Foundation of China (2016YFB0900100).
Authors’contributions
Gengyin L and Guodong L conceived and designed the study. Guodong L and MZ performed the engineering example verification. Gengyin L and Guodong L wrote the paper. Guodong L, Gengyin L and MZ reviewed and edited the manuscript. All authors read and approved the manuscript.
Funding
This work is supported by project of the National Key Research and Development Program Foundation of China (2016YFB0900100).
Availability of data and materials
Please contact author for data requests.
Competing interests
The authors declare that they have no competing interests.
Received: 22 January 2019 Accepted: 20 September 2019
References
1. Wen, J., Zheng, Y., & Donghan, F. (2009). A review on reliability assessment for wind power.Renewable and Sustainable Energy Reviews, 13(9), 2485–2294. 2. IEA. (2015).World energy outlook 2015. Paris: International Energy Agency. 3. Xue, Y., Lei, X., Xue, F., et al. (2014). A review on impacts of wind power
uncertainties on power systems.Proceedings of the CSEE, 34(29), 5029–5040. 4. Ummels, B. C., Gibescu, M., Pelgrum, E., et al. (2007). Impacts of wind power
on thermal generation unit commitment and dispatch.IEEE Transactions on Energy Conversion, 22(1), 44–51.
5. Abreu, L. V. L., Khodayar, M. E., Shahidehpour, M., et al. (2012). Risk-constrained coordination of cascaded hydro units with variable wind power generation.IEEE Transactions on Sustainable Energy, 3(3), 359–368. 6. Wang, F., Yin, H., & Li, S. (2010). China’s renewable energy policy:
commitments and challenges.Energy Policy, 38(4), 1872–1878.
7. Yang, M., Patiño-Echeverri, D., & Yang, F. (2012). Wind power generation in China: Understanding the mismatch between capacity and generation. Renewable Energy, 41(5), 145–151.
8. Liu, C., Wu, H., Gao, C., et al. (2014). Study on analysis method of accommodated capacity for wind power. Power System Protection and Control, 42(4), 61–66.
9. Cui, H., Jia, W., & Yang, B. (2015). Relevant factors and mechanism analysis for wind power accommodation.North China Electric Power, 44(2), 34–40. 10. Dong, Y., He, S., Liu, J., et al. (2014). Wind power consumption problem in the
view of low carbon power.Power System Protection and Control, 42(5), 12–16. 11. Sun, R., Zhang, T., & Liang, J. (2011). Evaluation and application of wind
power integration capacity in power grid. Automation of Electric Power Systems, 35(4), 70–76.
13. Min, C.-G., & Kim, M.-K. (2017). Flexibility-based evaluation of variable generation acceptability in Korean power system.Energies, 10(1), 825. 14. Yang, Y., Jin, W., & Xiang, T. (2014). Study on support factors of intermittent
power supply integration based on responsivity.Power System Protection and Control, 42(12), 101–105.
15. Qianyao, X. (2016). A probabilistic method for determining grid-accommodable wind power capacity based on multiscenario system operation simulation.IEEE Transactions on Smart Grid, 7(1), 400–409.
16. Li, Z., Han, X., Yang, M., et al. (2010). Power sytem dispatch considering wind power grid integration.Automation of Electric Power Systems, 34(19), 15–19. 17. Shen, W., Wu, W., Zhang, B., et al. (2011). An on-line rolling generation
dispatch method and model for accommodating large-scale wind power. Automation of Electric Power Systems, 35(22), 136–140.
18. Fan, C., Li, Y., Hui, J., et al. (2015). Calculation of admitting capacity of regional power grid for wind power.Engineering Journal of Wuhan University (Engineering Edition), 48(2), 220–224.
19. Wang, N., Wang, J., & He, S. (2011). Cross-border accommodation method and transmission scheme of Jiuquan wind power.Automation of Electric Power Systems, 35(22), 82–89.
20. Sirjani, B., & Rahimiyan, M. (2018). Wind power and market power in short-term electricity markets.International Transactions on Electrical Energy Systems, 28, e2571.
21. Xu, Q., Kang, C., Zhang, N., et al. (2011). A discussion on offshore wind power output characteristics and its accommodation.Automation of Electric Power Systems, 35(22), 54–59.
22. Jalili, H., Sheikh-El-Eslami, M. K., Moghaddam, M. P., et al. (2018). Distributed energy resources' role on reducing reliability cost.International Transactions on Electrical Energy Systems, 28, e2581.
23. Weis, A., Jaramillo, P., Michalek, J., et al. (2014). Estimating the potential of controlled plug-in hybrid electric vehicle charging to reduce operational and capacity expansion costs for electric power systems with high wind penetration.Applied Energy, 115, 190–204.
24. Ritter, M., Shen, Z., Cabrera, B. L., et al. (2015). Designing an index for assessing wind energy potential.Renewable Energy, 83, 416–424.
25. Gurgur, C. Z., & Jones, M. (2010). Capacity factor prediction and planning in the wind power generation industry.Renewable Energy, 35, 2761–2766. 26. Abhinav, S., & Manohar, C. S. (2015). Bayesian parameter identification in
dynamic state space models using modified measurement equations. International Journal of Non-Linear Mechanics, 77, 89–103.
27. Petchey, F., Spriggs, M., Bedford, S., et al. (2015). The chronology of occupation at Teouma, Vanuatu: Use of a modified chronometric hygiene protocol and Bayesian modeling to evaluate midden remains.Journal of Archaeological Science: Reports, 4, 95–105.
28. Li, G., Li, G., Yang, X., et al. (2010). A comprehensive power quality evaluation model based on radar chart method. Automation of Electric Power Systems, 34(14), 70–74.
29. Zhuang, Y., Kang, C., Hu, J., et al. (2009). Quality of power sale market and its comprehensive assessment.Automation of Electric Power Systems, 33(3), 25–29. 30. Li, H., Li, Z., Peng, J., et al. (2013). Research on interactive visualization
clustering method based on the radar chart. Applied Mechanics and Materials, 241(1), 1633–1639.
31. National Electric Power Dispatching and Control Center. (2015).Annual Power Grid Operation Mode of SGCC in 2015. Beijing: State Grid Corporation of China. 32. Zhang, Y., Liu, K., Liao, X., et al. (2018). Stochastic dynamic economic