R E V I E W
Open Access
Optimizing the density of Stark
decelerated radicals at low final velocities: a
tutorial review
Dominik Haas, Sebastian Scherb, Dongdong Zhang
*and Stefan Willitsch
*Correspondence: [email protected] Department of Chemistry, University of Basel,
Klingelbergstrasse 80, 4056 Basel, Switzerland
Abstract
The Stark deceleration technique can produce molecular beams with very low velocities. In order to maximize the density of decelerated molecules, experimental parameters such as the velocity, the velocity spread and the spatial spread of the initial molecular beam as well as the operation characteristics of the decelerator have to be chosen appropriately. In this tutorial review, we describe procedures for the optimization of the density of Stark decelerated radicals for low-velocity applications which are of interest in, e.g., molecule trapping and cold-collision studies.
Keywords: Cold molecules, Molecular beams, Stark deceleration, Radicals
Review
Translationally cold molecules have become an attractive subject of research in recent years. A number of techniques for the generation of cold molecules has been devel-oped [1–5] among which Stark deceleration is one of the most important [3, 6–8]. This method finds a broad range of applications in spectroscopy [9–12], collision-dynamics studies [13–26] and trap loading experiments [27–33]. The principle of Stark decelera-tion has been well documented [2, 3], and a number of operadecelera-tion schemes have been developed for the optimization of Stark-decelerated molecular beams in different types of experiments [34–37].
A Stark decelerator employs time-varying inhomogeneous electric fields produced by an array of dipolar electrodes to slow down pulsed beams of polar molecules [3, 6]. When a packet of molecules approaches a set of electrodes, they are switched to high electric potential. Molecules in low-field-seeking Stark states experience a force which reduces their kinetic energy. The voltages on the electrodes are switched off before the molecules reach the maximum of the dipole potential in order to prevent their re-acceleration after they have passed the electrodes. This procedure is repeated at every pair of electrodes along the decelerator until the molecules have reached their target velocity at the exit of the assembly.
The final velocity of the packet of molecules is controlled by a parameter referred to as phase angle0which corresponds to a scaled position of a “synchronous molecule”
at which the high voltages on the electrodes of the decelerator are switched. Successful
deceleration of the molecules to the target velocity requires careful coupling of the molec-ular cloud into a stable phase-space volume determined by the phase angle [34, 36, 38]. Successful coupling requires prior knowledge of the initial velocity of the molecular pack-age and the incoupling time, i.e., the time required for the molecules to fly from their point of generation to the entrance of the Stark decelerator. Efficient coupling will lead to an optimized beam density after Stark deceleration [34].
In this tutorial paper, we give a comprehensive introduction on how to optimize an experiment to achieve a maximum density of Stark decelerated radicals at low velocities. Such optimizations are of particular interest for trapping experiments [27, 28, 30, 33] and low-energy scattering [39, 40] applications. As an example, we focus on the generation of beams of OH (hydroxyl) radicals widely used in Stark deceleration experiments [27, 33]. The present paper is organized as follows. We start by introducing our source for the generation of high-density molecular beams of radicals and discuss relevant parameters of this source. We then discuss procedures for optimizing the number densities of molecules after Stark deceleration and how to to improve the signal-to-noise ratio of the experiment.
Radical sources
A Stark deceleration experiment is preceded by the formation of a molecular beam of vibrationally and rotationally cold polar molecules. The number density of molecules exit-ing the Stark decelerator critically depends on the initial phase-space distribution and evolution of the expanding gas pulse. In turn, these properties strongly depend on the properties of the gas nozzle used and its operation conditions. A wide variety of valves exists. In another tutorial article of the present series, Vogels et al. [24] have reviewed the suitability of different beam sources for Stark deceleration in the context of collision experiments.
In this section, we briefly describe the characteristics of a discharge radical source based on the “Nijmegen pulsed valve” (NPV) [41, 42] employed in our experiments.
The opening mechanism of the NPV is based on the Lorentz force retracting an alu-minium strip located between two bar magnets through which a current is pulsed. The NPV has proven to be a reliable pulsed gas source capable of delivering high intensity beams at short valve opening times (a few tens ofμs) [41]. Building on these favorable characteristics, a pinhole-discharge source has recently been developed in our laboratory to accompany the NPV [42]. A cross section of the assembly is shown in Fig. 1.
The pinhole discharge is based on the design of Lewandoski et al. [43]. OH radicals are formed by dissociation in a plasma generated from H2O seeded in a noble gas. Depending
on the choice of noble gas, molecular beams in different velocity regimes can be pro-duced. For our Stark decelerator, Kr and Xe yield beams of sufficiently low initial velocity enabling the generation of high-density OH beams at low final velocities.
Fig. 1 Cross section through the pinhole-discharge valve Ref. [42]. The nozzle diameter is 0.5 mm. The thickness of the two discharge plate electrodes is 0.7 mm separated by Macor insulators with a width of 2.3 mm. The gas expands through a conical channel with an opening angle of 60°
beam velocity can be fine-tuned on the level of a few percent, which is useful to optimize the coupling efficiency into the Stark decelerator (see “Velocity spread and spatial spread of the radical beam” section below for a more detailed discussion).
Our experimental setup is displayed in Fig. 2. The NPV body is mounted onto a xyz-translation stage such that the position of the valve relative to a detection laser beam and the central axis of the decelerator can be adjusted. The interior of the valve body acts as a gas reservoir. Normally, the valve is operated at backing pressures in the range 1-3 bar including about 1-2% water vapor at room temperature. The NPV generates short gas pulses of a few tenμs duration at a repetition rate of 10 Hz. The pressure in the source chamber during operation of the valve is on the order of 1×10⁻⁵mbar.
The characteristics of the OH beam were probed using a 282 nm excitation laser beam crossing the gas expansion either about 5 cm downstream from the valve opening or 11.5 mm from the exit of the Stark decelerator. The laser excites OH radicals in their
X2(v = 0)ground state to the first electronically excited stateA2(v = 1), where
vdenotes the vibrational quantum number. The 282 nm laser radiation was generated using a frequency doubled dye laser pumped by a Nd:YAG laser. The output energy of the excitation laser is about 10.0 mJ/pulse. TheA−Xtransition is experimentally found to be saturated at a laser fluence of 1.5 mJ/pulse focused down to a beam waist of 3 mm. Off-resonance fluorescence at 313 nm from theA2(v= 1)−X2(v= 1)transition is collected by a lens coupled to a calibrated photomultiplier tube (PMT) (Electron Tubes B2/RFI, 9813 QB). In order to limit the amount of stray light in the chamber, the laser beam is guided through Brewster windows and is aligned through pinholes with a diam-eter of 3 mm. Further stray light suppression from the discharge process or the excitation laser is achieved by installing bandpass filters in front of the PMT as shown in Fig. 2. A full characterization of the molecular beam properties is given in Table 1.
Optimization parameters
In this section, we give a detailed account on optimization procedures for the generation of cold and dense radical beams using a Stark decelerator. The goal is to optimize the number of radicals decelerated to velocities below 50 m/s. We categorize our optimization procedure into two classes. Class I optimization comprises all the parameters resulting in an increased number density of the decelerated radical package which is important for uti-lizing the Stark deceleration technique for further applications. This includes optimizing the radical source as well as the operation of the Stark decelerator. Class II optimization seeks to increase the signal-to-noise ratio of the experiment and thus improve the duty cycle.
Optimizing the radical source for Stark deceleration
As Stark decelerators rely on conservative forces, the phase-space volume of the molecule packets cannot be compressed and the decelerator can only preserve the phase-space den-sity of the initial molecular beam. This underlines the necesden-sity to optimize conditions at the source as much as possible to maximize the number density of molecules decelerated to the target velocity. The first step in class I optimization is to optimize the radical source. There are several parameters relating to the initial molecular beam which are relevant for Stark deceleration experiments, primarily its mean velocityv, its velocity spreadv
(expressed as the full-width-at-half-maximum (FWHM) of the velocity distribution), its longitudinal spatial spreadxand its initial radical densitynafter exiting the valve. These parameters are strongly correlated with each other. It is often difficult or even impossi-ble to tune only one parameter without changing one or all of the others. This imposes challenges to experimentalists, and compromises have to be made to maximize the beam density after deceleration.
Table 1Characteristics of the molecular beam of OH radicals generated by discharging H2O in
different carrier gases
Carrier gas Mean velocity Velocity spread Ground state population Density
(m/s) (FWHM) (%) (%) (×1011/cm3)
Ar 670.5±6.3 9.8±0.5 >98 3.0±0.6
Kr 483.5±5.0 13.1±0.6 >98 2.9±0.6
Xe 385.1±4.0 9.2±0.8 >98 0.9±0.2
Velocity of the radical beam
Generally, higher initial beam velocities demand for higher phase angles0when
target-ing a specific final velocity after Stark deceleration [3, 7]. In turn, high phase angles result in a reduced phase-space acceptance of the decelerator leading to reduced number densi-ties at the exit of the decelerator [3]. It is thus advantageous to start with a molecular beam which is as slow as possible. In our experiment, mean velocities were measured by corre-lating different longitudinal valve positions to maxima in the corresponding time-of-flight (TOF) profiles of the OH radicals.
The velocity of a radical beam can be coarse-tuned by using different carrier gases. In a previous study [42], we showed that OH beam velocities around 670 m/s, 485 m/s and 385 m/s can be obtained with Ar, Kr and Xe as carrier gases in our discharge source. Note that the carrier gas also influences the properties and plasma chemistry of the discharge and therefore the density of radicals produced. Ar and Kr beams resulted in similar OH densities, but with Xe the radical density was found to be a factor of 2 to 3 lower (see Table 1). Furthermore, by tuning the delay between striking the discharge relative to open-ing the valve, the velocity of the radical beam can be fine-tuned at the cost of decreasopen-ing the beam density [43] (see also Fig. 5 below).
The velocity of the molecular beam in a Stark deceleration experiment should be chosen according to the specifications of the Stark decelerator. The decelerator in our experi-ment consists of 124 stages composed of pairs of rods of 3 mm diameter separated by 5 mm (center-to-center distance). The distance between two adjacent stages is 5.5 mm. The typical operating voltage applied to the deceleration stages amounts to±10 kV. This configuration provides a maximum deceleration energy of 1.4 cm−1per stage for OH molecules. Given this number, the maximum initial velocity of OH molecules is limited to500 m/s if a target velocity of 35 m/s is to be reached. This restriction excludes the use of Ar as carrier gas in our case.
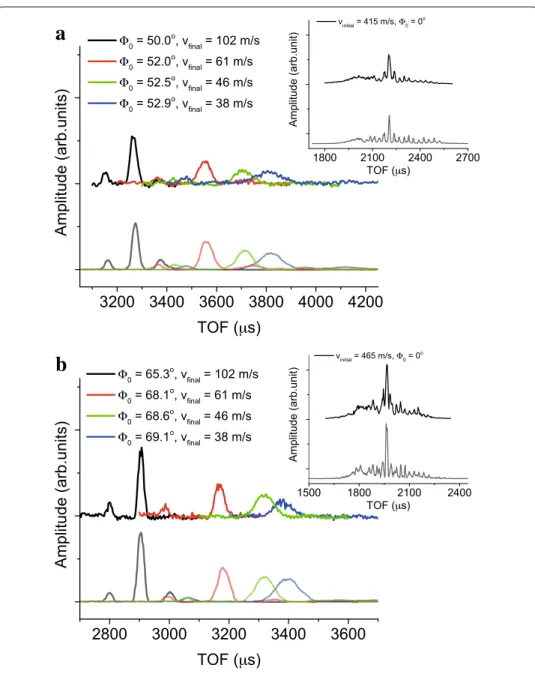
The effect of using different carrier gases on the Stark deceleration process is illustrated with the TOF profiles of OH radicals exiting the decelerator in Fig. 3. The experimental TOF profiles (upper traces) are compared with simulated traces (lower traces) extracted from Monte-Carlo trajectory simulations of the decelerated molecules [44]. The initial mean velocities of the OH beam seeded in Xe (Fig. 3a) and Kr (Fig. 3b) are 415 m/s and 465 m/s, respectively. The relative velocity spreadsv/vhave been determined from the TOF profiles to bev/v=12% for both carrier gases1. The spatial spreads were deduced to be 12.5 mm for Kr and 11.0 mm for Xe by comparing experiments and simulations.
As already discussed in Ref. [42], using Kr as carrier gas yields an initial OH beam den-sity a factor 2 to 3 lager than with Xe. The higher initial denden-sity for OH in Kr compared to Xe can be seen by comparing the TOF profiles obtained in guiding mode (i.e.,0=0°)
a
b
Fig. 3 Time-of-flight (TOF) profiles of OH radicals recorded 11.5 mm downstream from the exit of the Stark decelerator using (a) Xe and (b) Kr as carrier gas. The synchronous velocity was set to the mean velocity of the initial OH beam. The phase angles for deceleration and resulting final velocities of the OH package exiting the Stark decelerator are indicated for each experiment. The dark solid lines (upper traces) are the
experimental results and the light solid lines (lower traces) represent Monte-Carlo trajectory simulations of the experiments. All traces are normalized to the signal obtained in guiding mode (0= 0, insets) using Kr as a carrier gas. The scales of (a) and (b) are identical. The insets of (a) and (b) depict the guiding signal when the Stark decelerator is operated with0= 0. In the simulations, the contributions from bothMJ= −9/4 andMJ= −3/4 low-field-seeking states were taken into account
Velocity spread and spatial spread of the radical beam
a
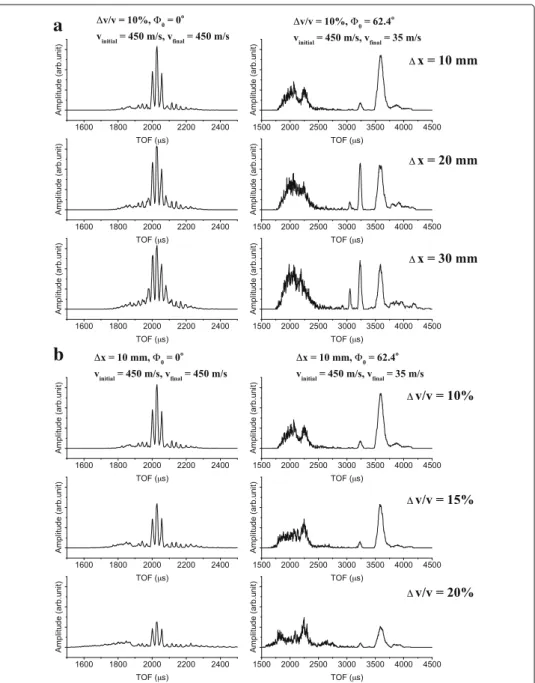
b
Fig. 4 Simulated TOF profiles for (a) different spatial spreadsxand (b) different relative velocity spreads v/vof the initial OH beam. All simulations were performed assuming identical initial OH beam densities. The left column shows the TOF profiles when the Stark decelerator is operated in guiding mode (phase angle 0=0°). The right column depicts the TOF profiles as OH beams are decelerated down to 35 m/s at a phase angle of 62.4°. The initial molecular beam velocity is chosen as 450 m/s which is typical for Kr as carrier gas
are decelerated down to 35 m/s with a phase angle of 62.4°. The initial beam velocity was chosen as 450 m/s which is typical for Kr as carrier gas. All profiles are normalized to the TOF profile in guiding mode with 10% velocity spread and 10 mm spatial spread.
spatial spread increases from 10 mm to 30 mm, the intensity ratio of the main peak and the side peak decreases, and more side peaks appear [24]. This effect can be observed when the simulations are running in both guiding and decelerating mode. A large spatial spread is not necessarily detrimental to the deceleration experiments, depending on the intended application. For example, in spectroscopic measurements and trap loading experiments the side peaks will not cause problems as often one of the peaks can be selected. On the other hand, in collision experiments each of the transported molecule packets may con-tribute to the collision process, which complicates the interpretation of the results. It has to be noticed that at low final velocities, the intensity of the side peaks is not increasing symmetrically when increasing the spatial spread. The peaks pertaining to higher veloc-ities increase in intensity more markedly than those at low velocveloc-ities, because molecules with lower velocities are stopped and reversed in the decelerator.
Conversely, the effect of velocity spread is shown in Fig. 4b. An increasing velocity spread will not only change the ratio between the main peak and the side peaks, but also significantly decreases the total number density of molecules transported through the decelerator. In general, in a deceleration experiment the molecular beam will fly freely over a certain distance before it is coupled into the Stark decelerator. In our experiment, the distance between the valve and the decelerator across two vacuum chambers sepa-rated by a skimmer amounts to a total of 232 mm. After this free flight, the finite velocity spread has effectively enlarged the spatial spread thus diluting the beam before entering the decelerator.
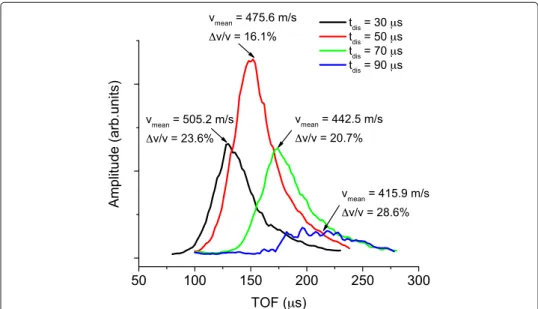
In our experiment, we have observed that the time delaytdisbetween opening the valve
and striking the discharge has a critical effect on the velocity spread as shown in Fig. 5. For low values oftdis, the beam exhibits a higher velocity and larger velocity spread. The
OH beam has a maximum intensity when the discharge pulse is applied around 50μs after the opening of the valve. At these settings, the beam has a minimum velocity spread
of 16.1% and a mean velocity of 475.6 m/s. For higher values oftdis, the beam has a lower
mean velocity, and the inferior expansion conditions result in a lower peak intensity and a larger velocity spread. Similar trends have been observed in previous reports [43, 45].
Optimized operation of the Stark decelerator for low-velocity applications
The optimal operation of a Stark decelerator depends on its application and different schemes have been proposed [34–37, 46]. In a typical Stark deceleration experiment, a high voltage (HV) pulse sequence to be applied to the electrodes is devised according to a chosen “synchronous velocityvs” and the target velocity after deceleration. This
syn-chronous velocityvsis chosen from the velocity distribution of the molecular beam (not
necessarily but often corresponds to the maximum of the beam profile). When a pack-age of molecules with the synchronous velocityvs arrives at the entrance of the Stark
decelerator, the calculated HV pulse sequence is applied. Part of the molecular package within the stable phase-space volume of the decelerator is slowed down to the final veloc-ity. It is critical that the high voltage pulse sequence is applied to the Stark decelerator at the exact time when the molecule package arrives at the Stark decelerator to maximize the incoupling efficiency. The precise determination of the incoupling timetincoupling, i.e.,
the time delay between the generation of the pulsed beam and the coupling into the Stark decelerator, is thus crucial to a successful deceleration experiment.
A detailed protocol to determine the incoupling time has been given by Vogels et al. [24]. In our experiments, we first determine the mean velocity and the velocity spread of the OH beam as described in “Velocity of the radical beam” and “Velocity spread and spatial spread of the radical beam” sections. The incoupling time can be estimated by the relationtincoupling =L/vs, whereL is the distance between the valve and the Stark
decelerator, andvs is a chosen synchronous velocity which, in this case, is identical to
the mean velocity of the molecular beam. Subsequently, we operate the Stark decelerator in guiding mode, i.e., with phase angle0= 0°. The incoupling time is fine-tuned until
a symmetric TOF profile as shown in Fig. 3 is achieved.tincoupling can further be tuned
by optimizing the slow-molecule yield at running the Stark decelerator at higher phase angle, i.e., low final velocity. In our experiment, we chose a final velocity at around 35 m/s to determinetincoupling. The TOF profile in guiding mode and the TOF profile at low final
velocity are then compared with simulations. Once the experimental TOF profiles are well reproduced by the simulations,tincouplingis fixed.
In our case, the distanceLdetbetween the exit of the Stark decelerator and the detection
point amounts to 11.5 mm. An uncertaintyLdetinLdetof 1 mm will give an uncertainty
of 2μs in the TOF for a velocity of 470 m/s and 28μs for a velocity of 35 m/s, respectively. The measurement uncertainty forLdet is less than 1 mm. Thus, as a rule of thumb, we assume that the discrepancy between experimental and simulated TOF traces should be smaller than 2μs for the guiding profile and 20μs for low final velocity profile.
Oncetincouplingis set, the density of decelerated molecules can further be optimized by
selecting different synchronous velocitiesvsfrom the velocity distribution of the
molec-ular beam. In general,vsdoes not have to be the same as the mean velocityvmeanof the
beam. Under the premise of keeping the final velocity fixed, choosing a lower synchronous velocityvsallows to operate the decelerator at lower phase angles. This results in a larger
If, however,vsdeviates too much fromvmean, then the density of the molecule package
coupled into the Stark decelerator will decrease substantially from the maximum value as sparser sections of the gas pulse are sampled. This suggests that there is an optimal value ofvsfor an optimal operation of the experiment.
To illustrate this point, we selected various initial velocities within the velocity profile as synchronous velocitiesvsand decelerated the molecules down to 35 m/s. In this
exper-iment, the OH molecules were seeded in Kr yielding a beam of mean velocityvmean =
470 m/s and a velocity spread (FWHM) of about 20%.
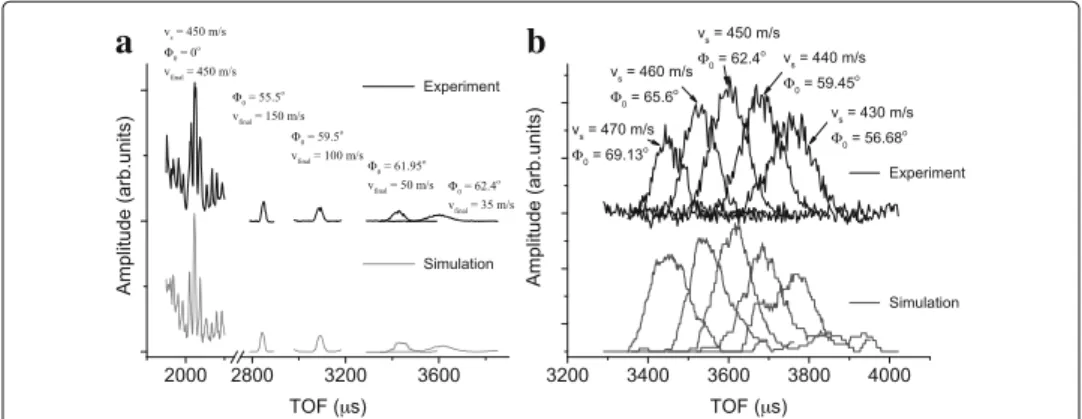
In Fig. 6a, we show the TOF profiles obtained for OH beams decelerated down to vari-ous final velocities with the initial velocity chosen as 450 m/s. The phase angles0used
to operate the Stark decelerator are indicated together with the final velocities. The effect of choosing a synchronous velocityvsdiffering from the mean velocityvmean= 470 m/s
can be seen by inspecting the TOF profile in guiding mode (0=0) which can be
com-pared with Fig. 3b in whichvs = vmean. In the latter case, the TOF profile exhibits a
symmetric structure, which is not the case forvs<vmeanas in Fig. 6a. Here, the wing of
faster molecules to the left of the main peak is more pronounced than the wing of slower molecules to its right. The simulations reproduce these experimental results.
Figure 6b shows the combined effect of the initial package density and phase angle on the density of decelerated molecules by choosing differentvsvalues. In the experiment,
we decelerate OH molecules down to the same final velocity (35 m/s) from different initial velocity components of the beam. Asvs decreases relative tovmean, the density of the
decelerated OH beam increases due to the larger phase-space acceptance provided by the lower initial velocity. The density of the decelerated radicals reaches a maximum atvs=
450 m/s. A further decrease ofvsalso decreases the density of decelerated OH molecules
as the gain achieved by using smaller phase angles is not able to compensate the loss in initial beam density. The simulations (lower traces in Fig. 6b) nicely reproduce the trends we observe in the experiments. Thus, by optimizing the synchronous velocityvs,
the density of decelerated OH radicals could be increased by a factor of 2 consistent with previous observations [34].
a
b
Finally, the voltage applied to the Stark decelerator is another parameter which can be tuned to optimize the operation of a Stark decelerator. A typical voltage applied on our Stark decelerator is±10 kV. Keeping the operation phase angle, higher applied voltage will result in larger phase-space acceptance which increases the number of decelerated molecules. This is true for high final velocities. But for low-velocity applications, espe-cially when the final velocity after deceleration is below 50 m/s, molecules with lower velocities will be stopped and reflected in the Stark decelerator [36], which causes loss. This is also observed in our experiment. On that note, we always operate our Stark decelerator at±10 kV.
Optimizing the detection efficiency
For sensitive LIF detection, reducing stray light and increasing the collection efficiency of the fluorescence are essential. In our experiment, molecules are pumped to the first electronically excited state by using transitions in the A2+(v = 1) ←X2(v = 0) band around 282 nm, while fluorescence is collected onX2(v= 1)←A2+(v = 1) transitions around 313 nm. The emitted off-resonant fluorescence occurs at longer wave-lengths and can thus be separated from the excitation wavelength by bandpass optical filters. However, besides stray light at the excitation wavelength also spurious fluores-cence originating from the Brewster windows, light baffles or other components in the setup can occur at a similar wavelength as the LIF due to inelastic photon scattering. Therefore, it is advisable to create a transmission window as narrow as possible around the wavelength at which the targeted LIF occurs. To that end, two narrow band pass fil-ters (XHQA313, Asahi Filter and FF01-315/15-25, Semrock) are used in our experiment. At 313 nm, this filter combination provides a transmission of up to 50% centered in a transmission window of 10 nm.
Conclusions
In this tutorial paper, we have discussed the optimization of relevant experimental param-eters in order to maximize the beam density of Stark-decelerated radicals for low-velocity applications. Crucial parameters are the carrier gas, the discharge conditions in the rad-ical source, the velocity, velocity spread and spatial spread of the initial molecular beam, the synchronous velocity chosen for coupling the beam into the decelerator and the voltages applied to the Stark decelerator.
Differences between using Kr and Xe as carrier gases in which OH radicals are seeded have been compared. Higher OH densities are initially achieved using Kr, but the Stark decelerator has to be operated at a higher phase angle and therefore lower stable phase-space volume in comparison to Xe. Thus, the radical densities achieved after deceleration proved similar.
The effect of velocity spread and spatial spread of the beam on the final number densities have been discussed. An optimized operation scheme has been found by fixing the discharge delay to the maximum density of the beam profile, thereby minimizing the velocity spread.
synchronous velocity (and thus increasing the phase-space acceptance of the decelerator) and the loss of beam density by deviating too far from the mean velocity of the beam.
By a careful optimization of the parameters discussed, we were able to achieve OH densitiesn = (2.3±1.2)×109cm−3 at a velocity ofv = 28 m/s, as determined by a calibrated LIF measurement.
In the present paper, we focused on the generation of radicals with final velocities around 30 m/s suitable for trap loading. For even lower target velocities, it has been proven to be advantageous to couple a conventional Stark decelerator (as employed here) with a ring Stark decelerator [47] which yields an improved deceleration performance for very slow molecules. Such a scheme has been demonstrated in Ref. [12].
Endnote
1We note that these values slightly deviate from the results given in Table 1. The
char-acteristics of the beam slowly vary over time as wear parts such as the spring of the valve and the discharge electrodes age. The experiment thus has to be periodically re-optimized to adapt to changing beam characteristics.
Acknowledgements
We acknowledge financial support from the Swiss National Science Foundation, grant nr. 200021_156182 and the University of Basel. We thank Claudio von Planta for his contribution in the experiment and in the discussions of the content of the manuscript. We thank D. Wild, Ph. Knöpfel, G. Martin, and N. Janssen for technical support. We also thank Professor S.Y.T. van de Meerakker (Radboud University) for helpful discussions.
Authors’ contributions
DH, SBS and DZ performed the experiments and the simulations and analyzed the data. SW supervised the project. DDZ, DH and SW wrote the manuscript. All authors took part in discussions on the analyses of the data and the content of the manuscript. All authors read and approved the final manuscript.
Competing interests
The authors declare that they have no competing interests.
Publisher’s Note
Springer Nature remains neutral with regard to jurisdictional claims in published maps and institutional affiliations.
Received: 7 July 2017 Accepted: 13 September 2017
References
1. Carr LD, DeMille D, Krems RV, Ye J (2009) Cold and ultracold molecules: science; technology and applications. New J Phys 11:055049
2. Hogan SD, Motsch M, Merkt F (2011) Deceleration of supersonic beams using inhomogeneous electric and magnetic fields. Phys Chem Chem Phys 13:18705
3. van de Meerakker SYT, Bethlem HL, Vanhaecke N, Meijer G (2012) Manipulation and control of molecular beams. Chem Rev 112:4828
4. Jankunas J, Osterwalder A (2015) Cold and controlled molecular beams: Production and applications. Annu Rev Phys Chem 66:241
5. Wall TE (2016) Preparation of cold molecules for high-precision measurements. J Phys B At Mol Opt Phys 49(24):243001
6. Bethlem HL, Berden G, Meijer G (1999) Decelerating neutral dipolar molecules. Phys Rev Lett 83:1558
7. Bethlem HL, Meijer G (2003) Production and application of translationally cold molecules. Int Rev Phys Chem 22:73 8. van de Meerakker SYT, Bethlem HL, Meijer G (2008) Taming molecular beams. Nat Phys 4:595
9. van Veldhoven J, Küpper J, Bethlem HL, Sartakov B, van Roij AJA, Meijer G (2004) Decelerated molecular beams for high-resolution spectroscopy. Eur Phys J D 31(2):337–49
10. Hudson ER, Lewandowski HJ, Sawyer BC, Ye J (2006) Cold molecule spectroscopy for constraining the evolution of the fine structure constant. Phys Rev Lett 96:143004
11. Lev BL, Meyer ER, Hudson ER, Sawyer BC, Bohn JL, Ye J (2006) OH hyperfine ground state: From precision measurement to molecular qubits. Phys Rev A 74:061402
12. Cheng C, van der Poel APP, Jansen P, Quintero-Pérez M, Wall TE, Ubachs W, Bethlem HL (2016) Molecular fountain. Phys Rev Lett 117:253201
13. Gilijamse JJ, Hoekstra S, van de Meerakker SYT, Groenenboom GC, Meijer G (2006) Near-threshold inelastic collisions using molecular beams with a tunable velocity. Science 313:1617
15. Scharfenberg L, Kłos J, Dagdigian PJ, Alexander MH, Meijer G, van de Meerakker SYT (2010) State-to-state inelastic scattering of stark-decelerated OH radiacals with Ar atoms. Phys Chem Chem Phys 12:10660
16. Kirste M, Scharfenberg L, Kłos J, Lique F, Alexander MH, Meijer G, van de Meerakker SYT (2010) Low-energy inelastic collisions of OH radicals with He and D2. Phys Rev A 82:042717
17. Gilijamse JJ, Hoekstra S, Vanhaecke N, van de Meerakker SYT, Meijer G (2010) Loading stark-decelerated molecules into electrostatic quadrupole traps. Eur Phys J D 57(1):33–41
18. Kirste M, Wang X, Schewe HC, Meijer G, Liu K, van der Avoird A, Janssen LMC, Gubbels KB, Groenenboom GC, van de Meerakker SYT (2012) Quantum-state resolved bimolecular collisions of velocity-controlled OH with NO radicals. Science 338:1060
19. von Zastrow A, Onvlee J, Vogels SN, Groenenboom GC, van der AvoirdAd, van de MeerakkerSebastiaan YT (2014) State-resolved diffraction oscillations imaged for inelastic collisions of NO radicals with He, Ne and Ar. Nat Chem 6(3):216–21
20. Vogels SN, Onvlee J, von Zastrow A, Groenenboom GC, van der Avoird A, van de Meerakker SYT (2014)
High-resolution imaging of velocity-controlled molecular collisions using counterpropagating beams. Phys Rev Lett 113:263202
21. Stuhl BK, Hummon MT, Ye J (2014) Cold state-selected molecular collisions and reactions. Annu Rev Phys Chem 65:501
22. Onvlee J, Vogels SN, van der Avoird A, Groenenboom GC, van de Meerakker SYT (2015) Resolving rainbows with superimposed diffraction oscillations in NO + rare gas scattering: experiment and theory. New J Phys 17(5):055019 23. von Zastrow A, Onvlee J, Parker DH, van de Meerakker SYT (2015) Analysis of velocity-mapped ion images from
high-resolution crossed-beam scattering experiments: a tutorial review. Eur Phys J Tech Instr 2(1):11
24. Vogels SN, Gao Z, van de Meerakker SYT (2015) Optimal beam sources for stark decelerators in collision experiments: a tutorial review. Eur Phys J Tech Instr 2(1):12
25. Vogels SN, Onvlee J, Chefdeville S, van der Avoird A, Groenenboom GC, van de Meerakker SYT (2015) Imaging resonances in low-energy NO-He inelastic collisions. Science 350(6262):787–790
26. Onvlee J, Gordon SDS, Vogels SN, Auth T, Karman T, Nichols B, van der Avoird A, Groenenboom GC, Brouard M, van de Meerakker SYT (2016) Imaging quantum stereodynamics through fraunhofer scattering of NO radicals with rare-gas atoms. Nat Chem 9(2017):226–233
27. van de Meerakker SYT, Smeets PHM, Vanhaecke N, Jongma RT, Meijer G (2005) Deceleration and electrostatic trapping of OH radicals. Phys Rev Lett 94:023004
28. van de Meerakker SYT, Vanhaecke N, van der Loo MPJ, Groenenboom GC, Meijer G (2005) Radiative lifetime of trapped OH. Phys Rev Lett 95:013003
29. Sawyer BC, Lev BL, Hudson ER, Stuhl BK, Lara M, Bohn JL, Ye J (2007) Magnetoelectrostatic trapping of ground state OH molecules. Phys Rev Lett 98:253002
30. Hoekstra S, Metsälä M, Zieger PC, Scharfenberg L, Gilijamse JJ, Meijer G, van de Meerakker SYT (2007) Electrostatic trapping of metastable NH molecules. Phys Rev A 76:063408
31. Gilijamse JJ, Hoekstra S, Meek SA, Metsälä M, van de Meerakker SYT, Meijer G, Groenenboom GC (2007) The radiative lifetime of metastable CO (a3, v=0). J Chem Phys 127(22):221102
32. Riedel J, Hoekstra S, Jäger W, Gilijamse JJ, van de Meerakker SYT, Meijer G (2011) Accumulation of stark-decelerated NH molecules in a magnetic trap. Eur Phys J D 65:161–166
33. Stuhl BK, Hummon MT, Yeo M, Quéméner G, Bohn JL, Ye J (2013) Evaporative cooling of the dipolar hydroxyl radical. Nature 492:396
34. Hudson ER, Bochinski JR, Lewandowski HJ, Sawyer BC, Ye J (2004) Efficient stark deceleration of cold polar molecules. Eur Phys J D 31(2):351–358
35. Gilijamse JJ, Küpper J, Hoekstra S, Vanhaecke N, van de Meerakker SYT, Meijer G (2006) Optimizing the
stark-decelerator beamline for the trapping of cold molecules using evolutionary strategies. Phys Rev A 73:063410 36. Sawyer BC, Stuhl BK, Lev BL, Ye J, Hudson ER (2008) Mitigation of loss within a molecular stark decelerator. Eur Phys J
D 48(2):197–209
37. Zhang D, Meijer G, Vanhaecke N (2016) Advanced switching schemes in a stark decelerator. Phys Rev A 93:023408 38. van de Meerakker SYT, Vanhaecke N, Bethlem HL, Meijer G (2006) Transverse stability in a stark decelerator. Phys Rev
A 73:023401
39. Willitsch S, Bell MT, Gingell AD, Procter SR, Softley TP (2008) Cold reactive collisions between laser-cooled ions and velocity-selected neutral molecules. Phys Rev Lett 100:043203
40. Heazlewood B, Softley TP (2015) Low-temperature kinetics and dynamics with Coulomb crystals. Annu Rev Phys Chem 66:475–495
41. Yan B, Claus PFH, van Oorschot BGM, Gerritsen L, Eppink ATJB, van de Meerakker SYT, Parker DH (2013) A new high intensity and short-pulse molecular beam valve. Rev Sci Instrum 84(2):023102
42. Ploenes L, Haas D, Zhang D, van de Meerakker SYT, Willitsch S (2016) Cold and intense OH radical beam sources. Rev Sci Instrum 87(5):053305
43. Lewandowski HJ, Hudson ER, Bochinski JR, Ye J (2004) A pulsed, low-temperature beam of supersonically cooled free radical OH molecules. Chem Phys Lett 395(1–3):53–57
44. Bethlem HL (2002) Deceleration and trapping of polar molecules using time-varying electric fields. PhD thesis. Katholieke Universiteit Nijmegen, The Netherlands
45. van de Meerakker SYT, Labazan I, Hoekstra S, Küpper J, Meijer G (2006) Production and deceleration of a pulsed beam of metastable NH ( a1) radicals. J Phys B At Mol Opt Phys 39(19):1077
46. Scharfenberg L, Haak H, Meijer G, van de Meerakker SYT (2009) Operation of a stark decelerator with optimum acceptance. Phys Rev A 79:023410
![Fig. 1 Cross section through the pinhole-discharge valve Ref. [42]. The nozzle diameter is 0.5 mm](https://thumb-us.123doks.com/thumbv2/123dok_us/7914486.2105992/3.892.179.717.129.334/fig-cross-section-pinhole-discharge-valve-nozzle-diameter.webp)