AUSTRALIAN JOURNAL OF BASIC AND
Open Access Journal
Published BY AENSI Publication
© 2016 AENSI Publisher All rights reserved
This work is licensed under the Creative Commons Attribution http://creativecommons.org/licenses/by/4.0/
To Cite This Article: M.Abisha and Dr.T.Sasilatha Aust. J. Basic & Appl. Sci., 10(1): 323-331, 2016
Abnormality Analysis o
Segmentation
1
M.Abisha and 2Dr.T.Sasilatha
1PG Scholar Department of Electronics and Communication Engineering Sree Sastha
2Professor and Head, Department of Electronics and CommunicationEngineering Sree Sastha Institute of Engineering and Technolog
Address For Correspondence:
M.Abisha, PG Scholar Department of Electronics and E-mail: [email protected]
A R T I C L E I N F O Article history:
Received 10 December 2015 Accepted 28 January 2016 Available online 10 February 2016 Keywords:
Tuberculosis, Chest Radio graphics, Feature, Extraction, Segmentation Technique
TB is increasingly concentrated in subgroups of the po Staal, 2002). Major public health problem in India
accounts for 45% of cases reported in England in India over 220 linked cases have
prisoners and the homeless highlighting stages and ensuring patients complete
Treatment is not given to the patient resistance and relapse. Major barrier
Directly Observed Therapy (DOT) becoming the accepted standard of
When dealing with a human life TB in different medical images is motivated by detection of the necessity of high accuracy
A. Digital image processing:
The possible techniques are manipulating data in the form of an process is to minimize image and pixel values p
brightness value of the image at a particular location
512x512 or roughly 250,000 pixels although much larger images are becoming common M. Liu, 2010). There are three basic operations that can be performed on it in the computer o been digitized. A pixel value for a point operation
input image (Gao, M., M. Liu, 2010
clearly evident, and enhancement include making the image more visually appealing.
AUSTRALIAN JOURNAL OF BASIC AND
APPLIED SCIENCES
ISSN:1991-8178 EISSN: 2309-8414 Journal home page: www.ajbasweb.com
© 2016 AENSI Publisher All rights reserved
This work is licensed under the Creative Commons Attribution International License (CC BY). http://creativecommons.org/licenses/by/4.0/
M.Abisha and Dr.T.Sasilatha, Abnormality Analysis of Lungs Using External Parameters of Gross Segmentation , 2016
Abnormality Analysis of Lungs Using External Parameters o
PG Scholar Department of Electronics and Communication Engineering Sree Sastha Institute of Engineering and Technology Professor and Head, Department of Electronics and CommunicationEngineering Sree Sastha Institute of Engineering and Technolog
M.Abisha, PG Scholar Department of Electronics and Communication Engineering Sree Sastha Institute of Engineering and Technology
A B S T R A C T
The world major global health threat is Tuberculosis (TB). Cough, getting fever, losing weight, night sweats are the symptoms of TB. TB remains one of the world’s major health concerns. The estimation of TB 8.7 million and 1.4 million. Majority of the TB burden is located in Africa, Asian countries. Software techniques have triggered attempts to develop Computer Aided Detection (CAD) systems for TB.
graphics Image (MRI) is taken as an input image and extract the desired part using Active Shape Model (ASM). Gaussian noise is removed using non local median filter. Lung parameters like shape and texture are extracted using Gray Level Co
Matrix (GLCM). Extracted image parameters are compared with normal person parameter value. Watershed algorithm and threshold algorithm is applied for abnormal lungs.
INTRODUCTION
TB is increasingly concentrated in subgroups of the population (Ban Ginneken B., and A.F. Frangi, J.J. ajor public health problem in India is TB. Between 2009 and 2012 11% cases
cases reported in England (Bogeweg, L. and M. Proko, 2008). The majority people has TB linked cases have disproportionately involved problem. Among these groups
prisoners and the homeless highlighting weak control. Tuberculosis treatment is based on
and ensuring patients complete or 6 months of regular treatment (Bogeweg, L. and M. Proko, 2008 patient can lead to increased disease transmission, the development of drug ajor barrier is a poor adherence to successful treatment. Many countries this has led to Directly Observed Therapy (DOT) becoming the accepted standard of care for TB (Cerlman, P.C.,
TB in different medical images is motivated by automated classification and the necessity of high accuracy
anipulating data in the form of an image (De Boo, M.,
and pixel values picture element, or pixel is known as each number representing e at a particular location (De Boo, M., et al., 2010). Digitized image may have pixels although much larger images are becoming common (
There are three basic operations that can be performed on it in the computer o
for a point operation in the output image depends on a single pixel value in the Gao, M., M. Liu, 2010). Image is enhanced and modified so that the information it
include making the image more visually appealing. N
Abnormality Analysis of Lungs Using External Parameters of Gross Segmentation.
Parameters of Gross
Institute of Engineering and Technology Professor and Head, Department of Electronics and CommunicationEngineering Sree Sastha Institute of Engineering and Technology
Communication Engineering Sree Sastha Institute of Engineering and Technology
The world major global health threat is Tuberculosis (TB). Cough, getting fever, losing weight, night sweats are the symptoms of TB. TB remains one of the world’s major health concerns. The estimation of TB 8.7 million and 1.4 million. Majority of the TB urden is located in Africa, Asian countries. Software techniques have triggered attempts to develop Computer Aided Detection (CAD) systems for TB. Medical Radio MRI) is taken as an input image and extract the desired part using Model (ASM). Gaussian noise is removed using non local median filter. Lung parameters like shape and texture are extracted using Gray Level Co-occurrence Matrix (GLCM). Extracted image parameters are compared with normal person algorithm and threshold algorithm is applied for abnormal
Ban Ginneken B., and A.F. Frangi, J.J. is TB. Between 2009 and 2012 11% cases reported and now . The majority people has TB Among these groups Drug users, culosis treatment is based on detection in early
Bogeweg, L. and M. Proko, 2008). transmission, the development of drug
any countries this has led to Cerlman, P.C., et al., 2009). utomated classification and
example (Gao, M., M. Liu, 2010). Median filtering can be used to smooth a noisy image, applied with a 3x3 pixel window. The value of every pixel in the noisy image is recorded, along with the values of its nearest eight neighbour’s values (Gao, M., M. Liu, 2010). New image in the pixel these nine numbers are then ordered according to size and the median is selected as the value. To smooth a noisy image, one to smooth a noisy image, pixel at a time across the noisy image, the filtered image is formed
B. Medical image:
Medical imaging is mainly used in invention analysis and tumor issue technique (Joppini, G., et al., 2011). Internal structures hidden medical imaging seeks to reveal the skin and bones as well as to diagnose and treat disease. Medical imaging is mainly used in medical imaging and other technique (Joppini, G., et al., 2011). Nuclear Magnetic Resonance (NMR) imaging is mainly used detect the stages of TB and using the tissues and other producing a detectable signal and encoded resulting in images of the human body (Joppini, G., et al., 2011).
The MRI machine emits resonant frequency of the hydrogen atoms on water molecules Radio Frequency (RF) pulse. Medical imaging and pixel value is often perceived to designate the set of techniques that noninvasively produce images of the internal aspect of the body (Joppini, G., et al., 2011; Loodring, et al., 2012). Medical imaging can be seen as the solution of mathematical inverse problems. This causes the properties of living tissue is inferred from effect the observed signal (Loodring, et al., 2012). Segmentation technique is based on the features extraction parameter values and normal abnormal values. Implementation of image acquisitionra diography is used in the medical imaging research area such as biomedical engineering computer science and medical physics. TB disease and can also be investigated other medical imaging diagnosis (Loodring, et al., 2012). The subject of CXR screening and radiographic the objective of the present to check the sensitivity and specificity of symptom and to detect. This means that cause the properties of living tissue and inferred from effect the observed signal.
C. Block diagram of proposed system:
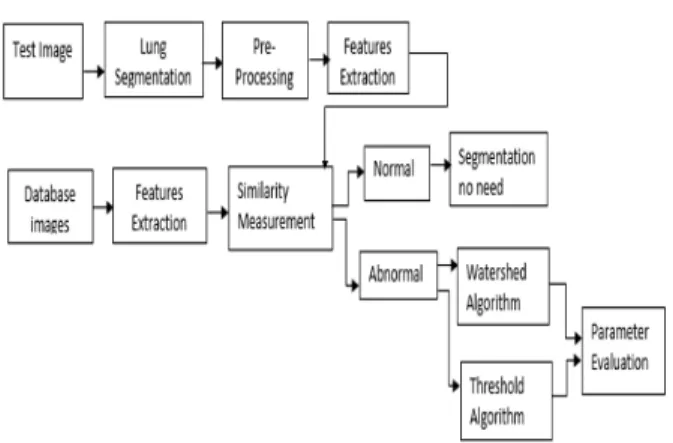
The proposed block diagram consists of lung segmentation, feature extraction, pre-processing, similarity measurements, watershed algorithm and threshold algorithm. The proposed block diagram shown in Fig. 1
Fig. 1: Block diagram of the proposed system
Test images are taken as an input image. Lung part is segmented using active shape model ASM method. Pre-processing done in the desired part of the lung image using non local median filter. Lung features are contrast, correlation, energy, homogeneity, entropy extracted using GLCM gray level co-occurrence matrix. Normal person image is taken and extract the features alone. Bot the features parameter values are compared in the similarity measurements. If the lung image is normal, segmentation is not required and the lung is abnormal, segmentation technique is applied. Watershed algorithm and threshold algorithm are applied to abnormal lung images to get accuracy TB affected area.
II. Lung Segmentation:
all training masks are linearly aligned to a given input CXR then the vertical and horizontal intensity projections of the histogram equalized images are computed Segmentation method with active contour model based on features extraction of shape and CT value is developed and it shows satisfactory results. lung is shown in Fig 2
Fig. 2: Segmentation Lung
A. Region of Interest:
Region of Interest (RoI) is a selected subset of samples within dataset identified for other needs particular purpose. The concept of a RoI is commonly used in many application areas and medical applications (Leung, A., et al., 1992). In medical imaging the boundaries of a TB may be defined on an image or in a volume for the purpose of measuring texture and shape. In Geographical Information Systems (GIS) RoI can be taken literally and polygonal selection from a 2-Dimensional (2D) map other values. In optical character recognition and computer vision the RoI defines the borders and edges of object under consideration (Leung, A., et al., 1992). In many applications, symbolic textual labels are to describe its content in a compact manner added to a RoI (Leung, A., et al., 1992).
B. Active Shape Model:
ASM is the most popular segmentation method among the other segmentation methods used in internal parameters and parameter values (Perlman, D.C., et al., 1997). The ASM segmentation method is introduced by Cooteseal emphasized the free parameters (Perlman, D.C., et al., 1997). The ASM scheme includes three elements model for the global shape,search algorithm for multi-resolution, model for the local multi-resolution appearance (Perlman, D.C., et al., 1997; Woodring, J., et al., 1986). AAM has applied in the medial image segmentation and other methods. Contour models describe the boundaries of shapes in an image pixel values. To solve problems snakes in particular are designed where the approximate shape of the boundary is known (Woodring, J., et al., 1986).
III. Features Extraction:
Feature extraction provides certain parameters and basis of which computer system takes decision other tasks (de Boo, D.W., et al., 2009). After the segmentation is performed on lung region, the features can be obtained from it and the diagnosis rule designed the lungs (de Boo, D.W., et al., 2009). Feature which are calculated from the image, convey some information regarding lung nodule. This information is very helpful in detecting lung nodule as normal stages malignant or non-malignant (de Boo, D.W., et al., 2009; Ishida, T., et al., 1997). The features extracted from the X-ray image can be used as starts from an initial set of measured data and builds derived values diagnostic indicators image processing feature extraction features intended to be informative, non redundant facilitating the subsequent learning and generalization stages in some cases leading to better human interpretations (Ishida, T., et al., 1997). Feature extraction is related to dimensionality reduction other solving problems. The input data to an algorithm is an large to be processed and it is suspected to an image redundant (Ishida, T., et al., 1997). The same measurement in both feet and meters, or the repetitiveness of images presented as pixels values then transformed into a reduced set of features also named a features vector. This process is called feature extraction and textures (van Ginneken, B., et al., 2002). The extracted features are expected to contain the relevant information from the input data and desired task can be performed by using this representation reduction instead of the complete initial data (van Ginneken, B., et al., 2002). To imitate radiologist which make visual examination on textural feature and shape of thoracic X-ray images to make diagnosis exploited textural features calculated by computer to be used as descriptor classifying images normal or abnormal (van Ginneken, B., et al., 2002). Statistical feature of imagehistograms is used by calculating some features includes shape, mean correlation, energy mean, entropy, homogeneity.
• Contrast
• Correlation
• Energy
• Homogeneity
• Entropy
properties of living tissue is inferred from effect the observed signal. This means that cause the properties of living tissues.
A. Contrast:
Contrast is based on the matrix value and brightness of the image. It returns a measure of the intensity contrast between a pixel and its neighbour pixel value of an image (van Ginneken, B., et al., 2009). Contrast is 0 for a pixel image. Formula for contrast is given below no of columns and no of rows denoted.
ij k j k i
p
j
i
∑
∑
= =−
1 2 1)
(
(1)Where x coordinate is ‘i’ is and’ j’ is y coordinate of the pixel. Pixel value at that location (i, j).
B. Correlation:
Correlation measures the pixel values and pixel pair value and other contrast technique. Correlation measurement is based on pixel value and threshold value of image (van Ginneken, B., et al., 2009). Range is starts from 1 to -1. High correlation values close to 1 imply and 0 linear relationship between the gray levels matrix pixels pairs. GLCM correlation is uncorrelated with gray Level Co-occurrence Matrix (GLCM) energy to pixel pair repetitions and coefficient matrix. Correlation reaches it maximum value regardless of pixel pair occurrence, as high correlation can be measured either in low or high in Correlation is starts from 1 or -1 for a perfectly positively or negatively correlated image. Correlation is null for a constant imageas well other images. (van Ginneken, B., et al., 2009).
(
)
∑ ∑
= =−
−
k i kj r c c r
j
m
pij
m
i
1 1)
(
σ
σ
(2)C. Energy:
Energy provides the sum of squared elements in the GLCM. Energy is mainly depends on random number uniformity and the angular second moment. Returns the sum of squared elements in the GLCM is complex (van Ginneken, B., et al., 2009). Its range is from 0 to 1. Energy is 1 for a constant image and 0 for other images (van Ginneken, B., et al., 2009). This cause the properties of living tissue is inferred from effect the observed signal and other pixel images.
∑
∑
= = k j ij k ip
1 2 1 (3)D. Homogeneity:
It returns the value that measures the closeness of the distribution and elements in the GLCM to the GLCM diagonal pixel values. The ranges are starts from 0 to 1. Homogeneity is 1 for a diagonal GLCM matrix (van Ginneken, B., et al., 2009). It is a single measure of the attribute of a sample (van Ginneken, B., et al., 2009).
∑
∑
= =+
−
k j ij ki
i
j
p
1
1
1
(4)
It is calculated by applying a function statistical algorithm and other pixel values of the items of the sample and known together as a set of data M values.
E. Entropy:
Measures the randomness of a gray-level distribution is entropy. If the gray levels are the entropy is expected to be distributed randomly throughout the image (van Ginneken, B., et al., 2009).
ij k j ij k i
p
p
2 1 1log
∑
∑
= =−
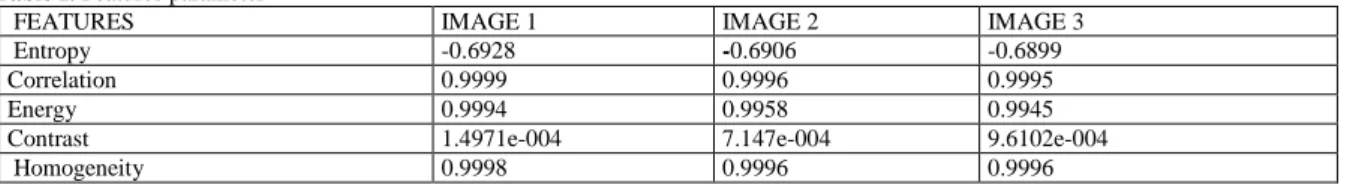
(5)Table I: Features parameter
FEATURES IMAGE 1 IMAGE 2 IMAGE 3
Entropy -0.6928 -0.6906 -0.6899
Correlation 0.9999 0.9996 0.9995
Energy 0.9994 0.9958 0.9945
Contrast 1.4971e-004 7.147e-004 9.6102e-004
value representation instead of the complete initial data. Texture related features like average gray level, standard deviation, smoothness, third moment uniformity and entropy are estimated using GLCM (van Ginneken, B., et al., 2002). This parameter is also called ASM. Energy measures textual uniformity pixel pairs repetitions, when the image patch under consideration is homogenous or texturally uniform, a few elements of GLCM will be greater than 0 and close to 1 while many elements will be close to 0 (van Ginneken, B., et al., 2002). In this case energy reaches values to its maximum, equal to 1.Entropy values and other are calculated using gray level matrix. This result means that energy is strongly uncorrelated to first order statistical variables such as contrast and variance (van Ginneken, B., et al., 2002). Energy will be reaching the high peak values. The parameter of the different image features extraction values given Features parameter values for different images
F. GLCM:
GLCM based texture feature extraction has been considered as the powerful technique and still now has been used in many applications of remote sensing for texture analysis (Arzhaeva, Y., et al., 2007). Gray level matrix has pixel value representation and other features extraction (Arzhaeva, Y., et al., 2007). Gray level matrix based on 14 features extraction contrast, correlation, entropy, energy (Arzhaeva, Y., et al., 2007).
1V. Segmentation Technique:
Segmentation technique has been used for the abnormal lungs (Kao, E.-F., et al., 2011). The water is falls into an image for gradient representation. Watershed is based on water drop into the basin and spreader (Kao, E.-F., et al., 2011). Different technical are there definitions of a watershed. Watershed algorithm is based on the threshold values (Kao, E.-F., et al., 2011; Coppini, G., et al., 2013). This algorithm is based on the continuous domain. Different algorithms are used in watershed method to segment the image and medical applications
A. Watershed Method:
Three methods are there to implement watershed algorithm. Gradient method marker controlled approach discrete Transform (DT) approach. DT approach a tool used commonly in conjunction with the watershed transform for segmentation is the distance transforms (Coppini, G., et al., 2013). It is the distance from every pixel to the nearest nonzero-valued pixel. Local minima of the gradient of the image may be chosen as markers, in this case an over-segmentation is produced and a second step involves region merging. When watershed algorithm is applied to the input image affected area is shown in the different colour and percentage is 25% green and blue 50% red and 75% is sky blue. Binary image can be converted to a gray level image and other images, which is suitable for watershed segmentation using different discrete transform (Coppini, G., et al., 2013). DT functions produce different effects. Salt and pepper noise is removed over segmentation. Block DT has higher possibility of over segmentation for the components in the image (Coppini, G., et al., 2013). The reason is that city block DT propagates to the neighbourhood in the shape of diamond which is suitable for watershed segmentation and other technique using different DT (Coppini, G., et al., 2013). Different discrete transform is used in different technique. Euclidean DT has a higher possibility of salt and pepper over segmentation. DT has a higher possibility of over segmentation for the components in the image (Coppini, G., et
al., 2013). The main reason to choose the watershed method is it spited into all the parts.
D. Threshold Method:
Thresholding pixels are divided into three parts edges and boundaries in the medical images (Katsuragawa, S. and K. Doi, 2007). Pixels with values less than 128 have been placed in one category, and the rest have been placed in the other category (Katsuragawa, S. and K. Doi, 2007). The original image boundaries between adjacent pixels in different categories has been superimposed in white (Katsuragawa, S. and K. Doi, 2007). Threshold method has successfully segmented image and the two predominant fibres types (Katsuragawa, S. and K. Doi, 2007). The main reason to believe that the background and object occupy comparable areas in the image, a good initial value for Tis the average gray level (Coppini, G., et al., 2013)
RESULTS AND DISCUSSIONS
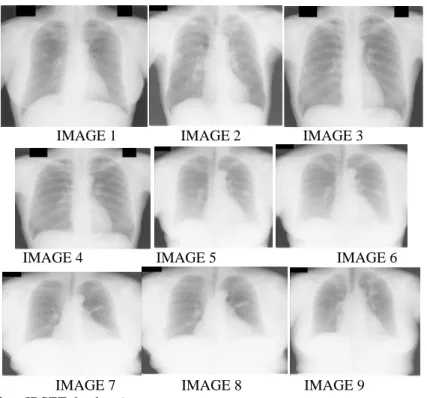
IMAGE 1 IMAGE 2 IMAGE 3
IMAGE 4 IMAGE 5 IMAGE 6
IMAGE 7 IMAGE 8 IMAGE 9
Fig. 3: Input images (after, JRSET database)
GLCM is a histogram of co-occurring grey scale values at a given offset over an image. In this example, samples of two different textures are extracted from an image. grassy areas and sky areas. For each patch,
a GLCM with a horizontal offset of 5 is computed. The number of gray levels in the image determines the size.
Fig. 4: Segmented images
Fig. 5: Lung regional mask
Image edges detected using canny edge detector shown in the fig.6
Fig. 6: Canny Edge Detector
If the Lung is in a normal stage then there is no need for the segmentation the output of the messsage box will be displayed as shown in Fig.7
Fig. 7: Message box shows normal
The parameter value matches with normal person values its normal stage message box shown as in the Fig.8
Fig. 8: Segmentaion no need
Segmentation technique is applied for abnormal images and the result of the threshold segmentation images is shown in the same colour shown as in Fig.9
IMAGE 1 IMAGE 2
Fig. 9: Result of threshold Algorithm
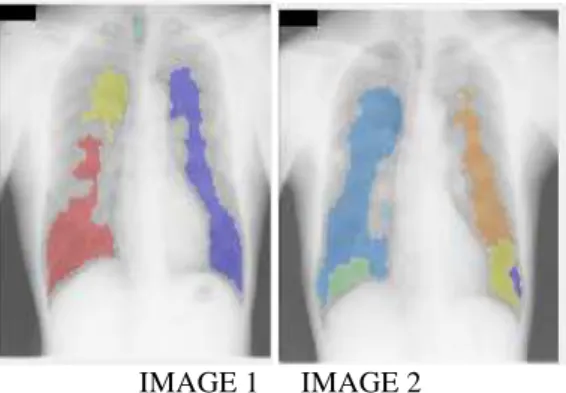
Watershed segmentation is applied for the abnormal images shown as in Fig.10
IMAGE 1 IMAGE 2
Fig. 10: Result of watershed algorithm
Fig. 11: Abnormal lung
Conclusion:
In the existing method has three segmentation processes. In local features computation local characteristics of each pixel in the image were computed. Lung segmentation is required to limit the analysis to the region inside the lung fields. Clavicle method, supervised pixel classifiers were constructed to segment the interior, the head and the border of the clavicle. Drawback of these method is difficult to get accurate result and it is not optimal for all kind of images. It also limits details about various directional edge pattern.
In the proposed method TB has been analysed using parameter values of normal and abnormal person. Watershed and threshold algorithm are used for segmenting abnormal lungs. Comparing both the algorithm the watershed algorithm has better accuracy and the TB affected area is shown in different colour. In future neural classifier has been used for the classification of TB.SVM will be used to classify the stage of TB in lung that is benign, malignant or normal.
REFERENCES
Arzhaeva, Y., M. Prokop, D.M.J. Tax, P.A. de Jong, C.M. Schaefer-Prokop and B. van Ginneken, 2007. “Computer-aided detection of interstitial abnormalities in chest radiographs using a reference standard based on computedtomography,” Medical Physics, 34: 4798-4809.
Ban Ginneken B., and A.F. Frangi, J.J. Staal, 2002. ‘Active shape mode segmentation with optimal features’, IEEE Transactions on Medical Imaging, 21.
Bogeweg, L. and M. Proko, 2008. ‘Computer-aided diagnosis in chest radiography: beyond nodules’, European Journalof Radiology, 72.
Cerlman, P.C., V. Sadr, J.P. Nelson, E.E. Matts Telzak, K.C. Salomon, 2009. ‘Variation of chestradiographic patterns in pulmonary tuberculosis by degree of humanimmunodeficiency virus-related immunosuppression’.
Coppini, G., M. Miniati, S. Monti, M. Paterni, R. Favilla and E.M. Ferdeghini, 2013. “A computer-aided diagnosis approach for emphysema recognition in chest radiography,” Medical Engineering and Physics, 35: 63-73.
de Boo, D.W., M. Prokop, M. Uffmann, B. van Ginneken and C.M. Schaefer-Prokop, 2009. “Computer-aided detection (CAD) of lung nodules and small tumours on chest radiographs,” European Journal of Radiology, 72: 218-225.
De Boo, M., N. Prokop, M. Uffmann, 2010. ‘Computer-aided detection (CAD) of lungnodules and small tumours on chest radiographs’, European Journalof Radiology, pp: 72.
Gao, M., M. Liu, 2010. ‘Zone-based analysis for automated detection of abnormalities inchest radiographs’, Medical Physics, 38.
Ishida, T., S. Katsuragawa, T. Kobeyashi, H. MacMahon and K. Doi, 1997. “Computerized analysis of interstitial disease in chest radiographs: improvement of geometric-pattern feature analysis,” Medical Physics, 24: 915-924.
Joppini, G., K. Miniati, L. Monti, O. Paterni UFavilla, 2011. ‘A computer-aided diagnosis approach for emphysemarecognition in chest radiography’, Medical Engineering.
Kao, E.-F., Y.-T. Kuo, J.-S. Hsu, M.-C. Chou and G.-C. Liu, 2011. “Zone-based analysis for automated detection of abnormalities in chest radiographs,” Medical Physics, 38: 4241-4251.
Katsuragawa, S. and K. Doi, 2007.“Computer-aided diagnosis in chest radiography,” Computerized Medical Imaging and Graphics, 31: 212-23.
Leung, A., N. M¨uller, P. Pineda and J. FitzGerald, 1992. “Primary tuberculosis in childhood: radiographic manifestations,” Radiology, 182: 87-91.
Loodring, Vandiviere, A. Fried, C. Dillon, N. Williams, H. Merlin, 2012. ‘Update the radiographic features of pulmonarytuberculosis’, American Journal of Roentgenology, 146.
deficiency virus-related immunosuppression. the Terry Beirn Community Programs for Clinical Research on AIDS (CPCRA). the AIDS Clinical Trials Group (ACTG),” Clinical Infectious Diseases, 25: 242-246.
Qaeger, A., S. Karargyris, J. Candemir, L. Siegelman, 2013. ‘Automatic screening for tuberculosis inchest radiographs: a survey’, Quantitative Imaging in Medicine andSurgery, 3.
van Ginneken, B., A.F. Frangi, J.J. Staal, B.M. terHaarRomeny and M.A. Viergever, 2002. “Active shape model segmentation with optimal features,” IEEE Transactions on Medical Imaging, 21: 924-933.
van Ginneken, B., L. Hogeweg and M. Prokop, 2009. “Computer-aided diagnosis in chest radio graphy beyond nodules,” European Journal of Radiology, 72: 226–230.
Watsuragawa, E., Q. Kobeyashi, H. MacMahon, 2014. ‘Computerized analysis of interstitial disease in chest radiographs: improvement of geometric-pattern feature analysis’, Medical Physics, 24.