AUSTRALIAN JOURNAL OF BASIC AND
Open Access Journal
Published BY AENSI Publication
© 2016 AENSI Publisher All rights reserved
This work is licensed under the Creative Commons Attribution International License (CC BY). http://creativecommons.org/licenses/by/4.0/
To Cite This Article: Jemimah C., Lilly Sheeba S., Beulah Jayakumari R. and Vijayakumar A. Patients using Bigdata. Aust. J. Basic & Appl. Sci.,
Classification on Survival Rate
Jemimah C., Lilly Sheeba S., Beulah Jayakumari R
Department of Information Technology, Jerusalem
Address For Correspondence:
Jemimah C., Department of Information Technology, Jerusalem College of Engineering Chennai, India E-mail: [email protected]
A R T I C L E I N F O
Article history:
Received 04 December 2015 Accepted 22 January 2016 Available online 14 February 2016
Keywords:
Ebola; Big Data; Hadoop; Prediction; Sqoop; MapReduce
Big data technology was originally immerged for the cause of storing and retrieving petabytes of data processing was also entertained. It originated is from Data warehousing where the
Microsoft Excel or MS Access were used. While operational data made use of OLTP (Online Transaction Processing), informational data used OLAP (Online Analytic Processing). Various tools such as Hadoop, YARN, Oozie, Hive, Pig, MongoDB, Cassandra, Flume, Spark, Storm, Sqoop were used. Applications of bigdata include enterprises, business intelligence, traffic monitoring, predictive analysis and healthcare. Healthcare is a broader and sensitive area whereby it can be used for sentiment
and treatment to serve as a physician guide. They employ techniques like MapReduce and languages like R to deploy IMDB. Java is used for code and implementation and MYSQL for backend creation querying. A very dominant application of bigdata are search engines without which updation is impossible has bigdata as its base on which large amounts of data are being uploaded and downloaded across the globe via the web.
Ebola is a hemorrhagic fever which contracted mankind in t
bats and macaques were the cause for the wide spread of the epidemic in Africa. Though the disease continued throughout the following years, its major outbreak was recognized in the year 2014. 2014 saw the dea nearly half of the population of the affected areas in Africa. Its common symptoms include fever, vomiting, diarrhea, headache, rashes and conjunctivitis which contract the patients within 2
the virus. The disease also tends to attack the eyes, brain, kidneys, liver and the heart. It increases the density of the blood. The affected people need to be quarantined.
The later stage of the disease leads to internal and external bleeding. This disease spreads through body fluids like urine, sweat, saliva, semen and blood. The death occurs within 2
disease. To control further spread of the virus, the attendees should take precautionary measures like wearing gloves, socks, shoes, aprons and helmets in order to prevent intensive outbreak of the disease. The dead bodies
AUSTRALIAN JOURNAL OF BASIC AND
APPLIED SCIENCES
ISSN:1991-8178 EISSN: 2309-8414 Journal home page: www.ajbasweb.com
© 2016 AENSI Publisher All rights reserved
This work is licensed under the Creative Commons Attribution International License (CC BY). http://creativecommons.org/licenses/by/4.0/
Jemimah C., Lilly Sheeba S., Beulah Jayakumari R. and Vijayakumar A.. Classification on Survival Rate of Ebola
Aust. J. Basic & Appl. Sci., 10(2): 67-74, 2016
n Survival Rate of Ebola Patients using Bigdata
Beulah Jayakumari R. and Vijayakumar A.
Jerusalem College of Engineering Chennai, India
Department of Information Technology, Jerusalem College of Engineering Chennai, India.
A B S T R A C T
Healthcare is a sector where both the doctors and the engineers come together. The recent outbreak of Ebola, a hemorrhagic fever throughout Africa requires a solution since it has consumed half of its population. Big data can store and analyze the patient records. Big data provides a framework where real time data can be employed. Big data tools such as hadoop are efficient to store petabytes of data and it has the Hadoop Distributed File System framework. The input data which is usually in text format requires Sqoop to enter data within hadoop. MapReduce model is used to analyze patient factors where a key/value pair is associated with each of the factors. Later IMDB code is used to provide rating for each of the factor based on which the mapper and reducer adequately work together to establish the possibility of survival of patients. This solution can further be extended to treat the disease and contain the epidemic.
INTRODUCTION
Big data technology was originally immerged for the cause of storing and retrieving petabytes of data processing was also entertained. It originated is from Data warehousing where the basic databases such as Microsoft Excel or MS Access were used. While operational data made use of OLTP (Online Transaction Processing), informational data used OLAP (Online Analytic Processing). Various tools such as Hadoop, DB, Cassandra, Flume, Spark, Storm, Sqoop were used. Applications of bigdata include enterprises, business intelligence, traffic monitoring, predictive analysis and healthcare. Healthcare is a broader and sensitive area whereby it can be used for sentimental analysis, disease identification, and treatment to serve as a physician guide. They employ techniques like MapReduce and languages like R to deploy IMDB. Java is used for code and implementation and MYSQL for backend creation querying. A very pplication of bigdata are search engines without which updation is impossible has bigdata as its base on which large amounts of data are being uploaded and downloaded across the globe via the web.
Ebola is a hemorrhagic fever which contracted mankind in the year 1976. Researchers concluded that fruit bats and macaques were the cause for the wide spread of the epidemic in Africa. Though the disease continued throughout the following years, its major outbreak was recognized in the year 2014. 2014 saw the dea nearly half of the population of the affected areas in Africa. Its common symptoms include fever, vomiting, diarrhea, headache, rashes and conjunctivitis which contract the patients within 2-8 days of being in contact with tends to attack the eyes, brain, kidneys, liver and the heart. It increases the density of the blood. The affected people need to be quarantined.
The later stage of the disease leads to internal and external bleeding. This disease spreads through body uids like urine, sweat, saliva, semen and blood. The death occurs within 2-21 days after being attacked by the disease. To control further spread of the virus, the attendees should take precautionary measures like wearing elmets in order to prevent intensive outbreak of the disease. The dead bodies
Classification on Survival Rate of Ebola
sing Bigdata
Healthcare is a sector where both the doctors and the engineers come together. The hemorrhagic fever throughout Africa requires a solution since it has consumed half of its population. Big data can store and analyze the patient records. Big data provides a framework where real time data can be employed. Big data efficient to store petabytes of data and it has the Hadoop Distributed File System framework. The input data which is usually in text format requires Sqoop to enter data within hadoop. MapReduce model is used to analyze air is associated with each of the factors. Later IMDB code is used to provide rating for each of the factor based on which the mapper and reducer adequately work together to establish the possibility of survival of patients.
xtended to treat the disease and contain the epidemic.
Big data technology was originally immerged for the cause of storing and retrieving petabytes of data basic databases such as Microsoft Excel or MS Access were used. While operational data made use of OLTP (Online Transaction Processing), informational data used OLAP (Online Analytic Processing). Various tools such as Hadoop, DB, Cassandra, Flume, Spark, Storm, Sqoop were used. Applications of bigdata include enterprises, business intelligence, traffic monitoring, predictive analysis and healthcare. al analysis, disease identification, and treatment to serve as a physician guide. They employ techniques like MapReduce and languages like R to deploy IMDB. Java is used for code and implementation and MYSQL for backend creation querying. A very pplication of bigdata are search engines without which updation is impossible has bigdata as its base on which large amounts of data are being uploaded and downloaded across the globe via the web.
he year 1976. Researchers concluded that fruit bats and macaques were the cause for the wide spread of the epidemic in Africa. Though the disease continued throughout the following years, its major outbreak was recognized in the year 2014. 2014 saw the death of nearly half of the population of the affected areas in Africa. Its common symptoms include fever, vomiting, 8 days of being in contact with tends to attack the eyes, brain, kidneys, liver and the heart. It increases the density of
should be buried or cremated promptly. No treatment or vaccine has been still proposed. Research for medicines is on the go but they are all undertaken only on the animals.
The main reason to be infected with Ebola is because of people coming in contact with the body fluids of the infected people. Initial spread was through bush meats from which virus cannot be destroyed even after intensive cooking. Blood tests are used to diagnose the disease as symptoms alone are not sufficient to confirm the disease. Moreover, people come only in the later stages, as in the beginning they think that the symptoms are common and by the time they suspect they would have already spread the disease.
Hence containing the spread of this contagious disease is a vital one in assuring a healthy environment in the epidemic hit area. Detection of the factors leading to the death rate in Ebola can be ascertained using the existing data of the patients. The patient records are very large in number and therefore they need to be handled by an efficient manner whereby they are not only stored but also they need to be processed and retrieved as and when required. Through patient information the mortality of the patient can be detected. Such detections and predictions will be useful to prevent the death of the patient by providing solution to the factors that lead to intensive death. Ratings can be given to each of the factors whereby we can determine the mortality rate. By existing patient records, an analysis was made in order to check the outcome of various factors on the fatality rate. Using Market Basket Analysis (MBA) we can make analysis on the patient with which the fatality rate can be determined.
Related work:
Big data in healthcare is mostly used for storing, analyzing, processing and retrieving patient records for the reference of the physicians during patient consultation. Initially there were only 3V’s namely volume, variety and velocity associated with bigdata. Bigdata employed column oriented, document oriented and graph databases. In (Lin, Chin-Ho, 2014) enormous amount of patient records are used by Lin for diagnosing the disease at an early stage and providing suitable treatment. According to Mian in (2014) In-Memory databases like MemSQL are used to scan queries faster even with joins. Another in-memory database, VoltDB works faster with condition clauses. There is a dire need to go beyond the current practices in healthcare where it is required to i) handle bigdata, ii) extract data-driven knowledge and iii) exploit acquired knowledge to make decisions. Variable heterogeneity, patient heterogeneity and time asynchronization are used by Yun Chen in (2014) as the characteristics associated with data. Here data categorization, data pre-processing, feature extraction, feature selection and predictions are performed step by step.
Medical data are an asset to analyze and predict future disease, symptoms and treatments. Healthcare transformation objectives are discussed by Chaitanya Kaul in (2015). Sustainable healthcare systems with collaborative techniques are used. Operational efficiencies can be improved. Responses to disease epidemics can be planned and predicted. Moreover optimized data of patients can be converged with hospital systems. Thus quality can be improved in healthcare sector. Bigdata here is analyzed using the data from pharmaceutical companies. Electronic medical and health records as in (Raghunath Nambiar, 2013) by Raghunath Nambiar are obtained from healthcare providers and clinical database. Recent advancement in engineering technologies has made it easier to collect, store, aggregate, analyze and transfer data from various resources.
Later in (Marco Viceconti, 2015) 5V’s were introduced by Marco Viceconti namely volume, variety, velocity, veracity and value. These help to identify patients after analyzing large volumes of patient data and correlate them to develop predictive models using statistical or machine learning techniques. R is a framework for developing and applying predictive models by Gregor Stiglic in (2014) including data preparation, tuning and evaluation of large medical records.
Haemorrhagic fever occurred in Africa during the year 1976. Ebola virus was identified in humans from congo according by georges in. During fall 1994, first epidemic was recorded and the symptoms include arthralgia, conjunctivitis, diarrhea, fever, jaundice, melena or myalgia, was found. The second epidemic occurred during spring in 1996 where bloody diarrhea, headache, fever were recorded. The third epidemic happened in the fall of 1996 where fever, bleeding, vomiting, diarrhea, and headache were the notable symptoms. They were largely confined to the remote locations in Africa and the sick patients were quarantined. According to (Bausch, D.G., 2014) severe outbreak occurred in Liberia, Sierra Leone and Guinea as given by Bausch.
Proposed work:
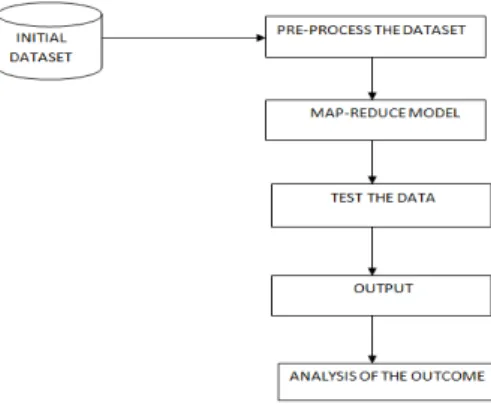
The dataset used in bigdata involves Ebola. Through patient records, an analysis was made in order to check the outcome on the fatality rate. The attributes in the dataset contains the interval between the symptoms offset, WHO (World Health Organization) notification and hospitalization which are assigned with key/value
pairs. As the dataset may consist of attributes that are not required, filtering techniques have been applied so
Ratings can be given to each of the factors on the patient information the mortality of the patient can be detected whereby it can determine the mortality rate. Earlier detection might be useful to prevent the death of the patient by providing solution to the factors that lead to death. The input dataset is a sample of the population infected with Ebola virus.
MySQL is used for storing datasets. To bring this data into the Distributed File System (DFS), Sqoop is required. The factors causing or leading to the spread of Ebola are used in creating IMDB code.
Fig. 1: Proposed Architecture.
In Daniel Peraltaa uses a map function to associate key value pair. The reduce function aggregates the key value pair and gives a new key value pair as the output.
Map (key1, value1) → Reduce (key2, value2)
The map phase splits input across various mappers in order to perform the task where all the values of the attributes in the dataset are been recognized. With the reduced results further analysis can be done. This in turn helps us to know the actual reason for the cause of death and find adequate solutions to reduce the mortality rate. A partition function can be used on the intermediate key to partition data across the tasks. Hashing is used as a default partitioning. Thus well-balanced partitions are produced. The intermediate key/value pairs are in an incremental order. Thus the sorted output files can be computed per partition that supports potential random access lookups by keys. This enables the users to have the sorted data. The intermediate keys produced by the mapper tasks are repetitive and the reduce functions are permutable and exclusive. The reduce function writes the output in the final output file. For a “text” input each line is considered as a key value pair where the key is the offset of the file and the value is the contents of the line. An alternative way is to store the key/value pairs that are sorted using the key. It allows scheduling redundant execution of tasks near the end of the job which greatly decrease the finishing implementation. Meaningful ranges are used for processing individual map tasks. Thus debugging, profiling and small-scale testing can be done in the same local machine using the operations in the MapReduce by using the MapReduce library. The users can control the map tasks by invoking their program with special flags which can be used for debugging and testing. The status of the progress of computation includes tasks that are in progress, input bytes, intermediate data bytes, output bytes, processing rates, etc.
The users can assume the computation time of the resources. A built-in identity function is used as a Reducer operator which passes the intermediate key/value pair as the unchanged output key/value pair. Partitioning involves built-in knowledge of the distribution of keys. A MapReduce operation collects a sample of keys to compute splitting points for the final sort. The shuffling rate is higher than the output rate in order to provide reliability and availability to the replica of data. This execution overview is clearly depicted in Fig. 2.
For instance, if the patient’s initial symptom is fever, headache, vomiting, diarrhea then they will survive for more days if properly treated but in case their initial symptom is bleeding then the chance of survival will be less and hence surgical treatment should be promptly triggered to mitigate the arising side effects by sidelining the affected organ condition. Correlating all these values can be created for each of them and a key for each dataset is fixed.
Fig. 2: Execution Overview.
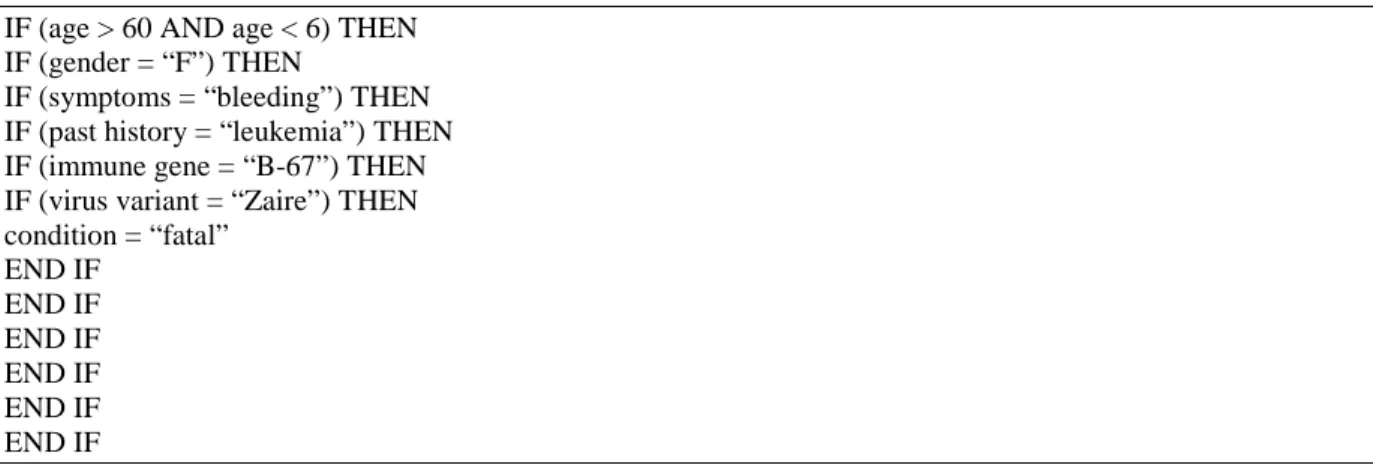
Various factors are used in the algorithm to analyze intensity and impact of Ebola virus on each patient in the given dataset. A sample pseudo code of the algorithm is given in Fig. 3.
IF (age > 60 AND age < 6) THEN IF (gender = “F”) THEN
IF (symptoms = “bleeding”) THEN IF (past history = “leukemia”) THEN IF (immune gene = “B-67”) THEN IF (virus variant = “Zaire”) THEN condition = “fatal”
END IF END IF END IF END IF END IF END IF
Fig. 3: A Sample Pseudo Code.
Predictions on these results can be made so that many will survive, if suitable actions are taken to control the fatal disease.
Implementation And Results:
The input is taken into MySql where data reduction, categorization and transformation take place. This is the pre-processing phase. MySql is used to maintain information present within records. In order to bring this data into Hadoop Sqoop is required. Sqoop allows inflow and outflow simultaneously within relational database tables. Java classes need to be generated to store and retrieve the data. Sqoop decides how to split the table rows across the map jobs. Capacity is virtually unlimited and scalability is automatic. The tables can be efficiently used to create a large range of new and exciting analysis. Structures that accept new rows are in Sqoop and it has columns with continuous incremental value. Grouping the new records with the old records by overwriting the contents from the old records with contents from the new records can be done. Sqoop handles large use cases by employing grouping techniques and strategies for multiple export map tasks, to map simultaneous changes from one database technology to another.
factors of the patient using the IMDB code. The reducer combines all the mapper answers to give the output which turns out to be is either fatal or non-fatal.
Here, Ebola patient records are partitioned into M fragments. The input fragments can be processed in parallel. Reduce invocation are distributed by the key value and the number of reduce workers are specified by the user.
The master is one of the special copies of the program. The rest are nodes that are assigned work by the master. There are M map nodes and R reduce nodes to be assigned. The master picks idle nodes and assigns each one a map job or a reduce job. A node which is assigned with a map job reads the contents of the corresponding input split. It parses key/value pairs produced by the mapper and are buffered in memory. The buffered pairs are written to local memory, split into R splits by the partitioning function. The locations of these buffer pairs on the local memory are passed back to the master, who should efficiently work for forwarding these locations to the reduce workers. When a reducer is informed by the master about these positions, it uses remote procedure calls to read the buffered data from the local memory of the mapper.
When a reducer has read the data it segregates all the keys so that all the instances of the same key are batched together. The sorting is needed because typically many different keys map to the same reduce task. If the amount of data is too large to set in memory, an external sort is used. The reducer continues over the segregated data and for each different key recognized, it sends the key and the corresponding set of values to the reduce function of the user. The result of the reducer is updated to a final output file. When all mapper and reducer jobs have been completed, the master wakes up the user program. At this point, the MapReduce call in the user instruction which returns back to the user source.
After successful completion, the output of the MapReduce result is available in the R output files.
The master keeps several data structures. For each map task and reduce task, it stores the status such as idle, in-progress or completed. The master is the conduit through which the location of the file regions is sent from the map tasks to the reducer tasks. Therefore, for each completed map task, the master stores the regions and volume of the R file regions produced by the map task. Updates on the location and size of the results are notified as map jobs are completed. The information is pushed incrementally to workers that have in-progress reduce tasks.
In the input data all the patient factors are given to the master where the master splits the tasks and provide them to the mapper. The output from the mapper phase is given to the reducer which aggregates the result of the mapper in order to give the output file from where the user can retrieves it.
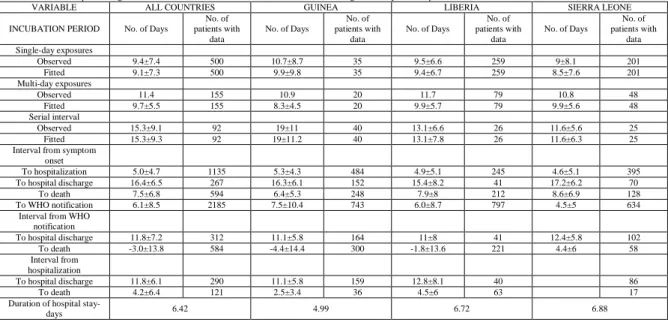
As in Table I given below, we have carried out analysis on the hospitalized patients to evaluate the impact of symptoms on the fatality rate and the impact of fatality rate after WHO notifications.
Table I: Estimates of Epidemiologic Variables of Confirmed and Probable Ebola Cases, According to Country, as of September 14, 2014.
VARIABLE ALL COUNTRIES GUINEA LIBERIA SIERRA LEONE
INCUBATION PERIOD No. of Days
No. of patients with
data
No. of Days
No. of patients with
data
No. of Days
No. of patients with
data
No. of Days
No. of patients with
data Single-day exposures
Observed 9.4±7.4 500 10.7±8.7 35 9.5±6.6 259 9±8.1 201
Fitted 9.1±7.3 500 9.9±9.8 35 9.4±6.7 259 8.5±7.6 201
Multi-day exposures
Observed 11.4 155 10.9 20 11.7 79 10.8 48
Fitted 9.7±5.5 155 8.3±4.5 20 9.9±5.7 79 9.9±5.6 48
Serial interval
Observed 15.3±9.1 92 19±11 40 13.1±6.6 26 11.6±5.6 25
Fitted 15.3±9.3 92 19±11.2 40 13.1±7.8 26 11.6±6.3 25
Interval from symptom onset
To hospitalization 5.0±4.7 1135 5.3±4.3 484 4.9±5.1 245 4.6±5.1 395
To hospital discharge 16.4±6.5 267 16.3±6.1 152 15.4±8.2 41 17.2±6.2 70
To death 7.5±6.8 594 6.4±5.3 248 7.9±8 212 8.6±6.9 128
To WHO notification 6.1±8.5 2185 7.5±10.4 743 6.0±8.7 797 4.5±5 634
Interval from WHO notification
To hospital discharge 11.8±7.2 312 11.1±5.8 164 11±8 41 12.4±5.8 102
To death -3.0±13.8 584 -4.4±14.4 300 -1.8±13.6 221 4.4±6 58
Interval from hospitalization
To hospital discharge 11.8±6.1 290 11.1±5.8 159 12.8±8.1 40 86
To death 4.2±6.4 121 2.5±3.4 36 4.5±6 63 17
Duration of hospital
stay-days 6.42 4.99 6.72 6.88
From March 2014 many Ebola cases have been observed until September 2014. This epidemic consumed most of the population from Sierra Leone, Guinea and Liberia. Nigeria was also is affected due to this hemorrhagic fever. The number of death cases is nearly equal with the number of affected cases which is an indication that all Ebola patients faced death. The table above depicts the data collected from three major provinces severely affected by the epidemic namely Guinea, Liberia and Sierra Leone.
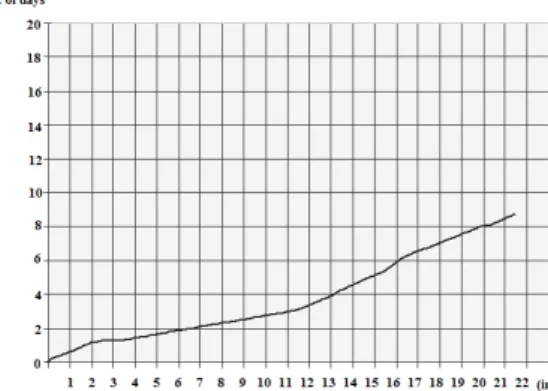
indication of patients who have survived the disease and have been discharged from hospital after the onset of symptoms. Fig.6 emphasizes on the fatality rate of patients after the onset of symptoms. Hence it is indication of the death rate after hospitalization.
Fig. 4: Incubation period between symptom onsets to hospitalization.
Fig. 5: Incubation period between symptom onsets to hospital discharge.
Fig. 6: Incubation period between symptom onsets to death.
Fig. 8: Incubation period between WHO notifications to hospital discharge.
Fig. 9: Incubation period between WHO notification to death.
As the epidemic had serious effects on human population, WHO was notified by 18th August 2014 and
subsequent actions were initiated by WHO. Doctors and physicians from various parts of the world with suitable medicines were rushed to the affected areas and monetary flows were initially encouraged from various nations and countries. Fig.7. depicts the symptoms which intimidated admission of patients into hospital after WHO notification. Fig.8 and Fig.9 shows the fatality rate and survivability rate of patients after hospitalization. This is an indication of the impact of additional support received from WHO in decreasing the impact of symptoms in order to contain and control the disease effectively.
Conclusion And Future Work:
The greatest challenge in healthcare is to get access to a very large database, which is scalable to petabytes, to accommodate patient data from multiple sources. In this proposed work, bigdata was used and MapReduce model in the hadoop framework paves the way to find solution for Ebola which is one of a life threatening epidemic which claimed many lives in Africa throughout the past years. Sample test cases from the population were obtained for the analysis. Many patient factors were considered from the test results which served as the basis for the experimentation to take place. Still enhancing could be done with more parameters and analysis. This paper could serve as a base for the future generation to observe and make new transformations over the past findings. This can significantly reduce human mortality rate. Prediction analysis is a key technique that can be used to extend the clinical and treatment decisions in healthcare field. Once high risk patients are identified, they can be given personalized medication or suggestions to avoid risk of death and thereby help in containing the disease.
REFERENCES
Bausch, D.G., J.S. Towner, Dowell, 2014. “Ebola virus disease in West Africa— the first 9 months of the epidemic and forward projections,” New England Journal of Medicine, 371: 1481-1495.
Carson Kai-Sang Leung, Richard Kyle MacKinnon Fan Jiang, 2014. “Reducing the Search Space for Big Data Mining for Interesting Patterns from Uncertain Data,” IEEE International Congress on Big Data, 315 – 322.
Chaitanya Kaul, Ashmin Kaul, Saura Verma, 2015. “Comparitive Study on Healthcare Prediction systems using Big Data,” IEEE Sponsored International Conference on Innovations Information Embedded and Communication Systems, 1 – 7.
Daniel Peraltaa, Sara del R´ıoa, Sergio Ram´ırez-Gallegoa, Isaac Triguerob. C. Jose M. Beniteza, Francisco Herreraa, 2015. “Evolutionary Feature Selection for Big Data Classification: A MapReduce Approach,” Mathematical Problems in Engineering.
Eichner, M., S.F. Dowell, N. Firese, 2011. “Incubation period of ebola hemorrhagic virus subtype zaire,” Osong Public Health Research Perspective, 2(1): 3-7.
Georges, A.J., E.M. Leroy, A.A. Renaut, C.T. Benissan, R.J. Nabias, M.T. Ngoc, P.I. Obiang, J.P. Lepage, E.J. Bertherat, D.D. Benoni, 1999. “Ebola hemorrhagic fever outbreaks in Gabon, 1994-1997: epidemiologic and health control issues,” Journal Infect Disease, 179(1): 65-75.
Gregor Stiglic, 2014. “Tutorial: Developing and Deploying Healthcare Predictive Models in R”, IEEE International Conference on Healthcare Informatics Algorithm, 363.
Jagdale, A.R., K.V. Sonawane, S.S. Khan, 2014. “Data Mining and Data Pre-processing for Big Data,” International Journal of Scientific and Engineering Research, 5-7.
Jayasri, K., R. Rajmohan, D. Dinagaran, 2015. “Analyzing the Query Performances of Description Logic based Service Matching using Hadoop,” International Conference on Smart Technologies and Management for Computing, Communication, Controls, Energy and Materials, 6(8): 1-7.
Kyuseok Shim, 2012. “MapReduce Algorithms for Big Data Analysis”, International Conference on Very Large Data Bases, Istanbul, Turkey, Proceedings of the VLDB Endowment, 5-12.
Li Zha, Jie Zhang, Wei Liu, Jian Lin, 2015. “An Uncoupled Data Process and Transfer Model for MapReduce,” LNCS, 24–44.
Lin, Chin-Ho, Huang, Liang-Cheng, Chou, Seng-Cho T, Liu, Chih-Ho, Cheng, Han-Fang, Chiang, I-Jen, 2014. “Temporal Event Tracing on Big Healthcare Data Analytics,” BigData (BigData Congress), IEEE International Congress, 281 – 287.
Marco Mesiti, Stefano Valtolina, 2014. “Towards a User-Friendly Loading System for the Analysis of Big Data in the Internet of Things,” IEEE Annual International Computers, Software and Applications Conference Workshops, 312 – 317.
Marco Viceconti, Peter Hunter, Rod Hose, 2015. “Big Data, Big Knowledge: Big Data for Personalized Healthcare”, IEEE Journal of Biomedical and Health Informatics, 19-4.
Mian, Muaz, Teredesai, Ankur, Hazel, David, Pokuri,Sreenivasulu, Uppala, Krishna, 2014. “Work in Progress - In-Memory Analysis for Healthcare BigData,” BigData (BigData Congress), IEEE International Congress, 778 – 779.
Nima Bari, Duoduo Liao, Simon Berkovich, 2014. “Organization of Meta-knowledge in the Form of 23-bit Templates for Big Data Processing,” International Conference on Computing for Geospatial Research and Application, 87 – 90.
Pigul, A., 2012. “Comparative Study Parallel Join Algorithms for MapReduce environment,” Institute for System Programming of the Russian Academy of Sciences, 23(3): 285-306.
Raghunath Nambiar, Ruchie Bhardwaj, Adhiraaj Sethi, RajeshVargheese, 2013. “A Look at Challenges and Opportunities of Big Data Analytics in Healthcare”, IEEE International Conference on Big Data, 17 – 22.