Available online throug
ISSN 2229 – 5046DETECTION OF ERRORS IN AGE DATA OF NATIONAL HEALTH INSURANCE SCHEME
REGISTRANTS IN GHANA: DEMOGRAPHIC INDEXES APPROACH.
1
BOSSON-AMEDENU SENYEFIA*
Department of Mathematics and I.C.T, Holy Child College of Education, Takoradi, Ghana.
2
THEODORE ODURO-OKYIREH
Department of Mathematics,
Statistics and Computer Studies, Cape Coast, Ghana.
3
OSEI-ASIBEY EUNICE
Department of Mathematics and I.C.T, Ada College of Education, Ada-Foah, Accra.
(Received On: 22-01-19; Revised & Accepted On: 04-03-19)
ABSTRACT
T
he most significant errors found in demographic data have been widely known to occur in age reporting. This study sought to assess the precision of age reporting by registrants of National Health Insurance Scheme (NHIS) of the Sekondi District of Ghana for the month of June, 2018 by employing demographic indexes. Myer’s index found about 16% of male and 24% of female registrants to have respectively misreported their ages with wrong terminal digit. For both female and male ages reported, there was a terminal digit preference for 0 and 5 with percentages of about 14% and 17% respectively for females and about 16% and 20% respectively for male registrants. The most avoided terminal digit for male and female registrants were 3 and 2 respectively. Additionally, the UN Joint score with an index of 138.14 qualified the data as highly inaccurate. By comparing the absolute sum of deviations from 100 of both male and female ages, it was evident that there were more inaccuracies in the age data of females than males. Again, the Whipple’s index qualified the data as approximate and rough for terminal digit of 5 for male and female ages respectively. However, Whipple’s index qualified the data as highly accurate for both male and female registrants with terminal digit of 0. The greatest fluctuation for both male and female age ratios occurred at higher age intervals of 45-49 and 60-64years; an indication of large differences of populations in adjacent groups. Mandatory birth registration was recommended to be enforced in Ghana.Keywords: Whipple’s Index, Myer’s Index, UN Index, Health Insurance, Ghana.
1. INTRODUCTION
Demographic indexes (such as Whipple’s index, Myer’s blended index, and joint score) give one way of detecting errors in single years of age. Other methods include post enumeration survey and record matching. Digit preference may be defined as the tendency of one to report certain ages at the expense of other ages. Age heaping is a major error recorded when ages are recorded in single years although other errors such as misreporting, non-reporting of age may also be realized in single years. Age errors due to misreporting or digit preference have been extensively examined in many studies including population census, surveys, as well as epidemiological studies (i.e including Pardeshi (2010), Shirley et al., (2004), and Denic et. al, 2003).
Bello (2012) used demographic indexes on ages reported by outpatients in General Hospital Dutsin-ma of Nigeria, in January 2012.From the results, Myer’s index indicated that 86% of male and 88% of female outpatients were inaccurate in reported ages with wrong terminal digits. The study reported the terminal digits of 5 and 0 as the most preferred. However, the most avoided digit was 1. In addition, the Whipple’s index indicated a rough data and identified age heaping at terminal digits of 0 and 5.Again, the Joint score indicated the data as highly inaccurate. Female age data showed more inaccuracy which was almost twice that of the male age data.
Another study by Barua (2015) in Bangladesh sought to compare the quality of age data from two sources; Chittagong Medical College (CMC) and the population of Health Demographic Surveillance System (HDSS) in Matlab. According to the results of the study, the Whipple’s index qualified the data as very rough for both male and female CMC Hospital outpatients. However, Matlab HDSS data for both male and female was found to be accurate. With the Myer’s index, it was found out that 64% (male) and 72% (female) outpatients misreported their ages with incorrect terminal digits in CMC Hospital. The most avoided digits were 9 and 1 whilst the most preferred digits were 0 and 5. On the contrast, the Matlab HDSS showed no digit preference for both male and female. Again, the joint score for CMC Hospital outpatients which qualified the data as highly inaccurate was found to be approximately 4 times higher than the Matlab HDSS. The study identified fluctuations in the age interval of 15-19 to 35-39 for male age ratios and higher fluctuations age interval of 35-39 to 60-64 years for female age ratios.
A good planning of a country’s development depends on the accurate data on sex and age.Again, there is the need to evaluate or assess age data since: (a) illiterate population are highly likely to misreport correct age (b) enumerators may be careless in recording age (c) there is a tendency for people to report ages ending in 0 or 5 (d) older folks tend to exaggerate length of life (e) some people tend to have the sub-conscious aversion to some numbers (f) due to some political, economic, social or personal reasons some people mis-place their age.
2. METHODOLOGY
The age and sex data of new registrants was collected from the Sekondi District of the National Health Insurance Scheme for the period spanning 1st to 30th June of the year 2018.
2.1 Method of Data Analysis
The demographic methods such as Whipple's index and Myers' blended index were used for measuring the degree of age heaping and digit preference or avoidance. United Nation Index or Joint Score was also calculated.
2.2 Whipple’s Index
Whipple’s Index measures age heaping or digit preference. It also reflects digit avoidance. Based on rectangularity assumption for 5- year age range, heaping on terminal digit 0 and 5 combined in the age range 23-62 may measured by comparing the sum of the population at ages in this range ending in zero and five with 1/5 of the total population in the age range. This is computed as:
Whipple’s Index =1𝑃25+𝑃30+𝑃35+𝑃40+𝑃45+⋯+𝑃60 5(𝑃23+𝑃24+𝑃25+…+𝑃60+𝑃61+𝑃62)× 100
.
For a 10 year age range based on the assumption of rectangularity or of linearity, age heaping in the age range of 23-62 years may be calculated by comparing the sum of the populations at the ages ending in zero in this age range 23-62 with 1/5th of the total population in the age range. This is computed as:
Whipple’s Index =1 𝑃30+𝑃40+𝑃50+𝑃60
5(𝑃23+𝑃24+𝑃25+…+𝑃60+𝑃61+𝑃62)× 100
.
For a 5 year age range based on the assumption of rectangularity or of linearity, age heaping in the age range of 23-62 years may be calculated by comparing the sum of the populations at the ages ending in 5 in this age range 23-62 with 1/5th of the total population in the age range. This is computed as:
Whipple’s Index =1 𝑃25+𝑃35+𝑃45+𝑃55
5(𝑃23+𝑃24+𝑃25+…+𝑃60+𝑃61+𝑃62)× 100
.
Whipple’s index measures the heaping of digit ending only in zero or five. Whipple’s index calculated value of 100 can be interpreted as zero preference for digit with terminal in zero or five. Whipple’s index calculated value of 500 means only terminal digits of zero or five were reported (Kpedekpo, 1982). The scale of reliability of Whipple’s index is as follows:
Highly Accurate less than 105
Quality of the data Whipple’s Index
Fairly Accurate 105 -109.9
Approximate 110 -124.9
Rough 125 – 174.9
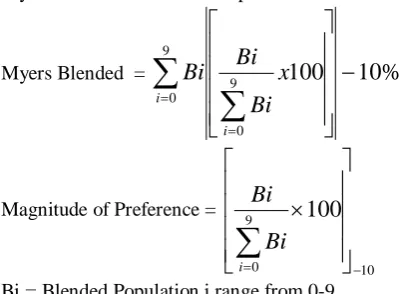
2.3 Myers Blended index
Myers index which only applies to age data in single years measures the preference or avoidance for ten digits of 0, 1, 2, 3, 4, 5, 6, 7, 8 and 9. It is also referred to as a blended method since it takes care of the flaw of bias in the computation of the indexes and avoids the assumption in the case of Whipple’s index that ages of childhood and extreme old age more affected by other types of errors than by preference for specific terminal digit. It requires data within the ages of 10-69, or 10-79 or 10-89.
Myer’s Blended Index is computed as:
Myers Blended = 9
100
10
%
0 9 0
−
∑
∑
= =x
Bi
Bi
Bi
i iMagnitude of Preference =
10 9 0
100
− =
×
∑
iBi
Bi
Bi = Blended Population i range from 0-9,
∑
= 9
0
i
Bi
= Grand Blended Population3. WHIPPLE’S INDEX
Table -1: Age Distribution of Male Registrants of Sekondi District Branch of NHIS in the month of June, 2018 in Ghana
The digit preference with ages with terminal digits of 0 and 5 is computed as
(
)
561
100
226.0
1
1241
5
×
=
.The value 226.0 is interpreted by the UN standards to mean that the data is of a very rough quality.
The Whipple’s index for male ages ending with 5 is
(
)
310
100 124.9
1
1241
5
×
=
.Whereas the Whipples index for male ages ending with 0 is
(
)
251
100 101.1
1
1241
5
×
=
.Age Number of NHIS Registrants Age Number of NHIS Registrants
23 98 25 98
24 104 30 63
25-29 240 35 70
30-34 104 40 60
35-39 128 45 38
40-44 114 50 96
45-49 84 55 104
50-54 156 60 32
55-59 169 TOTAL 561
60 19
61 2
62 23
This shows that the age reporting of male registrants with ages which have terminal digit of 0 can be deemed as Highly accurate (i.e Whipple’s index of 101) under the scale of reliability of whipple’s index. However, ages reported with terminal digits of 5 with Whipple’s index of 124.9 is considered approximate under the scale of reliability of Whipple’s index.
Table-2: Age Distribution of Female Registrants of Sekondi District Branch of NHIS in the month of June, 2018 in Ghana
The digit preference with ages with terminal digits of 0 and 5 is computed as
(
)
929
100
271.5
1
1711
5
×
=
.The value 271.5 or 272 is interpreted by the UN standards to mean that the data is of a very rough quality.
The Whipples index for female ages ending with 5 is
(
)
582
100 170.1
1
1711
5
×
=
.Whereas the Whipples index for female ages ending with 0 is
(
)
310
100
90.6
1
1711
5
×
=
.This shows that the age reporting of females with ages which have terminal digit of 0 can be deemed as Highly accurate (i.e whipple’s index of 90.6) under the scale of reliability of whipple’s index. However, ages reported with terminal digits of 5 with whipple’s index of 170.1 is considered rough under the scale of reliability of whipple’s index.
3.1 Combined Discussions on Tables 1 And 2
The Whipple’s Index computed for male and female NHIS membership registration was respectively 226 and 272. These indices show that females have a higher tendency to prefer ages ending in 0 and 5 than males. This tendency may be due to a number of factors including: high illiteracy rate among females, that they have lower interest in age particularly in traditional set up; and males in most cases report the age of females on their behalf and there is a tendency to use rounded figures for females.
Female and male digit preference for ages with terminal digits of 0 were respectively 90.6 and 101.1 .Although all these indices are of a highly accurate data quality, females can be interpreted to have less preference for terminal digits of 0 than males (
90.6 101.1
<
).Similarly, female and male digit preference for ages with terminal digits of 5 were respectively 170.1 (very rough data quality) and 124.9 (rough data quality).Male registrants can be interpreted to have less preference for terminal digits of 0 than males (
124.9 170.1
<
).Age Number of NHIS Registrants Age Number of NHIS Registrants
23 112 25 328
24 128 30 113
25-29 440 35 115
30-34 220 40 118
35-39 228 45 47
40-44 172 50 87
45-49 62 55 92
50-54 152 60 29
55-59 160 TOTAL 929
60 22
61 5
62 10
The percentage of age heaping for the ages with terminal digits of 5 increased with increasing age except for the ages 20-29 and 30-39. Similarly, the percentage of age heaping for the ages with terminal digits of 0 increased with increasing age except for the age interval of 50-59.The highest terminal age digit preference for the terminal digit of 0 was found in the age group of 60-69.However, the highest terminal age digit preference for the terminal digit of 5 occurred in the age bracket of 20-29.This may be due to fewer ages reported in the other higher age bracket for the period used for the study.
Again, the percentage of age heaping for the ages with terminal digits of 5 increased with increasing age except for the ages 40-49 and 60-69. Similarly, the percentage of age heaping for the ages with terminal digits of 0 increased with increasing age except for the age intervals of 50-59 and 60-69.The highest terminal age digit preference for the terminal digit of 0 was found in the age group of 40-49.However, the highest terminal age digit preference for the terminal digit of 5 occurred in the age bracket of 50-59. This sporadic trend might be due to the inability of the scheme to register more people in the higher age brackets of 50-59 and 60-69 for the month under consideration.
4. MYER’S BLENDED INDEX
Table-3: Myer's Blended Index for Male NHIS Registrants
Terminal Digits
Sum of age 10-89
Coefficient Ages 10-89 coefficie
nt product
Sum of age 20-89
Coefficient Ages 10-89 coefficien
t product
Blended Sum
% Distribution
Deviatio n from
10
0 351 1 351 252 9 2268 2619 15.63 5.63
1 186 2 372 134 8 1072 1444 8.62 -1.38
2 173 3 519 131 7 917 1436 8.57 -1.43
3 118 4 472 87 6 522 994 5.93 -4.07
4 152 5 760 113 5 565 1325 7.91 -2.09
5 370 6 2220 279 4 1116 3336 19.91 9.91
6 200 7 1400 139 3 417 1817 10.85 0.85
9 137 10 1370 119 0 0 1370 8.18 -1.82
Sum 1936 16754 100.00 32.78
Summary Index of
age preference
𝑻𝒐𝒕𝒂𝒍 𝑰𝒏𝒅𝒆𝒙 𝟐
16.39
Table 3 makes evident the persistent preference of terminal digits of 0 (15.6%) and 5 (19.9%) in age reporting during NHIS registration among male registrants. However the ages ending with terminal digits of 3 recorded the highest avoidance (5.9%) followed by terminal digit of 7 (6.1%). Ages reported which had terminal digits of 5 were 4.3% more than those ages ending with terminal digit of 0. Ages reported which had terminal digits of 5 among male registrants had the most preference (19.9%). About 16 % of the male registrants reported their ages with incorrect terminal digits.
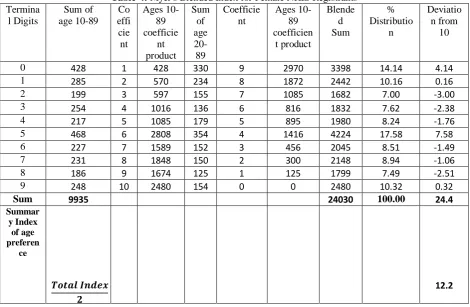
Table-4: Myer's Blended Index for Female NHIS Registrants Termina
l Digits
Sum of age 10-89
Co effi cie nt
Ages 10-89 coefficie
nt product
Sum of age
20-89
Coefficie nt
Ages 10-89 coefficien
t product
Blende d Sum
% Distributio
n
Deviatio n from
10
0 428 1 428 330 9 2970 3398 14.14 4.14
1 285 2 570 234 8 1872 2442 10.16 0.16
2 199 3 597 155 7 1085 1682 7.00 -3.00
3 254 4 1016 136 6 816 1832 7.62 -2.38
4 217 5 1085 179 5 895 1980 8.24 -1.76
5 468 6 2808 354 4 1416 4224 17.58 7.58
6 227 7 1589 152 3 456 2045 8.51 -1.49
7 231 8 1848 150 2 300 2148 8.94 -1.06
8 186 9 1674 125 1 125 1799 7.49 -2.51
9 248 10 2480 154 0 0 2480 10.32 0.32
Sum 9935 24030 100.00 24.4
Summar y Index of age preferen
ce
𝑻𝒐𝒕𝒂𝒍 𝑰𝒏𝒅𝒆𝒙 𝟐
12.2
Inferring from Table 4, ages reported which had terminal digits of 5 among female registrants had the most preference (17.6%) followed by ages with terminal digit of 0 (14.4%). However, the ages ending with terminal digits of 2 recorded the highest avoidance (7.0%) followed by terminal digit of 8 (7.5%). Ages reported which had terminal digits of 5 were 3.5% more than those ages ending with terminal digit of 0. Ages reported which had terminal digits of 5 among female registrants had the most preference (17.6%). About 24 % of the female registrants reported their ages with incorrect terminal digits.
5. AGE-SEX ACCURACY INDEX OR UNITED NATIONS INDEX
Table-5: Age-Sex Accuracy Index or United Nations Index of NHIS registrants
Fig. 3 shows fluctuations in the age groups from 5-9 to 60-64 for both male and female age ratios. Both male and female age ratios recorded very high fluctuations between 20-24 and 30-34 and massive fluctuations were detected at upper age group for both male and female age ratios ;thus 45-49 to 60-64 years. These fluctuations are indication of large differences of populations in adjacent groups.
6. CONCLUSIONS
This paper applied Whipple’s Index, Myer's Blended Index and Age-sex Accuracy Index to evaluate the age and sex data collected from National Health Insurance Scheme of the Sekondi District of Ghana on registrants for the month of June, 2018. The data was found to be of very rough quality for both male and female registrants by the method of Whipple’s Index. However, male and female registrants with ages which have terminal digit of 0 were found to be highly accurate. The quality of male and female reported ages with terminal digits of 5 was found to be approximate and rough respectively.
The Summary Index of age preference by the method of Myer’s index was found to be 16.39 for male registrants and 12.2 for female registrants. Male ages reported by registrants who had terminal digits of 5 had the most preference (19.9%) followed by ages with terminal digit of 0 (15.6%).In the case of female registrants, ages reported which had terminal digits of 5 had the most preference (17.6%) followed by ages with terminal digit of 0 (14.4%). The evaluation of the ages reported by NHIS registrants by use of demographic techniques has eventually qualified the data inaccurate due to systematic age heaping and digit preference. Again, United Nations Index of NHIS was 138.14 which qualify the
Terminal Digits
Male Registrant Population
Age Ratio
Deviation from 100
Female Registrant Population
Age Ratio
Deviation from 100
Sex Ratio
Successive Difference
0-4 428 416 102.89
5-9 376 108.83 8.83 342 101.18 1.18 109.94 -7.06
10-14 263 77.58 -22.42 260 67.8 -32.2 101.15 8.79
15-19 302 122.02 22.02 425 123.19 23.19 71.06 30.10
20-24 232 85.61 -14.39 430 99.42 -0.58 53.95 17.11
25-29 240 142.86 42.86 440 135.38 35.38 54.55 -0.59
30-34 104 56.52 -43.48 220 65.87 -34.13 47.2 7.27
35-39 128 117.43 17.43 228 116.33 16.33 56.14 -8.87
40-44 114 107.55 7.55 172 118.62 18.62 66.28 -10.14
45-49 84 62.22 -37.78 62 38.27 -61.73 135.48 -69.20
50-54 156 123.32 23.32 152 136.94 36.94 102.63 32.85
55-59 169 153.64 53.64 160 164.95 64.95 105.63 -2.99
60-64 64 54.47 -45.53 42 45.16 -54.84 152.38 -46.76
65-69 66 88 -12 26 65 -35 253.85 -101.47
70+ 86 416
Absolute Total
339.25 380.07 343.2
Mean 28.27 31.67 26.4
7. RECOMMENDATIONS
The study recommended the following:
a. Mandatory birth registration is recommended to be enforced in Ghana. b. Ghanaian citizens should be educated on the need to report correct age.
c. Where respondents or registrants find it difficult to state their ages, calendar of historical event technique should be encouraged.
8. REFERENCES
1. G.S. Pardeshi, Age heaping and accuracy of age data collected during a community survey in the Yavatmal district, Maharashtra, Indian J Community Med, 35(3) (2010), 391-395.
2. L. Shirley, V. Ravi and M. Margaret, An evaluation of the age and sex data from the census population of Canada, provinces and territories, 1971 to 2001, Canadian Population Society Annual Meeting, Winnipeg, Manitoba, (2004). http://web.uvic.ca/~canpop/2004/Loh-Verma-Michalowski-CPS04.ppt.
3. S. Denic, F. Khatib and H. Saadi, Quality of age data in patients from developing countries, Journal of Public Health, 26(2) (2003), 168–171.
4. Bello Y., (2012). Error Detection in Outpatients’ Age Data Using Demographic Techniques. International Journal of Pure and Applied Sciences and Technology. Int. J. Pure Appl. Sci. Technol., 10(1) (2012), 27-36..
ISSN 2229 – 6107. Available online at www.ijopaasat.in.
5. Barua, R.K (2015). Detection of Digit Preference and Age Misreporting by using Demographic Techniques.A
thesis submitted in partial fulfillment of the requirements for the degree of Master of Population, Reproductive Health, Gender and Development
(MPRHGD) at East West University, Dhaka, Bangladesh.
6. Kpedekpo G.M.K. (1982). Essentials of Demographic Analysis for Africa. Hernerman Educational Books Inc., ew Hemisphere.
Source of support: Nil, Conflict of interest: None Declared.