ISSN 2307-7743 http://scienceasia.asia
_______________
Key words and phrases: Hepatitis c virus, Immune system, Disease-free equilibrium, Therapy, Effective reproductive number.
© 2017 Science Asia 1 / 22 MATHEMATICAL MODEL FOR THE ACUTE HEPATITIS C VIRUS INFECTION SUBJECT
TO IMMUNE SYSTEM RESPONSE AND THERAPY
SELEMAN ISMAIL1, *, LIVINGSTONE LUBOOBI1, 2, YAW NKANSAH-GYEKYE1 Abstract:
Hepatitis C virus (HCV) is a source of chronic hepatitis C infection that can destroy the liver when proper therapeutic intervention is not executed early. For the purpose of studying the dynamics of the disease during acute infection, a deterministic mathematical model incorporating the effect of immune system and therapy has been formulated. The model is a system of non-linear ordinary differential equations. The disease-free equilibrium point
0
E during therapy has been computed. Furthermore, the basic reproductive number R0and
effective reproductive number Rehave been computed using the next generation operator
method. The sensitivity indices of Re relating to each parameter in the model were
computed. It is found that Reis most sensitive to the drug inhibiting efficacy of viral
replication parameter
. Thus, it implies that an increase in the value of
will reduce therate of viral replication leading to the decrease or eradication of the HCV morbidity. By
using the estimated parametric values, we found thatRe R0, which attests that
therapeutic strategy is absolutely effective in reducing intensity of the disease and hence preventing evolution to chronic state.
1. Introduction
HCV is a small positive-stranded RNA microbe belonging to the Hepacivirus genus in the
family Flaviviridae (Taxonomy, 2005), which mutates so rapidly that there is no vaccine
evident that around 20% to 50% patients with AHCI spontaneously clear the virus within 6 months (Kamal, 2008) while others progress to CHCI. It implies that more than 50% of AHCI cases undergo CHCI, which can be a source of evolution of cirrhosis and hepatocellular carcinoma to some of them. Many people with AHCI are asymptomatic, which makes the diagnosis of the disease become difficult while symptomatic patients most commonly show fatigue.
The channels of HCV transmission are primarily dependent on exposure to infected blood,
which incorporate vertical transmission (Owusu‐Ofori et al., 2005), needle stick injuries
(Xia et al., 2008), intravenous drug use (IDU) (Tohme and Holmberg, 2010), sexual behaviors(Jafari et al., 2010) and body piercings (Lam et al., 2010). In developing countries (DCs), HCV is transmitted mainly through contact with infected blood and blood products in healthcare provisions centers. In most developed countries, it results from IDU; it can be a risk source of the transmission in the DCs as well (Aceijas and Rhodes, 2007;Nelson et al., 2011).
We know that numerous antivirals have been clinically tested for therapy of HCV. The trials have revealed that therapy of CHCI with different antivirals results into different SVR rates. For instance, it was formerly treated using conventional interferon alpha that led to the SVR rate of at least 20% of patients after 48 weeks of therapy, which later was improved to the SVR of 38% to 43% of patients using interferon alpha-2b plus ribavirin combination therapy (McHutchison et al., 1998; Poynard et al., 1998). Combination therapy with peginterferon alpha 2a or 2b plus ribavirin combination therapy further improved the SVR rate to approximately 50% of cases (Fried et al., 2002; Muir et al., 2004; Kanda et al., 2010), which has been the standard therapy for CHCI. Unlike AHCI, chronic hepatitis c is associated with a worsening prognosis, which requires more demanding therapy and longer therapy period leading to intolerability owing to developing side effects. Conversely, drugs prescribed for therapy of CHCI can also be assigned to people with AHCVI although interferon-based monotherapy is just sufficient to produce SVR of more than 50% of cases (Jaeckel et al., 2001; Kamal et al., 2006). Monotherapy is far better tolerated due to fewer side effects, relatively cheaper, more suitable and takes shorter time than combination therapies for chronic CHCI (Myers et al., 2001).Hence, therapy of patients with HCV during acute period of infection significantly reduces side effects and disease development to chronic hepatitis(Alberti et al., 2002).
spontaneous clearance of the viruses and the presence of asymptomatic cases (Busch and Shafer, 2005). Spontaneous clearance of the virus can take place either during AHCI (Kamal, 2008) or beyond this period (Grebely et al., 2014).Also, some patients are entirely asymptomatic having normal or slightly elevated serum alanine aminotransferase (ALT) levels despite HCV-RNA positivity after known exposure. Others show acute illness and have high serum ALT levels and noticeable jaundice. Thus, we have considered these challenges in the development of the model, i.e. a patient can either clear the virus spontaneously or not during acute infection.
Certainly, mathematical modeling of viral dynamics with therapy provides us with understanding and quantifying biological processes that govern changes in the viral load and accompanying biomarkers such as ALT levels before and after treatment (Ribeiro et al., 2003).For our case, mathematical models can help to provide answers to biological questions regarding pathogenesis, the dynamics of HCV, immune response and efficacy of drug therapy. Furthermore, we see that modeling HCV dynamics with therapy has deepened our understanding of the virus pathogenesis and guided drug development
(Chatterjee et al., 2012). Various models have been formulated by several researchers in
order to understand the efficacy of drug therapy on the dynamics of HCV. Thus, Neumann et al.(1998) formulated a simple model to investigate the dynamics of HCV during therapy by adopting a model of human immunodeficiency viral infection (Wei et al., 1995; Perelson et al., 1996). The model had a system of three nonlinear differential equations which represented a constant population of target hepatocytes, infected hepatocytes and the virus, and it was used to approximate the rates of viral clearance and loss of infected hepatocytes by fitting to the model the decline of HCV RNA level within infected people in the first 14 days of therapy. Since then modeling of the virus dynamics has been very important in examining the HCV RNA level decay during therapy, which is very well expounded by Perelson (2002) and Perelson et al.(2005). However, it could not include some observed HCV RNA dynamic profiles under therapy, i.e., it assumed that there is no proliferation of target and infected cells and no spontaneous recovery of infected hepatocytes. The extended model of Dahari et al.(2007) incorporated proliferation of target and infected hepatocytes without spontaneous recovery of the infected hepatocytes. A model that includes proliferation and the spontaneous recovery of infected hepatocytes was used to
investigate the dynamics of HCV for primary infection in chimpanzees (Dahari et al.,
2005).Nevertheless, these models do not include the role of immune response on the dynamics of HCV.
blockage of virus replication. We observe that the drug blocking efficacy of virus replication increases with drug dosage (Neumann et al., 1998), where at large values of blocking efficacies the drug does not directly reduce infections i.e. the drug efficacy in reducing infections becomes negligible. Thus, it is required to consider only blockage of the virus replication. In this paper, we extend the model of Ismail et.al, (2016) to investigate the effect of interferon alpha-2b monotherapy on the dynamics of HCV by adopting therapy regimen of Neumann et al.(1998).
2. Model Formulation
In this section, we formulate a deterministic model incorporating three different
populations: hepatocytes population, Hepatitis C virus population and the CD8+ T cells
population. But, we classify the hepatocytes population as susceptible and infected classes whereby the susceptible class is a group of hepatocytes (liver cells) exposed to the HCV infection, and are equally likely to be infected, while the infected class is a group of hepatocytes infected with HCV. Moreover, the HCV population refers to a group of viruses
that is responsible for the infection whereas the CD8+ T cells population is a collection of
T-Lymphocytes of the immune system that is liable for the destruction of the infected hepatocytes. We have extended the model proposed by Ismail, et al. (2016) to include the effect of antiviral monotherapy.
In order to achieve our goal, we make the following assumptions:
(1) The model is formulated to describe the dynamics of HCV and immune system during acute phase of infection; (2) susceptible hepatocytes are equally likely to be infected by the viruses and infected hepatocytes; (3) the susceptible hepatocytes are generated by proliferation of existing hepatocytes and immigration (differentiation of liver cells progenitor or bone marrow cell) at a constant rate; (4) these susceptible hepatocytes and
infected hepatocytes have the same natural mortality rates; (5) the virions and the CD8+ T
cells have different natural death rates; (6) the CD8+ T cells destroy the infected
hepatocytes at a constant rate and die at a constant rate due to infection; (7) the CD8+ T
cells are produced at a constant rate and (8)we assume that the person with HCV infection receives highly dosed interferon alpha-2b monotherapy that blocks viral replication within infected hepatocytes. (9) Also, we assume that the person with HCV infection can either clear the virus spontaneously by a noncytolytic process or not during therapy.
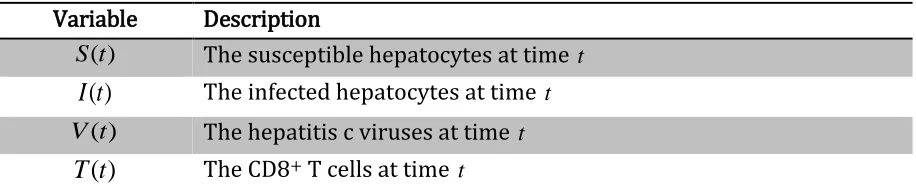
Table 1: State variables and their descriptions
Variable Description
) (t
S The susceptible hepatocytes at time t
)
(t
I
The infected hepatocytes at time t) (t
V The hepatitis c viruses at time t
)
(t
T
The CD8+ T cells at time tFor brevity, we henceforth denote the susceptible hepatocytes sub-population byS; the
infected sub-population byI; HCV viral population by Vand the CD8+ T cells population by
T.The state variables and their descriptions are summarized in Table 1.
Table 2: Parameters and their descriptions
Parameter Description
Per capita infection rate
Per capita production rate of viruses from the infected hepatocytes Rate at which the CD8+ T cells destroy the infected hepatocytes
Per capita production rate of susceptible hepatocytes
g Per capita production rate of the CDB+ T cells
d Per capita natural death rate of susceptible and infected hepatocytes
c Per capita natural death rate of viruses
b Per capita natural death rate of CD8+ T cells
q Rate of spontaneous cure of infected hepatocytes by a noncytolytic
process
Per capita death rate infected hepatocytes due to HCV infection
Fraction by which antiviral drug reduces viral production ratemax
T Maximum CD8+ T cells population level
Healthy hepatocytes Sare constantly produced at the rate and die naturally at a
constant rate d; theScells are infected at the rate that is proportional to the product
SV,with a constant of proportionality
.The infected hepatocytes I have a constantnatural mortality rate of d.The hepatitis C viruses Vare produced from these infected cells
at a constant rate
viruses per infected cell per day, once produced they die naturally atthe rate of c.Then the CD8+ T cells destroy the infected cells I at the rate proportional to
the product I and T, with a constant of proportionality. In the presence of HCV, the
CD8+ T cells are instigated by the CD4+ T cells and constantly supplied at the rate g,and
alpha-2b monotherapy, the drug inhibits virus production from infected hepatocytesI by a fraction
.
2.1 Model Compartment and Dynamics
If we consider the assumptions and the symbols representing the parameters and state variables from Table 1 and Table 2 respectively, we can illustrate the description of the model dynamics in the form of a compartmental diagram as in Figure 1.
Figure 1: Compartmental diagram for the hepatitis C virus model with immune system including drug therapy.
2.2 Equations of the model
Based on the assumptions made and relationships that exist between the state variables shown in Figure 1, we formulate a system of four non-linear ordinary differential equations describing the dynamics of hepatitis c virus in the presence of drug therapy.
dS SV qI dt
dS
(1.1)
qI I dI IT SV dt
dI
(1.2)
cV I dt
dV ) 1
( (1.3)
bT T
T gV
dt
dT
) 1
(
max
(1.4) where the initial conditions areS
0 0,I
0 0, V
0 0and T
0 0I S
T V
I IT
(1-)I cV bT
dS
dI SV
qI
2.3 Basic properties of the model 2.3.1 Invariant regions
Since the system of equations (1.1)-(1.4) describes modeling of susceptible hepatocytes,
infected hepatocytes, HCV and the CD8+ T cells with the effect of drug therapy, we assumed
that all state variables and parameters used in the model are non-negativet 0.
According to Figure 1, we observe that the hepatocytes population has two classes S
t and
tI which can be combined together to formN(t), which denotes the total hepatocytes
population. That is,
N(t)S(t)I(t) (2)
Then we can determine the appropriate feasible region where all state variables are non-negative through the following theorem:
Theorem 1: All forward solutions of the system (1) are contained in the region 4
R ,
0
t and 2 1 1
L V T R R R , where
S I R S I NL
, 2:
1
V V R
1
T T R
and is the positive invariant region for the whole system.
Proof:
We prove the theorem by initially determining the invariant region within which the
solution for each population are feasiblet 0.
Hepatocytes population
We have to determine the invariant region Lof the system (Hepatocytes) containing the
feasible solutionst 0.
Let
2,
L S I R be any solution of the system with non-negative initial conditions..
From (2), we have:
dt dI dt dS dt
dN
(3)
Substituting (1.1) and (1.2) into (3) produces
] [
]
[ qI SV dS SV IT dI I qI
dt dN
NdITI (4) From (4), we have:
Nd dt
dN
dN dt dN
(5)
The general solution of the first order ordinary differential inequality (5) is:
( ) ( 0 )exp( dt) d
N d t
N (6)
where N0 is the initial hepatocytes population size.
From (6), we deduce that
} , max{ )
( 0
d N t
N (7)
Thus, the feasible solutions for the hepatocytes population in the system (1) are positively invariant in the region:
}} , max{ )
( : ) (
{ 0
d N t
N t N
L
HCV population
We have to determine the invariant region Vof the system (HCV) containing feasible
solutionst 0. Let V VR1be any solution with non-negative initial conditions.
Since we know that
From (2) and (7), we deduce that
d t I d N t
I( )max( 0,) ( ) (8)
Substitution of (8) into (1.3) produces
cV d
dt
dV (1)
d cV
dt
dV (1)
(9)
The general solution of the first order ordinary differential inequality (9) is
) exp( ) ) 1 ( ( ) 1 ( )
( 0 ct
cd V
cd t
V (10)
where V0 is the initial viral population size.
From (10), we deduce that
} ) 1 ( , max{ )
( 0
cd V
t
V (11)
}} ) 1 ( , max{ ) ( : ) ( { 0 cd V t V t V V
CD8+ T cells population
We have to determine the invariant region Tof the system (CD8+ T cells) containing
feasible solutionst 0.
Let 1
T T R be any solution with non-negative initial condition
From (11), we deduce that
cd t
V( ) (1) (12)
Substitution of (12) into (1.4) produces:
bT T T cd g dt
dT
) 1 ( ) 1 ( max cd g T b cdT g dt
dT (1) ] ) 1 ( [ max (13)
The general solution of the first order ordinary differential inequality (13) is
] ) ) 1 ( ( exp[ ) ) 1 ( ) 1 ( ( ) 1 ( ) 1 ( ) ( max max max 0 max
max b t
cdT g bcdT g T g T bcdT g T g t
T
(14)
From (14), we deduce that
} ) 1 ( ) 1 ( , max{ ) ( max 0 bcdT g g T t T
Thus, the feasible solutions for the CD8+ T population in the system (1) are positively
invariant in the region:
}} ) 1 ( ) 1 ( , max{ ) ( : ) ( { max 0 bcdT g g T t T t T
T
Thus 2 1 1
L V T R R R , for
} 0 , , max{ ) ( : ) (
{ 0
d d N t N t N L ,
{ ( ): ( ) max{ 0,(1 ) }} cd V t V t V V }} ) 1 ( ) 1 ( , max{ ) ( : ) ( { max 0 bcdT g g T t T t T
T
From this, we conclude that the model system (1) is positively invariant in the region
.Hence it is epidemiologically and mathematically realistic.
Since the system (1) refers to modeling of populations, where all state variables and
parameters are assumed to be non-negativet0, we have to solve each equation in the
system to test for positivity. We achieve this thorough the following theorem:
Theorem 2: If the initial values of a given system are {S(0),I(0),V(0),T(0)R4}0 then
the solution set {(S(t),I(t),V(t),T(t)}consists of positive entitiest0.
Proof:
We test for positivity of each state variable. From (1.3), we have:
cV dt
dV
cdt V
dV
(15)
Integration of (15) produces
K ct
V
ln
That is, V(t)V0exp(ct) (16)
where V0 is the initial viral population size.
From (16), we have:
Att0,exp[c(0)]1.So,V(0)V0 0.If t0,exp[c(t)]0since c0.Thus, we find that
0 ) exp( )
(t V0 ct
V ,t0
From (1.1), we have:
S d V dt
dS
)
(
dt d V S
dS
)
(
(17)
Integration of (17) produces:
K t d V
S ( )
ln
That is, S(t)S0exp[(V(t)d)t] (18)
From (18), we have:
Att0,exp[(V(0)d)(0)]1.So, S(0)S0 0.If t0, thenexp[(V(t)d)t]0since
0 )
(t d V
. Thus, we find thatS(t)S0exp[(Vd)t]0, t0
From (1.4), we have:
T T
bT gV dt
dT
) (
max max
dt T
bT gV T
dT
) (
max max
Integration of (19) produces:
K t T
bT gV
T( )
ln
max max
That is,
] ) (
exp[ )
(
max max
0 t
T bT gV T
t
T (20)
From (20), we have:
Att0, exp[ ( )(0) 1
max
max
T bT gV
.So, T(0)T0 0.Ift0then exp[ ( ) ] 0
max
max
t
T bT gV
since
0
max max
T bT gV
.Thus, we find that ( ) exp[ ( )] 0
max max
0
T bT gV T
t
T ,t0
From (1.2), we have:
I q d T dt
dI
)
(
dt q d T I
dI
)
(
(21) Integration of (21) produces:K t q d T
I ( )
ln
That is,
] ) (
exp[ )
(t I0 T d q t
I (22)
From (22), we have:
Att0,exp[(T(0)d q)(0)]1.So,I(0)I0 0.Ift 0, then exp[(T(t)d q)t]0
since T(t)dq0 Thus, we find that I(t)I0exp[(T dq)]0, t0.
Since the solution set {S(t),I(t),V(t),T(t)}consists of positive entitiest0, we conclude
that the model system (1) is epidemiologically and mathematically realistic(Hethcote, 2000).
3. Model Analysis
In this section, we determine the disease free equilibrium point of the system (1) and the basic reproductive number in the absence of therapy. We also determine the effective reproductive number for the purpose of examining the impact of antiviral therapy on the HCV morbidity.
3.1 Disease Free Equilibrium Point (DFE)
0
qI SV dS (23.1)
0
IT dI I qI
SV
(23.2)
0 )
1
( IcV (23.3)
0 ) 1 ( max bT T T
gV (23.4)
From equations (23.1), (23.3) and (23.4), we obtain
V d qI S
(1)
cV I max max bT gV V gT T (24)
At the disease free equilibrium point,V 0.Then, from (24), we obtain
d d q
S
) 0 ( ) 0 (
(1 ) 0
) 0 ( c
I 0
) 0 ( ) 0 ( max max bT g gT
T (25)
Hence the disease free equilibrium point of the system (1) exists and is given by
) 0 , 0 , 0 , ( 0 d
E (26)
According to (26), the absence of hepatitis c virus implies absence of infected hepatocytes and therefore the CD8+ T cells are not activated to destroy the infected hepatocytes.
3.2 The Basic Reproduction Number,R0
Definition 1:The basic reproduction number ,R0,is defined as the average number of
secondary infections produced when an infected individual is introduced into a host population where all individuals are susceptible in the period of infection (Dietz, 1975; Diekmann et al.; 1990, Van den Driessche and Watmough, 2002).
The basic reproduction number is a very important parameter as it can be used to
determine whether the disease prevails in the community or dies out. IfR0 1, the average
number of new infected individuals produced by an infectious individual is less than one
during its infectious period, implying that the infection cannot grow. Conversely, R0 1
implies that the average number of new infections produced by an infectious individual greater than one, and therefore the disease spreads in the population. It is also very important in the process of analyzing sensitive parameters which drive the dynamics of the disease and stability analysis of the disease free equilibrium.
To determine the basic reproduction number, we find it important to recognize new infections from all other changes in the population. To achieve this, we apply the next generation operator proposed by Van den Driessche and Watmough (2002). Then we
Then in the absence of therapy, we have the system (1) reduced to the system (27) bT T T gV dt dT cV I dt dV qI I dI IT SV dt dI dS SV qI dt dS ) 1 ( max (27)
Let fi(x) be the rate of appearance of new infection in compartmenti,vi (x)
be the rate of
transfer of individuals out of compartmenti and vi (x)
be the rate of transfer of individuals
into of compartmenti by all other means. Furthermore, we assume that each function is
continuously differentiable at least twice in the region.The HCV model system comprises
nonnegative initial conditions with the following equations: ) ( ) ( ) ( ' x y x f x F
xI i i i ,i1,2,...,n
where vi vi vi
Then we consider equations (1.2) and (1.3) of the system (1) to determine the expressions for fiand vias follows:
I SV fi cV I q d T
yi ( )
Let Fbe a non-negative matrixnn and Ybe a non-singular N-matrix
At the disease free equilibrium pointE0, we find that
0 0 ) ( 0 d x E f F j i c q d x E y Y j i 0 0 )
( 0
Then, we have
c q d Y 1 0 0 1 1
We determine the next generation matrix 1
FV developed by Castillo-Chavez et al.(2002)
0 0
1
q d
cd FY
By Van den Driessche and Watmough (2002), the basic reproductive number is a spectral
radius of the next generation matrix 1
FY .Henceforth, to determine the basic reproductive
numberR0, we compute the spectral radius ()of this next generation matrix from
( 1) max( 1, 2)
0
FY
R ,
where 1and 2are the eigenvalues of the next generation matrix 1
FY
Thus, the eigenvalues, lambda, of 1
FY are obtained by
0
1
I
FY
That is, 0
q d
cd
0 ) (
2
q d
cd
Hence the basic reproductive number is given by
) (
0
q d
cd R
(28)
3.3 The Effective Reproduction Number,Re
Definition 2:The effective reproduction number,Re,is the average number of infections
caused by a single infectious individual introduced in a community where intervention strategies (in our case therapy) are administered (Okuonghae and Korobeinikov, 2007; Okuonghae and Aihie, 2008).
We compute the effective reproduction number Reof the system (1) by applying the
method used for R0,where Re is the spectral radius of 1
FY denoted byRe (FY1).Thus
the effective reproduction number is given by
) (
) 1 (
q d
cd
Re
(29)
From (29), we have:
0
) 1
( R
The drug blocking efficacy,
, of viral replication can take any value in the interval 01,whereby its role can be discussed in three sub-intervals: 0,01and 1.When
0
, the result in (30) reduces to the form Re R0,which implies that drug therapy has
no impact on the HCV morbidity. Conversely, if 1, it becomesRe 0, implying that the
disease vanishes due to therapy, i.e. the drug is 100% effective in exterminating the disease. But, any value of
taken from the sub-interval 01 changes it into Re R0.Thisreflects therapy efficacy to reduce the impact of the disease.
4. Numerical Sensitivity Analysis
Mathematical epidemiology is a study that helps in understanding the dynamics of an infection in order to control it by focusing on some sensitive parameters. This can be achieved by performing sensitivity analysis based on the model parameters. The sensitivity
analysis describes how each parameter influencesRe.It helps to identify the most sensitive
parameters. With small variations in the values of the parameters, we can identify the
parameters that highly influenceRewhereby proper control measures can be taken(Chitnis
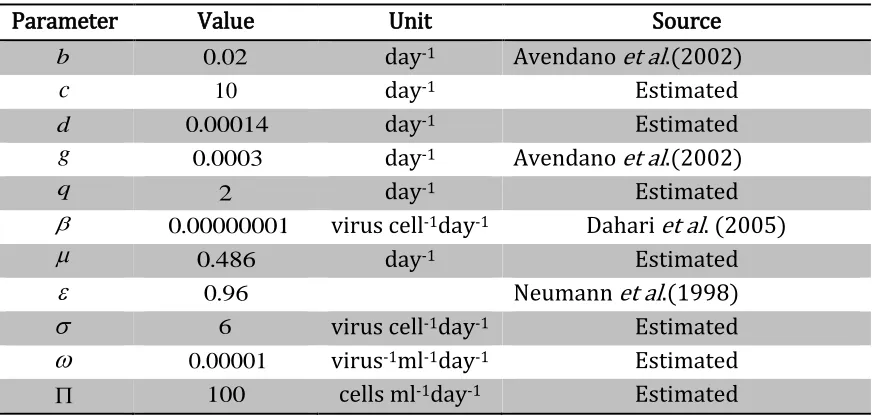
et al., 2008). We accomplish this by computing the sensitivity indices of Rerelating to all parameters in it. In this case, the estimated values of the parameters employed were adopted from some literatures and others were just estimated, which are altogether itemized in Table 3.
Table 3: Estimated values of parameters used to compute sensitivity indices of Re
Parameter Value Unit Source
b 0.02 day-1 Avendano et al.(2002)
c 10 day-1 Estimated
d 0.00014 day-1 Estimated
g 0.0003 day-1 Avendano et al.(2002)
q 2 day-1 Estimated
0.00000001 virus cell-1day-1 Dahari et al. (2005)
0.486 day-1 Estimated
0.96 Neumann et al.(1998)
6 virus cell-1day-1 Estimated
0.00001 virus-1ml-1day-1 EstimatedThe normalized forward sensitivity index refers to the ratio of relative change of a variable to the relative change in a parameter. If the variable is a differentiable function of the parameter then the sensitivity index is defined as follows:
Definition 3: The normalized forward sensitivity index of variable pthat depends on
parameter qis defined as:
p q q p p
q
(31)
Replacing p in (31) byRe, we obtain
e e R
q
R q q R
e
(32)
According to (32), the sensitivity indices of Re are computed with regard to all parameters
in it. This is achieved by replacing q by a parameter to obtain
0000 . 12
e e R
R R
e
, 0.5000
e e R
d
R d d R e
and so on
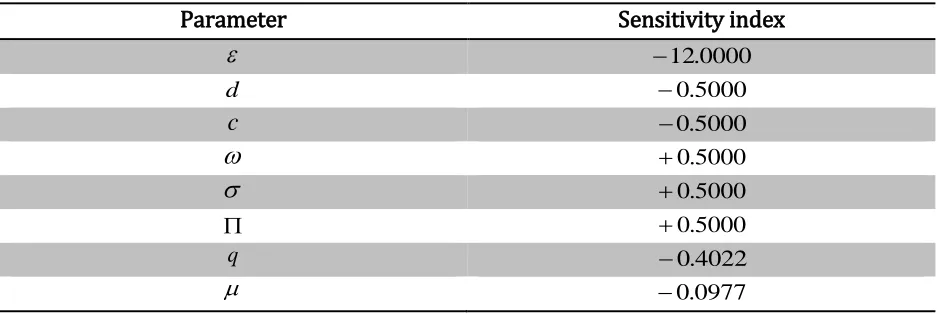
The sensitivity indices of Repertaining to all parameters are computed using the same
approach and then summarized in Table 4.
Table 4: Sensitivity indices of Rerelating to all parameters
Parameter Sensitivity index
12.0000d 0.5000
c 0.5000
0.5000
0.5000 0.5000
q 0.4022
0.0977
According to the sensitivity indices displayed in Table 4, we observe that the parameters for infection rate
, the viral replication rate
and rate of recruitment of susceptiblehepatocytes are the most positively sensitive parameters. This implies that increasing
the values of these parameters will increases Re and vice versa. For example, increasing the
value of
by 20% will increase Reby 10% while decreasing
by 20% will decrease Re byThe drug blocking efficacy of virus replication
, the natural mortality rate of susceptibleand infected hepatocytesdand the natural death rate of the virusc are the most negatively
sensitive parameters. This implies that increasing the values of these parameters will
decrease Reand vice versa. For example, increasing
by 10% will decreaseRe by 120%.Also, we observe that the rate of spontaneous recovery of infected hepatocytes qand the
death rate of infected hepatocytes due to infection are less sensitive negative parameters.
5. Numerical Simulations and Discussion
In this section we present the numerical simulations of the system (1).We performed simulations based on the estimated parametric values itemized in Table 3 and this was accomplished through the application of ode45 MATLAB's standard solver for ordinary differential equations (ODEs), which implements a Runge-Kutta technique with a variable time step for efficient computation. However, this was preceded by the assessment of the values of R0 and Re at0.00001, 6 ,c10, d 0.00014, 0.486, 0.96 and
2
q .We found that0.2626Re R0 1.3129, implying that therapy reduces the HCV
infection in vivo.
According to Fig. 2, the simulation for the basic reproduction numberR0 shows that the
HCV transmission is very high without therapy, regardless of variations of spontaneous
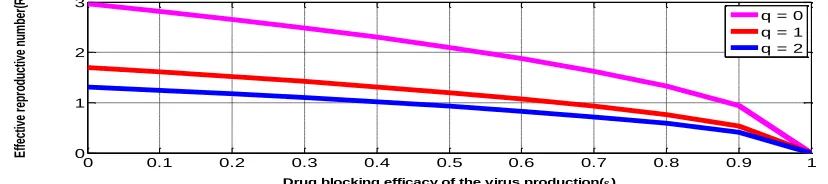
recovery of infected hepatocytesq, for0q2.In Fig.3, the numerical solution of Re
shows four different cases: (1) whenq0and 0, Rehas the highest value, indicating
the increase in the chance of disease evolution to chronic state, implying that patients who do not spontaneously clear the virus and are not subjected to treatment will get chronic
HCV infection in the long run; (2) when q0and 0,Reis still high although decreases
with increasing value of
,implying that patients who do not spontaneously clear the viruswill only clear it through drug therapy. But, the drug will totally eradicate the disease with
increase of blocking efficacy of the virus production; (3) when q0and 0,Reis
relatively low, implying that patients who spontaneously clear the virus and are not subjected to therapy will cure from the disease at different times depending on the rate of
clearanceqand (4) whenq0and 0,Reattains the lowest value and additionally
decreases with increasing values of qand
, implying that patients who spontaneouslyclear the virus and are subjected to therapy will also cure from the disease. The numerical solution based on category 4 shows a very low value ofRe, implying that the disease is
Figure 2: Relative values of reproduction numbers R0and Rewith respect to the rate of
spontaneous recovery of infected hepatocytes(q).
Figure 3: Value of Rewith respect to drug blocking efficacy of the virus production rate() ,
with variation in the rate of spontaneous cure of infected hepatocytes (q0,1,2)
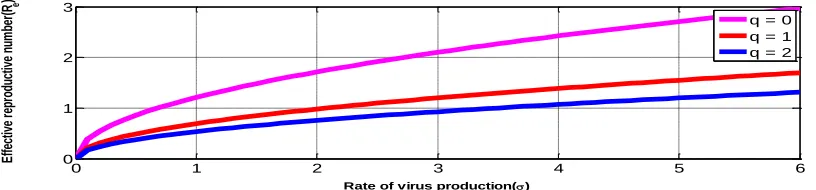
Figure 4: Value of Rewith respect to the rate of virus production rate() , with variation in
the rate of spontaneous cure of infected hepatocytes (q0,1,2) at 0.96
Figure 5: Value of Rewith respect to rate of virus production rate() , with variation in the
rate of spontaneous cure of infected hepatocytes (q0,1,2) at 0.81
0 0.2 0.4 0.6 0.8 1 1.2 1.4 1.6 1.8 2
0 1 2 3
Rate of spontaneous cure of infected hepatocytes(q)
V
al
ue
o
f r
ep
ro
du
ct
iv
e
nu
m
be
r
R0
Re
0 0.1 0.2 0.3 0.4 0.5 0.6 0.7 0.8 0.9 1
0 1 2 3
Drug blocking efficacy of the virus production()
E
ffe
ct
iv
e
re
pr
od
uc
tiv
e
nu
m
be
r(
Re
)
q = 0 q = 1 q = 2
0 1 2 3 4 5 6
0 0.2 0.4 0.6 0.8
Rate of virus production()
E
ffe
ct
iv
e
re
pr
od
uc
tiv
e
nu
m
be
r(
Re
)
q = 0 q = 1 q = 2
0 1 2 3 4 5 6
0 0.5 1 1.5
Rate of virus production()
E
ffe
ct
iv
e
re
pr
od
uc
tiv
e
nu
m
be
r(
R e
)
Figure 6: Value of Rewith respect to the rate of virus production rate() , with variation in
the rate of spontaneous cure of infected hepatocytes (q0,1,2) at 0
Fig.4, Fig.5 and Fig.6 show that the value of Re increases with the rate of virus production
at 0.96, 0.81and 0respectively, and it attains the lowest and greatest values at 2
q and q0 respectively. It also reduces with increasing value of
.This implies thatpatients with different rates of viral production and who do not spontaneously clear the virus can remove it by means of only therapy; this is optimal if the dug blocking efficacy is
approximately 100% (e.g 96%). However patients with higher rates of viral production
(e.g. 2) cure later than those with lower rates (e.g. 1).Conversely, patients who
spontaneously clear the virus will do it faster with therapy. It will vanish in a short time if the drug is highly effective. Practically, therapy is necessary and so should be directed to only patients who do not spontaneously clear the virus.
6. Conclusion
In this paper, we have formulated a deterministic mathematical model on the dynamics of HCV and immune system with the effect of therapy in the acute phase of infection. We have shown that the numerical solution of the basic and effective reproductive number obtained validate that therapy has significant impact on the disease transmission, which implies that therapy reduces the number of secondary infections produced by an infectious hepatocyte during its infectious period, i.e. fewer hepatocytes are infected. From the sensitivity analysis, the parameter for the drug blocking efficacy is the most negatively sensitive parameter while the parameters for the rates of infections, virus production and recruitment of susceptible hepatocytes and mortality rate due to infection are the most positively sensitive ones. Thus, if the blocking drug efficacy of the virus production increases there is reduction of disease transmission, and eventually it dies out.
Literatures reveal that therapy of acute HCV infection is associated with challenges such as unclear criteria of identification of patients who require therapy (to exclude those who are able to spontaneously clear the virus), initiation of therapy and therapy regimens. Available drugs for therapy of chronic infection have severe side effects due to combination therapies. Nevertheless, therapy of people with acute HCV infection is necessary to prevent
0 1 2 3 4 5 6
0 1 2 3
Rate of virus production()
E
ffe
ct
iv
e
re
pr
od
uc
tiv
e
nu
m
be
r(
Re
)
evolution of the disease to chronicity, which is a fatal period of infection. Current models describing the dynamics of HCV with therapy do not consider drug types, variation of blocking efficacy with dosage and the virus genotype concurrently. For example, individuals with genotype 1 and 4 HCV infections do not respond to most antivirals while those infected with genotype 2 and 3 HCV respond quite well to these antivirals, and therefore the mathematical models are only descriptive of the dynamics of HCV with therapy for the second category of patients. Hence, more mathematical models are needed to address all these anomalies concurrently. However, our model assumes that the drug blocking efficacy of virus production increases with drug dosage administered to a patient who is a responder to the drug and can either clear the virus spontaneously or not.
Hence we recommend that more mathematical models should be formulated to describe viral dynamic profiles observed when new antiviral drugs are employed, test possible mechanisms for new biological or clinical phenomena and optimize therapy such as determining optimal drug dosages and therapy duration. The models should be used to give additional insight into the HCV pathogenesis and assist in the development of more effective therapeutic strategies. The virus genotype should be considered when modeling the HCV dynamics and immune system with therapy, as the current mathematical models assume that all patients are good responders to the available antivirals. Also, they should consider the dynamics of HCV in a patient with a graft organ such as kidney, liver or heart. Modeling the dynamics of HCV and immune system with drug therapy can be done to include co-infections such as HCV-HIV co-infection.
Acknowledgement
I, Seleman Ismail, would like to express my gratitude to the Nelson Mandela African Institution of Science and Technology for financial support and the Open University of Tanzania for granting me a study leave.
REFERENCES
[1] Aceijas, C.and Rhodes, T. (2007). Global estimates of prevalence of HCV infection among injecting drug users. International Journal of Drug Policy. 18(5): 352-358.
[2] Alberti, A., Boccato, S., Vario, A.and Benvegnù, L. (2002). Therapy of acute hepatitis C. Hepatology. 36(S1):1995-2000.
[3] Busch, M. P.and Shafer, K. a. P. (2005). Acute-phase hepatitis C virus infection: implications for research, diagnosis, and treatment. Clinical Infectious Diseases. 40(7): 959-961.
[4] Castillo-Chavez, C., Feng, Z.and Huang, W. (2002). On the computational of R0 and its role of global stability. Mathematical approaches for emerging and reemerging infectious diseases: models, methods and theory, Editors: C. Castillo-Chavez, S. Blower, P. van den Driessche, D. Kirschner, and A. A. Yakubu, Springer.
[6] Chitnis, N., Hyman, J. M.and Cushing, J. M. (2008). Determining important parameters in the spread of malaria through the sensitivity analysis of a mathematical model. Bulletin of mathematical biology. 70(5): 1272-1296.
[7] Colina, R., Azambuja, C., Uriarte, R., Mogdasy, C.and Cristina, J. (1999). Evidence of increasing diversification of hepatitis C viruses. Journal of general virology. 80(6): 1377-1382.
[8] Dahari, H., Major, M., Zhang, X., Mihalik, K., Rice, C. M., Perelson, A. S., Feinstone, S. M.and Neumann, A. U. (2005). Mathematical modeling of primary hepatitis C infection: noncytolytic clearance and early blockage of virion production. Gastroenterology. 128(4): 1056-1066.
[9] Dahari, H., Ribeiro, R. M.and Perelson, A. S. (2007). Triphasic decline of hepatitis C virus RNA during antiviral therapy. Hepatology. 46(1): 16-21.
[10]Diekmann, O., Heesterbeek, J.and Metz, J. A. (1990). On the definition and the computation of the basic reproduction ratio R 0 in models for infectious diseases in heterogeneous populations. Journal of mathematical biology. 28(4): 365-382.
[11]Dietz, K. (1975). Transmission and control of arbovirus diseases. Epidemiology. 104-121.
[12]Fried, M. W., Shiffman, M. L., Reddy, K. R., Smith, C., Marinos, G., Gonçales Jr, F. L., Häussinger, D., Diago, M., Carosi, G.and Dhumeaux, D. (2002). Peginterferon alfa-2a plus ribavirin for chronic hepatitis C virus infection. New England Journal of Medicine. 347(13): 975-982.
[13]Grebely, J., Page, K., Sacks‐Davis, R., Loeff, M. S., Rice, T. M., Bruneau, J., Morris, M. D., Hajarizadeh, B., Amin, J.and Cox, A. L. (2014). The effects of female sex, viral genotype, and IL28B genotype on spontaneous clearance of acute hepatitis C virus infection. Hepatology. 59(1): 109-120.
[14]Hethcote, H. W. (2000). The mathematics of infectious diseases. SIAM review. 42(4): 599-653.
[15]Ismail,S.,Luboobi,L.S.and Nkansah-Gyekye,Y.(2016).Modeling the dynamics of Hepatitis Virus and Immune System during Acute Infection.Journal of Mathematical Theory and Modeling.6(6):111-134. [16]Jaeckel, E., Cornberg, M., Wedemeyer, H., Santantonio, T., Mayer, J., Zankel, M., Pastore, G., Dietrich, M.,
Trautwein, C.and Manns, M. P. (2001). Treatment of acute hepatitis C with interferon alfa-2b. New England Journal of Medicine. 345(20): 1452-1457.
[17]Jafari, S., Copes, R., Baharlou, S., Etminan, M.and Buxton, J. (2010). Tattooing and the risk of transmission of hepatitis C: a systematic review and meta-analysis. International journal of infectious diseases. 14(11): e928-e940.
[18]Kamal, S. M. (2008). Acute hepatitis C: a systematic review. The American journal of gastroenterology. 103(5): 1283-1297.
[19]Kamal, S. M., Moustafa, K. N., Chen, J., Fehr, J., Moneim, A. A., Khalifa, K. E., El Gohary, L. A., Ramy, A. H., Madwar, M. A.and Rasenack, J. (2006). Duration of peginterferon therapy in acute hepatitis C: a randomized trial. Hepatology. 43(5): 923-931.
[20]Kanda, T., Imazeki, F.and Yokosuka, O. (2010). New antiviral therapies for chronic hepatitis C. Hepatology international. 4(3): 548-561.
[21]Lam, N., Gotsch, P. B.and Langan, R. C. (2010). Caring for pregnant women and newborns with hepatitis B or C. Am Fam Physician. 82(10): 1225-9.
[22]Lavanchy, D. (2009). The global burden of hepatitis C. Liver International. 29(s1): 74-81.
[23]Mchutchison, J. G., Gordon, S. C., Schiff, E. R., Shiffman, M. L., Lee, W. M., Rustgi, V. K., Goodman, Z. D., Ling, M.-H., Cort, S.and Albrecht, J. K. (1998). Interferon alfa-2b alone or in combination with ribavirin as initial treatment for chronic hepatitis C. New England Journal of Medicine. 339(21): 1485-1492.
[25]Myers, R. P., Regimbeau, C., Thevenot, T., Leroy, V., Mathurin, P., Opolon, P., Zarski, J. P.and Poynard, T. (2001). Interferon for acute hepatitis C. Cochrane Database Syst Rev. 4(
[26]Nelson, P. K., Mathers, B. M., Cowie, B., Hagan, H., Des Jarlais, D., Horyniak, D.and Degenhardt, L. (2011). Global epidemiology of hepatitis B and hepatitis C in people who inject drugs: results of systematic reviews. The Lancet. 378(9791): 571-583.
[27]Neumann, A. U., Lam, N. P., Dahari, H., Gretch, D. R., Wiley, T. E., Layden, T. J.and Perelson, A. S. (1998). Hepatitis C viral dynamics in vivo and the antiviral efficacy of interferon-α therapy. Science. 282(5386): 103-107.
[28]Okuonghae, D.and Aihie, V. (2008). Case detection and direct observation therapy strategy (DOTS) in Nigeria: its effect on TB dynamics. Journal of Biological Systems. 16(01): 1-31.
[29]Okuonghae, D.and Korobeinikov, A. (2007). Dynamics of tuberculosis: the effect of direct observation therapy strategy (DOTS) in Nigeria. Mathematical modelling of natural phenomena. 2(1): 113-128. [30]Owusu‐Ofori, S., Temple, J., Sarkodie, F., Anokwa, M., Candotti, D.and Allain, J. P. (2005). Predonation
screening of blood donors with rapid tests: implementation and efficacy of a novel approach to blood safety in resource‐poor settings. Transfusion. 45(2): 133-140.
[31]Perelson, A. S. (2002). Modelling viral and immune system dynamics. Nature Reviews Immunology. 2(1): 28-36.
[32]Perelson, A. S., Herrmann, E., Micol, F.and Zeuzem, S. (2005). New kinetic models for the hepatitis C virus. Hepatology. 42(4): 749-754.
[33]Perelson, A. S., Neumann, A. U., Markowitz, M., Leonard, J. M.and Ho, D. D. (1996). HIV-1 dynamics in vivo: virion clearance rate, infected cell life-span, and viral generation time. Science. 271(5255): 1582-1586. [34]Poynard, T., Marcellin, P., Lee, S. S., Niederau, C., Minuk, G. S., Ideo, G., Bain, V., Heathcote, J., Zeuzem,
S.and Trepo, C. (1998). Randomised trial of interferon α2b plus ribavirin for 48 weeks or for 24 weeks versus interferon α2b plus placebo for 48 weeks for treatment of chronic infection with hepatitis C virus.
The Lancet. 352(9138): 1426-1432.
[35]Ribeiro, R. M., Layden‐Almer, J., Powers, K. A., Layden, T. J.and Perelson, A. S. (2003). Dynamics of alanine aminotransferase during hepatitis C virus treatment. Hepatology. 38(2): 509-517.
[36]Ismail, S., Luboobi, S. L.,Gyekye,Y.N. (2016). Modeling the Dynamics of Hepatitis C Virus and Immune System during Acute Infection. Journal of Mathematical Theory and Modeling. 6(6): 111-134.
[37]Taxonomy, V. 2005. VIIIth Report of the International Committee on Taxonomy of Viruses Edited by: Fauquet CM, Mayo MA, Maniloff J, Desselberger U, Ball LA. Elsevier, Amsterdam-Boston.
[38]Tohme, R. A.and Holmberg, S. D. (2010). Is sexual contact a major mode of hepatitis C virus transmission? Hepatology. 52(4): 1497-1505.
[39]Van Den Driessche, P.and Watmough, J. (2002). Reproduction numbers and sub-threshold endemic equilibria for compartmental models of disease transmission. Mathematical biosciences. 180(1): 29-48. [40]Wei, X., Ghosh, S. K., Taylor, M. E., Johnson, V. A., Emini, E. A., Deutsch, P., Lifson, J. D., Bonhoeffer, S.,
Nowak, M. A.and Hahn, B. H. (1995). Viral dynamics in human immunodeficiency virus type 1 infection. Nature. 373(6510): 117-122.
[41]Xia, X., Luo, J., Bai, J.and Yu, R. (2008). Epidemiology of hepatitis C virus infection among injection drug users in China: systematic review and meta-analysis. Public health. 122(10): 990-1003.
1SCHOOL OF COMPUTATIONAL AND COMMUNICATION SCIENCE AND ENGINEERING,NELSON MANDELA
AFRICAN INSTITUTION OF SCIENCE AND TECHNOLOGY,P.O.BOX 447,ARUSHA,TANZANIA