International Journal of Advances in Management, Economics and Entrepreneurship
Available online at: www.ijamee.info
RESEARCH ARTICLE
Factors Affecting Consumers' Demands on Local Products
Produced from Different Varieties: Red Pepper (Isot) Sampling,
Şanlıurfa-Turkey
Mustafa Hakki Aydogdu
1*, Ahmet Ferit Atasoy
2, Hatice Parlakci Dogan
1,
Mehmet Emre Eren
3, Gonul Sevinc
1, Nihat Kucuk
4, Ali Riza Manci
51. Department of Agricultural Economics, Faculty of Agriculture, Harran University, Sanliurfa-Turkey.
2. Department of Food Engineering, Engineering Faculty, Harran University, Sanliurfa-Turkey.
3. School of Foreign Languages, Harran University, Sanliurfa-Turkey.
4. Economic Policy Department, Faculty of Economics and Administrative Sciences, Harran University,
Sanliurfa-Turkey.
5. School of Tourism and Hotel Management, Harran University, Sanliurfa-Turkey.
*Corresponding Author: Email:[email protected]
Abstract: It is aimed to determine the factors affecting consumers' demands on different varieties of isot pepper which is a kind of a traditional local spice with natural features and produced from red pepper in Sanliurfa-Turkey. The material comes from the surveys through face-to-face interviews were conducted in 2017 with a simple random sampling method at 95% confidence level by 1,040 consumers. Likert attitude scale, one-way analysis of variance and the likelihood-ratio test were used in the analyses. The results indicate that the most important reason for usage of different varieties is distinctive flavor and followed by to adjust the degree of bitterness. Consumers provide their 23.86% of annual consumption amounts from different varieties that is used as food culture and traditional taste by 84.7%. The place where the isot pepper is produced and food safety certificate were defined as important factors for preferences of the consumers. The average willingness to pay is calculated as 32.85 TL/kg. There is a statistically significant relationship exist between gender, education, income, profession, purchase and consumption amount and price. It is necessary to increase the usage quantities and areas of different varieties. Therefore, more efficient and widespread marketing channels should be determined and used for different varieties of isot pepper based on consumers’ demand. Product diversification could also be effective on the consumption amount and price which will positively affect both consumers and producers. This research is one of the first studies on this subject and it provides useful information to producers, sector representatives, and policy and decision makers. Keywords: Agricultural traditional products, Consumers’ preferences, Different varieties, GAP-Şanlıurfa, Isot Pepper, Turkey.
Article Received: 30 Sept. 2018 Revised: 10 Oct. 2018 Accepted: 22 Oct. 2018
Abstract
Introduction
Pepper is a cultivar group of the species Capsicum annuum L. which has varieties produce fruits in different colors such as red, green, orange, and yellow, but mostly red is preferred. Red pepper can be grown in many parts of the world and in different climatic conditions that is very beneficial for health with its rich nutritional values which are low in calories and a powerful antioxidant [1]. Red peppers are extremely versatile in terms of usage areas especially in vegetables. Red pepper is the second vegetable of the world
The amount of red pepper production in Turkey was 204.131 tons in 2015 and about 78% of which is produced in the border of the provinces located in the southeastern Anatolia Project, GAP, it is Turkish acronym. [5,6]. The GAP is the largest regional development projects based on water and land resources in Turkey. Within the scope of GAP, 1.8 million hectares of agricultural land is intended to be irrigated and an area of 450 thousand hectares is currently being irrigated [7].
Almost, 60% of the red peppers productions in the GAP region are grown in Şanlıurfa. Another reason that makes this vegetable a critical product for Şanlıurfa is isot pepper, which is a spice. Isot is a finely ground mixture of dried red peppers produced from different varieties that offer lots of natural flavor to dishes. Isot, which was first used only for personal private consumption, has now become an important source of income for family groups with low economic levels, especially for women.
Recently, consumers have begun to tend to traditional products with more natural characteristics. This trend has made it possible for Şanlıurfa isot pepper to become a product that can be marketable in national and/or international markets. Şanlıurfa is located within the GAP project that is one of the important cities in terms of crop production values are produced depending on the size of agricultural land in Turkey. Şanlıurfa, along with the GAP project, shows increases in crop production amounts and values. One of these products is fresh red pepper. Therefore, while the production of red pepper (spicy and raw) was 23,321 tons in 2005 and become 101,401 tons in 2016 in Şanlıurfa [8].
In other words, the production amount was increased 4.4 times within 11 years. Red pepper has been consumed both as fresh and as a spice for a long time. The isot pepper is produced as a spice either by fabrication or traditionally from fresh red pepper under the sun with some special natural treatments, either in red or black colors in Şanlıurfa [9]. But nowadays it is used more as a spice due to its unique characteristics, isot peppers have recently begun to gain more share in the domestic and international markets. In this case, traditional isot production is an important source of income and employment.
In this respect, traditional products accelerate the development of rural areas together with low income groups. Hence, it is important to reveal local products and its features and the branding of regional special products became important. Increasing the value added of such products contributes to the creation of new revenue generating business fields.
Therefore, such projects, researches and studies are supported by many countries. Among the most important reasons for the use of different varieties of fresh red peppers in production is that inability to find continuously the same variety and it is also aimed to provide presentations with differentiation in flavor, bitterness, odor and color depending on the consumer demands. Product diversity is a long-debated matter in economics and try to find the answers to the questions of the extent to which the market can provide diversity and why this diversity is necessary [10].
Product diversity could have an effect on both the purchase amount and the price paid in consumer preferences. Consumers search for the low price and/or the products that match their taste and preferences before purchasing [11]. It is aimed to reveal the factors which are effective in consumers’ preference buying the isot peppers which is produced from different red pepper varieties by this research.
Material and Methods
The main material of this research comes from the data which is obtained from consumers who were residing in Şanlıurfa. As of the end of 2016, the population of Şanlıurfa was 1,940,627 and the population is increased by 2.25% as compared to the previous year and of which 50.4% are male [12]. The sampling volume was determined using Yamane's formula, based on main sampling volume and tolerable sampling error [13].
incomes, education and living levels of the city through simple random sampling method in 2017. Likert attitude and perception scale, one-way analysis of variance (ANOVA) and the likelihood-ratio test were used in the analysis of the data in SPSS. The main approach in the Likert attitude and perception scale is to give the participants relevant judgments (isot pepper from different varieties) and to find out which participants are concentrated on these judgments.
When using this scale, the judicial sentences are given to the participants’ in order and it is asked to indicate the degree of participation by marking the option that appears appropriate to him/her in each case.
At the end of the research, the numerical distribution of the degree of participation of the individuals in the group is determined. These values are taken as the option value of the group and the effect of the judiciary on the attitude is determined. In general, the reliability coefficient is accepted as 85% [15]. ANOVA is used to calculate the significance of the difference between three or more independent means in a normalized series.
ANOVA compares cumulatively the
arithmetic mean of three or more groups alone; ANOVA result is significant when at least one is significant [16].
The Likelihood-Ratio test is a hypothesis test used for comparing the goodness of fit of two statistical models that helps to choose the best model between two models that means that one is a special case of the other. Finding the maximum value of a function generally involves taking a derivative of a function and solving the maximized parameter, which is easier if the maximized function is a log-likelihood instead of the original likelihood function [17].
The statistical reliability of the data set is measured by the Cronbach alpha coefficient.
Cronbach’s Alpha measures internal
consistency, which provides information about the reliability of a multi-item scale. Values exceeding 0.6 indicate internal consistent scales, in other words, all items incorporated in the scale measure the same underlying construct [18, 19]. The Cronbach's Alpha coefficient from data set found as 0.71
and interclass correlation coefficient
significance of F test with true value was
measured as p<0.01 that indicates this research is reliable.
Results and Discussions
Consumers constitute the demand side in the market and directly influence supply side. The descriptive statistics of the research is given in Table 1. The 57.9% of the respondents are male, and the average age of the participants is 33.2 years. The level of education of the participants was 54.3%, high school and less graduates, while the ratio of graduates of master/Ph.D. was only 3.2 %.
The average monthly income of the participants was calculated as 2,206 TL (Turkish Liras, The average value of 1 USD= 3.65 TL for 2017), [20]. Participants' monthly average income is 36.3% from the lower income group (TL 1,500 and less), while 7.6% is from the upper income group (TL 4,501 and above). The 28.7% of the participants are public employees and 32.5% are unemployed, not working which are also contains housewives, students as well as seasonal and temporary workers in this group. The average number of households was 5.29 person.
The average annual consumption amount was 14.84 kg/year. The annual consumption
per capita was calculated as 2.81
kg/person/year and 0.234 kg/person/month. Black color (dark purple) is the most preferred consumption color with 46.5%. On the other hand, 26.2% of consumers do not see color as a reason for preference. The consumers are predominantly making dried red pepper (isot) themselves at home, while the proportion of ready-made purchase was 19% and the rate of those giving an order was 6%. Some of the consumers are also doing it at home, making it through order, and taking it from readymade ones.
The proportion of those who procure the isot pepper needs of the consumers at one time per annum is 73.7% and the proportion of the purchasers when needed is 26.3%. Isot pepper is a useful product that is seasonally produced but consumed throughout the year. Consumers tend to supply the annual isot pepper needs once in a while. This result is compatible with both local and cultural
characteristics and with pre-research
transaction is one kilogram or more, while the purchase amount made under 500 gr was 12.8%. These results are consistent with how isot pepper needs obtained. Consumers have higher purchasing amounts because they provide the annual needs at once. Smaller weighted purchases are usually provided when needed, which is 24.9%, this result is consistent with 26.3% of buyers when there is a need.
Consumers are purchasing isot pepper on the basis of confidence from known people by 59.6% which is consistent by expectations. Consumers prefer isot pepper to be purchased from open bag by 59.6%, while percentage of closed-box and a packaged purchase is 18.6%. Consumers use isot pepper as food culture and traditional taste by 84.7%.
These are groups that usually provide their annual needs once. Those who use it as a spice are the ones who buy with small weights when needed. Consumer behavior is very complicated due to each consumer has
different consideration, expectation,
perception and attitude towards purchase and consumption of a product [21].
The consumers are asked about what they pay attention to when purchasing traditional isot pepper, and they are asked to sort by giving 6 points to the most important and 1 point to the least important. According to the results obtained, the most important reasons for selection were determined as the place where the isot pepper was produced by 70.4%, the price by 64.3%, the food safety certificate by 63.3%, the place where isot pepper was sold by 60.7%, the brand by 56.7%, and the packaging by 42.5%.
These results are consistent with the other results obtained from this research. According to these results, production place is the most important reason and it is related to trust and quality of isot pepper at the same time. Price is an important factor in consumer preferences. These results are meaningful and consistent, since the purchase of traditional isot pepper is usually provided from familiar places and known peoples, therefore branding and packing have less importance at decision of the consumers.
It was stated that the location (origin), taste, quality, appearance, price, naturalness and
availability are important factors in the consumption of traditional foods [22]. Table 2 shows the average significance scores over six
of the factors influencing consumer
preferences. The 70% of the consumers prefer one or same type when buying or doing isot, in other words 30% of them prefers different varieties.
Consumers' reasons for using different varieties of isot pepper are determined as for flavor by 57%, to adjust the degree of bitterness by 24%, due to difficulties to get same and one variety by 9%, for 4% odor, due to the appearance by 4% and at the price by 2%. Consumers provide 23.86% of annual
consumption amounts from different
varieties.
In other words, consumers average 3.50 kilograms of annual consumption of isot pepper is composed of different varieties of isot pepper. It has been found that consumers have a willingness to pay a minimum of 10 TL/kg and a maximum of 60 TL/kg to a good-quality isot pepper. The average willingness to pay of the consumers was calculated as 32.85 TL/kg.
It was concluded in an another research with isot pepper producers’ in the same area that the expected average price for the high quality isot pepper of producers demanded was 36.04 TL/kg and the average expectation price in the weight of a normal quality isot pepper was 21.38 TL/kg [23].
The results based on the price obtained from the producers and the consumers are consistent due to willingness to pay and willingness to sell. There is a price difference of 3.19 TL/kg between the supply price requested by the producers and the demand price requested by the consumers. That is, the producer expectation price is 8.9% higher than the price that the consumer is willingness to pay.
results obtained from the participants, the most important reason of consumers' use of different varieties of isot pepper is 85.5% with respect to flavor. This factor followed by 75.4% in order to adjust the degree of bitterness, related to the price of different varieties used by 72.3%, related to the variety of isot pepper present in the market by 64.8% and the obtained amount of isot-pepper is different from each variety by 60.4%, respectively. These results are consistent with the results obtained from the producers [23].
In a survey conducted with European consumers, it has been determined that consumers perceive traditional foods as products of good quality, well-known with a good flavor [24]. Another study conducted with consumers was determined that 92% of the respondents perceived traditional foods as much delicious then the others in Turkey [25]. Table 3 shows the average of participation rates of the factors that may be effective in the consumption of different varieties of isot pepper by consumers out of five points.
Price is defined as the money someone charges for a good/service and what the consumer is willing to give up to receive a good/service which is the easiest marketing variable to change and the perception of price differs based on the perspective from which it is being viewed by the consumers [26]. For the consumers, the price effects are chosen as
the dependent variable. Consumption
amount, consumer income, gender, age,
number of households, amount of
consumption and education were chosen as independent variables that could affect the dependent variable.
Regression and Anova tests were applied to determine the effects of the independent variables on the dependent variable. The values of the Anova test are given in Table 4. According to the test results, there is a statistically significant relationship between the dependent variable and the set of
independent variables. The level of
significance of this relationship is at the level of p <1%. The relationship between each variable that constitutes the independent variable set is related to the price which is the dependent variable is given in Table 5.
There is a statistically significant
relationship between gender and price
according to the data in Table 5, which is of the order of p<5% significance. It was found that there are gender-related differences in consumption of traditional products [27].
There is a statistically significant
relationship between income and price, with a p<1% significance. There is a statistically significant relationship between the quantity of consumption and the price, which is at a p <1% significance level. There is a significant statistical relationship between the amount of the purchasing and price, with a p <5% significance level.
On the other hand, there is no statistical significance between age, education and the number of households and the price. At this time, the choices of why consumers use different varieties of isot pepper are taken as dependent variable. According to the results obtained from the frequency analyzes, the answers given to this option were gathered in three main reasons and new groups were formed.
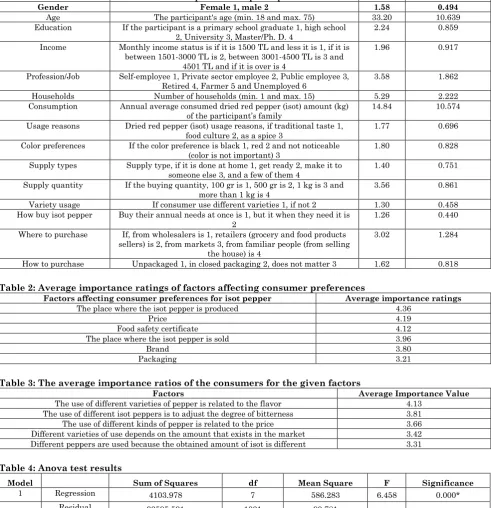
These groups are due to flavor, for adjusting the degree of bitterness and others outside of them. Likelihood ratio test was applied by preserving the same independent variables in the price as well as profession/job variable is added and nominal regression test was performed. The model data compliance results are given in Table 6. Accordingly, statistical significance level between the model and variables that is p <1% of significance level.
The probability likelihood ratio test results are shown in Table 7. According to the results of Table 7, there is a statistically significant relationship between the use of varieties and education, income and the amount of consumption.
Table 1: Descriptive statistics of the participants
Title Descriptions of the participants Mean Std. Deviation
Gender Female 1, male 2 1.58 0.494
Age The participant's age (min. 18 and max. 75) 33.20 10.639
Education If the participant is a primary school graduate 1, high school 2, University 3, Master/Ph. D. 4
2.24 0.859
Income Monthly income status is if it is 1500 TL and less it is 1, if it is between 1501-3000 TL is 2, between 3001-4500 TL is 3 and
4501 TL and if it is over is 4
1.96 0.917
Profession/Job Self-employee 1, Private sector employee 2, Public employee 3,
Retired 4, Farmer 5 and Unemployed 6 3.58 1.862
Households Number of households (min. 1 and max. 15) 5.29 2.222
Consumption Annual average consumed dried red pepper (isot) amount (kg)
of the participant’s family 14.84 10.574
Usage reasons Dried red pepper (isot) usage reasons, if traditional taste 1, food culture 2, as a spice 3
1.77 0.696
Color preferences If the color preference is black 1, red 2 and not noticeable
(color is not important) 3 1.80 0.828
Supply types Supply type, if it is done at home 1, get ready 2, make it to
someone else 3, and a few of them 4 1.40 0.751
Supply quantity If the buying quantity, 100 gr is 1, 500 gr is 2, 1 kg is 3 and more than 1 kg is 4
3.56 0.861
Variety usage If consumer use different varieties 1, if not 2 1.30 0.458
How buy isot pepper Buy their annual needs at once is 1, but it when they need it is 2
1.26 0.440
Where to purchase If, from wholesalers is 1, retailers (grocery and food products sellers) is 2, from markets 3, from familiar people (from selling
the house) is 4
3.02 1.284
How to purchase Unpackaged 1, in closed packaging 2, does not matter 3 1.62 0.818
Table 2: Average importance ratings of factors affecting consumer preferences
Factors affecting consumer preferences for isot pepper Average importance ratings
The place where the isot pepper is produced 4.36
Price 4.19
Food safety certificate 4.12
The place where the isot pepper is sold 3.96
Brand 3.80
Packaging 3.21
Table 3: The average importance ratios of the consumers for the given factors
Factors Average Importance Value
The use of different varieties of pepper is related to the flavor 4.13
The use of different isot peppers is to adjust the degree of bitterness 3.81
The use of different kinds of pepper is related to the price 3.66
Different varieties of use depends on the amount that exists in the market 3.42 Different peppers are used because the obtained amount of isot is different 3.31
Table 4: Anova test results
Model Sum of Squares df Mean Square F Significance
1 Regression 4103.978 7 586.283 6.458 0.000*
Residual 93595.591 1031 90.781
Total 97699.569 1038
*Statistically significant at a level of less than 1%
Table 5: Model coefficients of independent variables depending on dependent variable (price)
Model
Unstandardized Coefficients
Standardized Coefficients
t Sig.
B Std. Error Beta
1 (Constant) 28.180 2.183 12.906 0.000*
Gender -1.560 0.619 -0.079 -2.520 0.012**
Age 0.003 0.032 0.004 0.110 0.912
Education -0.404 0.439 -0.036 -0.921 0.357
Income
1.764 0.367 0.167 4.811 0.000*
Household number -0.093 0.156 -0.021 -0.597 0.551
Consumption amount 0.087 0.033 0.095 2.638 0.008*
Purchase amount 0.899 0.353 0.080 2.548 0.011**
Table 6: Model data set compliance results
Model Model Fitting Criteria Likelihood Ratio Tests
-2 Log Likelihood Chi-Square df Sig.
Intercept Only 2025.884
Final 1962.136 63.749 28 0.000*
*statistically significant at a level of p<1%.
Table 7: Likelihood ratio test results of the model
Effect Model Fitting Criteria Likelihood Ratio Tests -2 Log Likelihood of Reduced
Model Chi-Square df Sig.
Intercept 1962,136(a) 0,000 0 .
Age 1962,244 0,109 2 0,947
Education 1977,906 15,770 2 0,000*
Income 1977,469 15,333 2 0,000*
Household number 1963,969 1,834 2 0,400
Consumption amount 1969,321 7,185 2 0,028**
Purchase amount 1963,800 1,664 2 0,435
Gender 1962,658 0,522 2 0,770
Profession/job 1976,269 14,733 10 0,077***
Why use of different variety 1966,638 4,502 4 0,342
Conclusion
Şanlıurfa is one of the most important cities due to having agricultural land in terms of size and crop production value generated accordingly in GAP-Turkey. However, the national income per capita of Sanliurfa is far below the average of Turkey. One of the reasons for this situation is that the increases in the value of crop production cannot be transformed into higher value added products by being coordinated in traditional products in agriculture and marketing.
Red pepper cultivation has an important potential as an alternative crop at agriculture in Sanliurfa which has different varieties. For this reason, there is a need of research projects that can provide more added value by effectively using the opportunities related to agricultural products with different varieties, traditional and local potential (such as isot pepper), inequality in
income distribution, poverty and
unemployment.
By using local and traditional products (such as isot pepper), research towards ensuring development in rural areas through the mobilization of local dynamics could give positive results. With increasing numbers of
technology-intensive and counterfeit
products, there are problems in producing, promoting and marketing products with traditional features [29]. In this research,
consumers' perceptions, views and
expectations were determined in order to spread the use of different varieties of the traditional product that is the isot pepper.
Sanliurfa isot pepper is a product with geographical indication feature and 30% of consumers prefer isot peppers obtained from different varieties. Consumers provide 23.86% of the annual consumption of isot pepper in different varieties. The most important reasons affecting preference of different varieties of isot pepper were determined as place of production, price, and food safety certificate, place of sale, brand and packaging, respectively.
The average willingness to pay for a good quality isot pepper made from different varieties of consumers was calculated as 32.85 TL/kg. There was a statistically significant relationship between price and gender, consumption amount, income and amount of purchase. In another study conducted in Turkey, gender, education level, monthly income and place of residence have been identified as effective factors on the consumers prefer the traditional products [30].
In this respect, researches and projects that contribute to the creation of income-generating new business areas for identifying local products and properties, branding local special products and raising added value need to be further supported. By identifying the distinguishing features of the Şanlıurfa isot pepper obtained from different varieties, more support should be provided in terms of wide spreading of marketing capacity and branding potential.
These supports will contribute to increasing the economic power and market share of the families and/or businesses dealing with production of this local and traditional product. In doing so, to reveal the economic potential of Sanliurfa isot peppers should be cooperated with the private sector. Globally, consumers have begun to tend to traditional and also organic products with more natural characteristics [31].
It was found that natural properties are an important factor in the consumption of
traditional products [32]. Therefore,
traditional products must be registered and protected against counterfeiting. More efficient and widespread marketing channels should be determined and used for different varieties of isot pepper based on consumers’
demand. This should be determined within the framework of the information obtained from consumers by making detailed analysis to form the supply and demand. A study is concluded that existing of marketing problems in traditional products in Şanlıurfa-Turkey [33]. Product diversification could also be effective on the consumption amount and price which will positively affect both consumers and producers.
This will ensure that small family enterprises’, which produce the traditional isot pepper that are expressed in hundreds, get more share from social prosperity, at the same more satisfaction of consumers. This research is one of the first studies on this subject and it provides useful information to producers, sector representatives, and policy and decision makers.
Acknowledgements
This study was supported by the Republic of Turkey, Ministry of Industry and Technology, GAP Regional Development Administration by project name as GAPISOT-2 “Determining the Characteristics of Isot Pepper Produced from Different Fresh Red Peppers and
Determining the Factors Constituting
Consumers’ Demand”.
References
1. Daniluk J (2016) 5 health benefits of red peppers,
Retrieved from:
https://www.chatelaine.com/health/healthy-recipes-health/five-health-benefits-of-red-peppers/
2. Vengaiah PC, Pandey JP (2007) Dehydration Kinetics of Bell pepper (Capsicum annum L.), Journal of Food Engineering, 81:282-286.
3. Aydogdu MH, Atasoy AF, Eren ME, Mutlu N(2016) The Consumers’ Behaviors Towards to a Regional Agricultural Product in Turkey. IOSR Journal of Agriculture and Veterinary Science. 9(5):25-30. Doi: 10.9790/2380-0905022530.
4. FAO (2013) Food and Agriculture Organization, Red
Pepper Statistics, Retrieved from:
http://faostat3.fao.org/download /Q/QC/E.
5. Atasoy I, Hayoglu A, Korkmaz E, Kara, Yildirim A (2017) Geleneksel Ev İsot Baharatının Aflatoksin İçeriğinin Belirlenmesi Üzerine Bir Araştırma. Harran Tarım ve Gıda Bilimleri Dergisi, 21(1):35-40. DOI: 10.29050/harranziraat.303132
6. TUIK (2015) Turkiye Istatistik Kurumu, Herbal Production-Red Pepper Data, Retrieved from: https://biruni.tuik.gov.tr/bitkiselapp/bitkisel.zul. 7. GAP GAP nedir? (2018) Retrieved from:
http://www.gap.gov.tr/tarim-sayfa-15.html
8. TUIK (2018) Bitkisel Uretim, Retrieved from: https://biruni.tuik.gov.tr/ bitkiselapp/bitkisel.zul. 9. Aydogdu MH, Atasoy AF, Eren ME, Mutlu N,
Korkmaz A (2016) The Evaluation of the Producers' View towards a Local Agricultural Food Product for Marketing; Isot Pepper of Sanliurfa-GAP, Turkey, IOSR Journal of Environmental Science, Toxicology and Food Technology (IOSR-JESTFT). 10(9):59-64. DOI: 10.9790/2402-1009015964
10. Ranaivoson H (2005) the economic analysis of product diversity. Cahiers de la Maison des Sciences Economiques, 83 - ISSN: 1624-0340. Retrieved from:
https://halshs.archives-ouvertes.fr/halshs-00197137/document 11. Anderson SP, Renault R (1999) Pricing, product
diversity, and search costs: a Bertrand-Chamberlin-Diamont Model, RAND Journal of Economics, 30(4):719-735.
12. Anonymous, Şanlıurfa Nüfusu (2017) Retrieved from: https://www.nufusu.com/il/sanliurfa-nufusu 13. Yamane T (2001) Basic sampling methods,
(Literatur Publication: Istanbul).
15. Aydogdu MH, Yenigun K, Aydogdu M (2015) Factors Affecting Farmers’ Satisfaction from Water Users Association in the Harran Plain-GAP Region, Turkey. Journal of Agriculture Science and Technology. 17: 1669-1684
16. Otrar M (2018) Tek Yönlü Varyans Analizi
(ANOVA), Retrieved from:
http://mustafaotrar.net/istatistik/tek-yonlu-varyans-analizi-anova/
17. Wikipedia (2018) Likelihood function Retrieved from:
https://en.wikipedia.org/wiki/Likelihood_function 18. Kucuksille E(2010) Simple Linear Regression, SPSS
Applied Multivariate Statistical Techniques, (Asil Yayin Dagitim: Ankara).
19. Antalyalı OL (2010) Varyans Analysis, SPSS Applied Multivariate Statistical Techniques, (Asil Yayin Dagitim: Ankara).
20. Anonymous, Şanlıurfa Nüfusu (2017) Retrieved from: https://www.nufusu.com/il/sanliurfa-nufusu. 21. Solomon RM (2009)Consumer Behavior: Buying,
Having, and Being. (Pearson/Prentice Hall: Wisconsin-Madison University-USA). ISBN: 9780136015963.
22. Ardanaz PU (2013) Parameters in The Consumption Of Traditional Food Products, Retrieved from:
http://academica-e.unavarra.es/bitstream/handle/2454/7664/578100.p df?sequence=1chi,
23. Aydogdu MH, Atasoy AF, Eren AE (2018) Why Producers Use Different Varieties in Production? Red Pepper (Isot) Sampling of GAP-Sanliurfa, Turkey. IOSR Journal of Business and Management (IOSR-JBM), 20(8-I):88-94. DOI: 10.9790/487X-2008018894.
24. Hersleth M, Lengard V, Næs T, Vanhonacker F, Verbeke W (2008) W What Do European Consumers Think About Traditional Food?, Retrieved from: http://www.truefood.eu/files/library/files/abstract_no rdic2008.pdf
25. Koçak H (2014) Giresun İl Merkezindeki Geleneksel Gıda Tüketim Alışkanlıkları ve Tüketici Eğilimlerinin Belirlenmesi, 2014, 4. Geleneksel Gıdalar Sempozyumu, 17-19 Nisan, Adana.
26. Boundless Marketing (2018) Introduction to Price.
Boundless Marketing, Retrieved from:
https://courses.lumenlearning.com/boundless-marketing/chapter/introduction-to-price/
27. Gang M, Lee E, Chyun J (2006) A Study On the Korean Traditional Food Consumption of the Elementary Schoolchildren in Urban and Rural Area, Journal of The Korean Society of Food Culture, 21(4):357-365.
28. Taşdan K, Özer OO, Albayrak M, Albayrak K, Güldal HT (2014) Geleneksel Gıdalarda Tüketici Algı ve Tercihleri: Ankara İli Örneği, 2014, 4. Geleneksel Gıdalar Sempozyumu, 17-19 Nisan Adana.
29. Yalcin B (2013) Yöresel Ürünlerin Pazarlanması Üzerine Değerlendirmeler, Akdeniz Sanat Dergisi, 6(11):205-213.
30. Onurlubaş E, Taşdan K (2017) Geleneksel Ürün Tüketimini Etkileyen Faktörler Üzerine Bir Araştirma. Abant İzzet Baysal Üniversitesi Sosyal Bilimler Enstitüsü Dergisi, Retrieved from: http://sbedergi.ibu.edu.tr/index.php/sbedergi/article/
view/1273/1394. doi:
http://dx.doi.org/10.11616/AbantSbe
31. Kaya F, Aydogdu MH, Eren ME (2016) The Organic Product Consumer Profile of GAP-Şanlıurfa Province of Turkey, IOSR Journal of Business and Management (IOSR-JBM) 18(9):140-147. DOI: 10.9790/487X-180902140147
32. Pieniak Z, Verbeke W, Vanhonacker F, Guerrero L, Hersleth M (2009) Association Between Traditional Food Consumption and Motives for General Food Choice in Six European Countries, Appetite, 53(1):179-192.