PRODUCT DISTRIBUTION AND REACTION KINETICS IN THE
AROMATIZATION OF YANHUA FCC GASOLINE
Zhang Yongmei,
[a]and You Hongjun
[b]Keywords: reaction condition; reaction kinetics; FCC gasoline; Yanhua; LPG.
By using Yanhua FCC gasoline and a selected fraction of Yanhua FCC gasoline as feedstocks, the effects of reaction temperature, Weight Hour Space Velocity (WHSV), and feedstock performance on yields of LPG, aromatics, and propylene production were investigated in a confined fluidized bed reactor. The experimental result show that yields of aromatics, propylene, and aromatics + propylene for both Yanhua FCC gasoline and fraction of Yanhua FCC gasoline increase with the increase of reaction temperature at the same WHSV. Yields of aromatics, propylene, and aromatics + propylene decrease with the increase of WHSV at the same reaction temperature. Eight-lump kinetics and ten-lump kinetics are pointed out. The experimental results show that both kinetic models can predict the distribution of gasoline conversion and the composition of hydrocarbons of gasoline products under the different reaction conditions.
* Corresponding Author Fax: 1-403-777-6272
E-Mail: [email protected]
[a] Liaoning Shihua University, Fushun, Liaoning, P.R. China. [b] SAIT Polytechnic, Calgary AB, Canada.
Introduction
With increasing environmental regulations to petroleum products, USA, Japan, and EU countries1 had to issue a new
gasoline standard in order to decrease the olefin content of gasoline, towards 25% (by volume) or even lower.2 A new
gasoline standard was put into practice in January 2003 in China, because of the requirement of environmental protection.3 As requested, the content of olefins, sulphur,
benzene, and other aromatics had to be lower than 35v%, 0.08m%, 2.5v% and 40v%, respectively, and the research octane number (RON) was required to be above 90.4 Owing
to the enforcement of the new standard, many refineries have to face the challenge.5 However, at present, the portion
of fluid catalytic cracking (FCC) gasoline in commercial gasoline is about 85% and their olefin concentration is roughly between 50 and 60% in spite of the improvement of fluid catalytic cracking technology in China. The average olefin content of gasoline in 60 refinery plants reaches 44.2%. All of these are in contrast with the new standard.6 In
order to satisfy the Chinese New Standard, new aromatization catalysts were studied.7 Using these catalysts,
the olefin content of gasoline is transformed into i-paraffins and aromatics, which gradually improves the stability of gasoline and decreases their harmfully emitted amounts in the tail gas of cars, as well as ensures the gasoline octane number (Li, et al., 2003).8 In this paper, the distribution of
aromatization reaction products of Yanhua FCC gasoline are studied under different reaction condition in a confined fluidized bed reactor. Eight-lump kinetics and ten-lump kinetics are pointed out in order to predict the distribution of gasoline conversion and the composition of hydrocarbons of gasoline products.
Experimental section
Feedstock
Yanhua FCC gasoline was obtained from an FCC Unit of Yanhua Petrochemical Company. The compositions of gasoline and the selected gasoline fraction are shown in Table 1.
Table 1. Compositions of Yanhua FCC gasoline and fraction of Yanhua FCC gasoline (v%)
Feedstock Yanhua FCC gasoline
fraction of Yanhua FCC gasoline
(boiling point < 90°C) Paraffin 27.8 38.5 Olefin 52.2 58.7
Aromatics 20.0 2.8
Total 100 100
Catalyst
LBO-A catalyst, which was aged with 2ml/min vapor at 800 °C in a confined fluidized bed reactor, was obtained from Lanzhou Petrochemical Institute. Its properties are presented in Table 2.
Table 2. Properties of LBO-A catalyst
Parameters Value
Micro-activity Test Index (MATI), % 56 Apparent density, g/ml 0.8 Pore volume, ml/g 0.3
Surface area, m2/g 85
Particle size distribution, % (by mass)
Apparatus
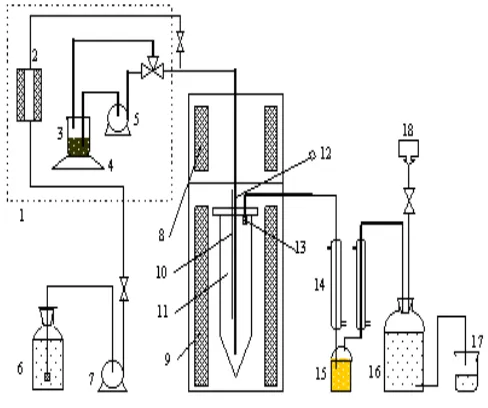
A confined fluidized bed reactor9 shown in Figure 1, was
applied in the Yanhua FCC gasoline aromatization. It consisted of five parts: oil and stream input system, reaction zone, temperature control, product separation, and collection system. Variable amount of distilled water was pumped into the furnace to evaporate it into steam, and then steam was mixed with the Yanhua FCC gasoline pumped simultane-ously by another pump at the outlet of a constant temperature box. The mixture was heated to approximately 450 °C in a preheated room before it entered the reactor.
Figure 1 Schematic drawing of experimental apparatus
Analytical method
A HP6890 Gas Chromatograph with Chem Station software was used to measure the volume percentage of aromatization of gas components. These data were converted to mass percentages using the equation of state for ideal gases. The aromatized liquid was analyzed with TSY-1132 to obtain the mass percentages of paraffins, olefins, and aromatics. The mass percentage of coke on catalyst was measured with KJ-02 Fast and Exact Measuring Coke Equipment.
Results and discussion
Effects of reaction temperature and WHSV on yield of LPG, aromatics, and propylene production of Yanhua FCC gasoline
Table 3 shows the relations between reaction temperature, WHSV and the yield of LPG production of Yanhua FCC gasoline. Yields of propylene and i-butane increased with the increase of WHSV at the same reaction temperature, however, yields of n-butane, 2-butylene, and 1-butylene decreased with the increase of WHSV at the same reaction temperature. Yield of propylene increased with the increase of reaction temperature at the same WHSV, but yields of i-butane, n-i-butane, and 2-butylene decreased with the increase of reaction temperature at the same WHSV.
Table 4 indicates the relationship between reaction temperature, WHSV, and yield of aromatics and propylene of Yanhua FCC gasoline. Yields of aromatics, propylene, and aromatics + propylene increase with the increase of reaction temperature at the same WHSV. Yields of aromatics, propylene, and aromatics + propylene decrease with the increase of WHSV at the same reaction temperature.
Table 3. Effect of reaction temperature and WHSV on the yield of LPG production of Yanhua FCC gasoline (wt%)9
Temperature, °C WHSV, h–1 propane propylene i-butane n-butane 2-butylene 1-butylene i-butylene
10 1.5 43.6 10.1 2.4 14.5 6.7 21.2
20 1.5 45.7 11.7 2.1 13.4 5.8 19.8
430
30 1.4 46.1 12.2 1.7 12.7 4.9 21.0
10 2.0 48.4 8.5 1.7 13.7 5.8 19.9 20 1.8 49.7 9.1 1.5 12.4 5.1 20.4 450
30 1.6 50.4 10.6 1.0 11.5 4.8 20.1
10 1.4 52.4 4.4 1.4 13.4 6.2 20.8 20 1.5 53.1 6.7 0.8 12.5 5.4 20.0 470
30 1.5 54.0 8.6 0.5 11.1 4.9 19.4 Note: Catalyst to oil and water to oil are 6 and 0.05, respectively.
Effects of reaction temperature and WHSV on the yield of LPG, aromatics, and propylene production of the fraction of Yanhua FCC gasoline (boiling point < 90 °C)
Table 5 shows the relationship between reaction temperature, WHSV, and yield of LPG production for the fraction of Yanhua FCC gasoline. Yields of propane, i-butane, n-i-butane, 2-butylene, and 1-butylene increase with the increase of WHSV at the same reaction temperature, however, yields of propylene and i-butylene decrease with the increase of WHSV at the same reaction temperature. Yield of propylene increases with the increase of reaction
temperature at the same WHSV, but yields of i-butane, n-butane, 2-butylene, 1-butylene, and i-butylene decrease with the increase of reaction temperature at the same WHSV.
Table 4. Effect of reaction temperature and WHSV on the yield of aromatics and propylene of Yanhua FCC gasoline (wt%)9
Temperature, °C WHSV, h–1 Aromatics Propylene Aromatics + Propylene 10 36.1 3.79 39.89
20 35.7 3.47 39.17 430
30 33.4 3.23 36.63 10 36.7 4.89 41.59 20 36.3 4.42 40.72 450
30 35.4 4.18 39.58 10 40.1 6.34 46.44 20 39.5 5.04 44.54 470
30 38.6 4.64 43.24 Note: Catalyst to oil and water to oil are 6 and 0.05, respectively.
Table 5. Effect of reaction temperature and WHSV on the yield of LPG production of the fraction of Yanhua FCC gasoline (boiling point < 90 °C) (wt%)9
Temperature, °C WHSV, h–1 propane propylene i-butane n-butane 2-butylene 1-butylene i-butylene
10 2.3 44.7 8.6 2.1 13.8 5.2 23.3
20 2.7 40.6 10.4 2.9 14.1 5.4 23.9
430
30 3.1 38.6 13.7 3.6 14.7 5.8 20.5
10 2.6 48.2 8.1 1.8 12.7 4.8 21.8
20 2.6 44.2 9.6 3.4 13.4 5.1 21.7
450
30 3.2 39.8 12.4 4.2 13.9 5.6 20.9
10 2.8 52.4 7.7 1.8 11.5 4.8 19
20 3.1 51.1 8.4 2.4 11.9 5.0 18.1
470
30 3.4 50.3 9.1 3.2 12.4 5.4 16.2
Note: Catalyst to oil and water to oil are 6 and 0.05, respectively.
Table 6. Effect of reaction temperature and WHSV on the yield of aromatics and propylene of the fraction of Yanhua FCC gasoline (boiling point < 90 °C) (wt%)9
Temperature, °C WHSV, h–1 Aromatics Propylene Aromatics + Propylene 10 15.3 0.84 16.14
20 15.0 0.77 15.77 430
30 14.6 0.67 15.27 10 17.9 1.20 19.1 20 17.2 1.03 18.23 450
30 15.7 0.85 16.55 10 19.6 1.84 21.44 20 19.4 1.55 20.95 470
30 18.5 1.20 19.7 Note: Catalyst to oil and water to oil are 6 and 0.05, respectively.
Table 7. Raw materials and products’ lump division10
Gasoline (C5-205 ºC) LPG (C3-C4) Diesel (>205 ºC) Off-gas (C 1,C2,H2) n-paraffin i-paraffin olefin c-paraffin aromatics paraffin olefin diesel gas
Coke
Np Ip O N A Pg Og Do Dg Ck
Table 8. Typical experimental results of FCC reaction at different conditions 10
T(K) φc/o tV (s) yGP (%) yGO (%) yGN (%) yGA (%) yDG (%) yLPG (%) yLCO (%) yCOKE
(%)
823 8.0 2.0 28.70 17.74 9.85 19.11 1.48 16.14 4.54 2.13
823 8.0 4.0 24.57 7.97 6.55 21.27 2.64 25.87 5.18 5.27
823 13.0 2.0 26.30 11.32 8.12 20.82 2.21 21.59 5.05 3.78
853 8.0 2.0 27.86 15.54 10.43 20.02 2.56 16.85 4.39 2.02
853 8.0 4.0 23.58 6.69 6.52 21.79 4.12 26.98 5.13 4.93
853 13.0 2.0 25.40 9.74 8.27 21.51 3.47 22.45 4.95 3.58
873 8.0 2.0 27.33 14.39 10.71 20.43 3.40 16.57 4.31 1.95
873 8.0 4.0 22.91 5.99 6.51 21.97 5.42 26.87 5.09 4.67
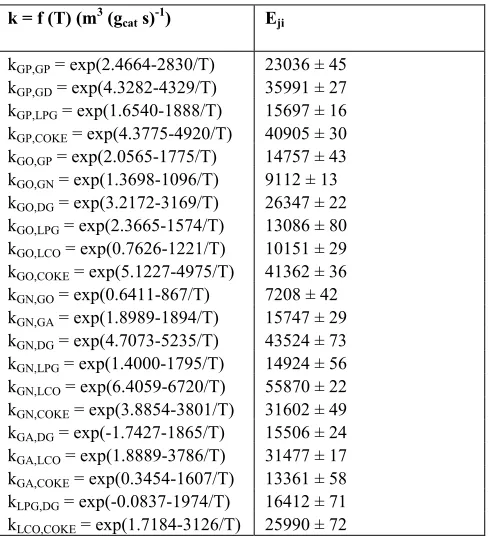
Table 9. Results of reaction kinetic parameters 10 k = f (T) (m3 (g
cat s)-1) Eji
kGP,GP = exp(2.4664-2830/T) 23036 ± 45 kGP,GD = exp(4.3282-4329/T) 35991 ± 27 kGP,LPG = exp(1.6540-1888/T) 15697 ± 16 kGP,COKE = exp(4.3775-4920/T) 40905 ± 30 kGO,GP = exp(2.0565-1775/T) 14757 ± 43 kGO,GN = exp(1.3698-1096/T) 9112 ± 13 kGO,DG = exp(3.2172-3169/T) 26347 ± 22 kGO,LPG = exp(2.3665-1574/T) 13086 ± 80 kGO,LCO = exp(0.7626-1221/T) 10151 ± 29 kGO,COKE = exp(5.1227-4975/T) 41362 ± 36 kGN,GO = exp(0.6411-867/T) 7208 ± 42 kGN,GA = exp(1.8989-1894/T) 15747 ± 29 kGN,DG = exp(4.7073-5235/T) 43524 ± 73 kGN,LPG = exp(1.4000-1795/T) 14924 ± 56 kGN,LCO = exp(6.4059-6720/T) 55870 ± 22 kGN,COKE = exp(3.8854-3801/T) 31602 ± 49 kGA,DG = exp(-1.7427-1865/T) 15506 ± 24 kGA,LCO = exp(1.8889-3786/T) 31477 ± 17 kGA,COKE = exp(0.3454-1607/T) 13361 ± 58 kLPG,DG = exp(-0.0837-1974/T) 16412 ± 71 kLCO,COKE = exp(1.7184-3126/T) 25990 ± 72
Eight-lump kinetics model10
By using Y-type zeolite as a catalyst, FCC gasoline composition is divided into eight parts, including dry gas (DG), liquefied petroleum gas (LPG), aromatics (GA), olefin (GO), naphthene (GN), paraffin (GP), coke (COKE), and light circle oil (LCO). The cracking reaction, hydrogen transfer reaction, aromatisation, isomerisation and alkylation are considered and the reaction network is reasonably simplified (see Figure 2). The kinetic parameters through the hybrid genetic algorithm are established. The results show that this model can predict the distribution of gasoline conversion and the composition of olefins and aromatics of gasoline products under the different reaction conditions.
Table 8 shows typical experimental results of FCC reaction under different conditions. In this table, it can be clearly seen that yGP, yGO, and yCOKE are decreasing, while
yGN, yDG, yLCO, and yGO are increasing with the increase of
reaction temperature; the yLPG first increases and then
decreases when reaction temperature goes up.
Table 9 indicates the estimated values of average activation energies and the expressions of kinetic constants. Table 10 represents comparison of production yields for all lumps between experimental and predicted results. The experimental results show that predicted values are close to experimental results.
Table 10. Comparison of predicted and experimental production yields 10
Item Experimental Predicted Experimental Predicted
T (K) 773 923
tv (s) 2.0 1.7
φc/o 9.5 9.0
yGP(%) 28.96 28.10 25.85 25.21
yGO (%) 10.27 9.97 12.00 11.81
yGN(%) 13.50 14.20 11.26 11.99
yGA(%) 22.49 22.75 20.94 21.22
yDG(%) 3.90 3.20 6.43 6.77
yLPG(%) 13.96 14.33 17.22 16.89
yLCO(%) 4.65 4.79 4.20 4.58
yCOKE(%) 2.27 2.57 1.68 1.94
Table 11. The calculated and experimental yields of FCC gasoline catalytic reaction as a function of apparent activation energy and frequency factor 11
y (%) (1) y (%) (2) Item
Experimental Predicted Relative error (%)
Experimental Predicted Relative error (%)
Np 0.0625 0.0632 1.12 0.0624 0.0629 0.80
Ip 0.4081 0.4108 0.66 0.4086 0.4099 0.32
O 0.1481 0.1404 -5.20 0.1348 0.1284 -4.75
N 0.0675 0.0670 -0.74 0.0623 0.0648 4.01
A 0.1942 0.1980 1.96 0.2016 0.2007 -0.45
Pg 0.0214 0.0203 -5.14 0.0249 0.0240 -3.61
Og 0.0337 0.0342 1.48 0.0364 0.0378 3.85
Do 0.0389 0.0406 4.37 0.0398 0.0423 6.28
Ck 0.0211 0.0210 -0.47 0.0242 0.0241 -0.41
Figure 2. FCC Gasoline Eight-Lump Kinetic Model Conclusion
Ten-lump kinetics model11
Based on the catalytic reaction mechanism, and the chemical composition of FCC gasoline, FCC gasoline material is divided into ten-lump (see Table 7). The reaction network is reasonably simplified (see Figure 3). Ten-lump kinetic model of gasoline catalytic conversion reaction is established by estimating parameter to obtain fourteen kinetic rate constants, activation energies, and pre-exponential factors. The results show that this model can predict the distribution of gasoline conversion and the composition of hydrocarbons of gasoline products under the different reaction conditions.
Figure 3. FCC gasoline Ten-Lump Kinetic Model
Table 11 shows comparison between experimental and predicted production yields for all lumps’ results. The experimental results show that predicted values are close to experimental results and their relative errors are very low.
Aromatization reaction of Yanhua FCC gasoline and a fraction of Yanhua FCC gasoline was studied using LBO-A as catalyst in a confined fluidized bed reactor.
The experimental results are summarized as follow: Yields of aromatics, propylene, and aromatics + propylene for both Yanhua FCC gasoline and fraction of Yanhua FCC gasoline (b.p.<90 °C) increased with the increase of reaction temperature at the same WHSV.
Yields of aromatics, propylene, and aromatics + propylene decrease with the increase of WHSV at the same reaction temperature. Reaction results of Yanhua FCC gasoline are almost the same as that of the fraction of Yanhua FCC gasoline. (3) Eight-lump kinetics and ten-lump kinetics are pointed out.
The experimental results show that two kinetic models can predict the distribution of gasoline conversion and the composition of hydrocarbons of gasoline products under different reaction conditions.
Experimental Principle 12
Small (C2=~C5=) and log chain olefins can exchange
The reaction can be written as Eqn. (1):
(1)
The cyclization takes place when high olefins (C6+) and
catalyst are in contact. It can be expressed as:
high olefins (C6+) cycloparaffins
cyclization reaction
(2)
Interaction of cycloparaffins with Lewis acerbity produces aromatic hydrocarbons as it can be expressed with Eqn. (3):
cycloparaffins aromatics
dehydrogenation
(3)
Coking reactions take place when aromatics and n-paraffins can be in contacted on the catalyst surface and reacted (Eqn. (4)):
(4)
References
1 Miao, Y. Petroleum Processing and Petrochemicals, 1999, 30(6), 9-11.
2 Feng, C. L., Cao, Z. B., Xu, X. L. J. Fushun Petroleum Inst.,
2002, 22(2), 25-29.
3 Mao, A. G. Chem. Eng. Oil & Gas, 2003, 32(4), 219-221. 4 Zhou, B., Guo, H.C., Wang, X. S. Contemporary Chem. Ind.,
2004, 33(3), 141-145.
5 Liu, C. H., Deng, Y. Q., Pan, Y. Q. J Mol. Catal. A: Chemical, 2004, 215, 195-199.
6 Zhang, Y. X. Qil Petrochem. Tech., 2004, 32(3), 189-191. 7 Yu, F., Bao, X. J., Gang, S. Appl. Catal. A: General, 2004, 275,
61-71.
8 Li, H., Guo, Z. J. Petroleum Refinery Eng., 2003, 33(3), 27-30. 9 Lu, H. J., Zhang, L., Eur. Chem. Bull., 2012, 1(3-4), 103. 10 Wang, L. Y., Yan, B. L., Wang, Z. W., W. Chem. Eng. J.,
2005, 109, 1-9.
11 Liu, F. A., Hou, S. D., Long, J. Acta Petrol. Sinica, 2005,
21(6), 32-39.
12 You, H. Korean J. Chem. Eng., 2007, 24(1), 31-36.
Received: 21.08.2012. Accepted: 27.08.2012.
R
+
R
R
low olefins (C2=-C5=) high olefins (C6+)
oligomerization