Comprehensive Evaluation of High-Speed and Medium-Speed
Implementations of Five SHA-3 Finalists
Using Xilinx and Altera FPGAs
Kris Gaj, Ekawat Homsirikamol, Marcin Rogawski, Rabia Shahid, and Malik Umar Sharif
George Mason University
{kgaj, ehomsiri, mrogawsk, rshahid, msharif2}@gmu.edu
Abstract. In this paper we present a comprehensive comparison of all Round 3 SHA-3 candidates and the current standard SHA-2 from the point of view of hardware performance in modern FPGAs. Each algorithm is implemented using multiple architectures based on the concepts of iteration, folding, unrolling, pipelining, and circuit replication. Trade-offs between speed and area are investigated, and the best architecture from the point of view of the throughput to area ratio is identified. Finally, all algorithms are ranked based on their overall performance in FPGAs. The characteristic features of each algorithm important from the point of view of its implementation in hardware are identified.
Keywords: benchmarking, hash functions, SHA-3, hardware, FPGA.
1.
Introduction
2.
Previous Work
Previous results on comparison of Round 2 SHA-3 candidates in hardware are summarized in [7,3,4]. These results are classified into four major categories, based on the technology (FPGA vs. ASIC), and the optimization target (High-Speed vs. Low-Area). The previous results most relevant to the subject of this paper belong to the category of High-Speed Implementations in FPGAs. The most comprehensive results belonging to this category were reported by Baldwin et al. [10,11], Gaj et al. [15], Homsirikamol et al. [23], Matsuo et al. [34], and Knežević et al. [32]. All these groups have published results for all 14 Round 2 candidates. Majority of published results concern 256-bit variants of the candidates, implemented using Xilinx Virtex 5 FPGAs. In [23], results for 256-bit and 512-bit variants of all algorithms, implemented using 10 FPGA families from Xilinx and Altera are discussed. Additionally, pipelined implementations of three Round 2 SHA-3 candidates have been investigated in [8]. In our earlier paper, published at CHES 2011 [24], we investigated the throughput vs. area trade-offs in implementations of 2 and five SHA-3 finalists. In this paper, we present results obtained by extending each architecture with a padding unit, and optimizing selected pipelined implementations of the SHA-3 candidates. A similar study, limited to most efficient high-speed single-message architectures has been reported in [33]. Additionally, two unified high-speed hardware architectures of AES and Groestl have been reported in [25,36]. The influence of system parameters on the performance of selected SHA-3 candidates have been investigated in [14].
Several comprehensive comparisons of low-area implementations of Round 3 SHA-3 candidates in FPGAs have been presented in [26,27,29,30,31]. Additional results for BLAKE and Skein have been discussed in [13,9]. The most comprehensive studies of ASIC implementations of the Round 3 SHA-3 candidates have been described in [18,19,20] and documented in [4]. These studies follow previous investigation of Round 2 SHA-3 candidates described in [17,21,22,38].
All results obtained based on the Round 2 specifications of SHA-3 candidates carry without any changes for Keccak and Skein. The specifications of BLAKE, Groestl, and JH have been tweaked at the start of Round 3, in January 2011. The throughput of the Round 3 BLAKE and JH can be calculated based on the results from Round 2 by decreasing it by a factor proportional to the increase in the number of rounds. The area of these implementations will remain practically the same. The change in the throughput and area of Groestl is much more difficult to approximate, as demonstrated in [35].
3.
Performance Metrics
Three major performance metrics used in our study are throughput, area, and throughput to area ratio. Throughput presented in all tables and graphs in this paper (except Section 11) is calculated as the throughput for long messages. The formulas describing the adjustments to the values of the throughput required when processing short messages are presented in Section 11.
The resource utilization in FPGAs is a vector, with coordinates specific to the given FPGA family, e.g.
Resource UtilizationVirtex 5 = (#CLB slices, #BRAMs, #DSPs) (1) Resource UtilizationStratix III = (#ALUTs, #memory_bits, #DSPs). (2)
In these formulas: #CLB_slices is the number of Configurable Logic Block slices, BRAM stands for Block RAM, DSP is a Digital Signal Processing unit, #ALUTs represents the number of Adaptive Look-Up Tables, and #mem-bits is the number of bits stored in dedicated Altera FPGA memories.
Taking into account that vectors cannot be easily compared to one another, we have decided to opt out of using any dedicated resources in the hash function implementations used for our comparison. Thus, all coordinates of our vectors, other than the first one have been forced (by choosing appropriate options of the synthesis and implementation tools) to be zero. This way, our resource utilization (further referred to as Area) is characterized using a single number, specific to the given family of FPGAs, namely
4. Investigated Hardware Architectures
Investigated architectures are described in more detail in our earlier paper presented at CHES 2011 [24]. Additionally, full VHDL source codes and corresponding hierarchical block diagrams of majority of these architectures have been published at [5]. Below, we present only a short summary of major features of the known-to-date high-speed and medium-speed hardware architectures of SHA-3 finalists.
A starting point for our exploration is the basic iterative architecture, shown in Fig. 1a. This architecture is the most efficient (in terms of the throughput to area ratio) non-pipelined architecture of SHA-2, Groestl, JH, and Keccak.
In order to reduce area necessary to implement a given hash algorithm, at the cost of decreasing its throughput, folded architectures can be used. These architectures can be employed only if a round of a hash function has a symmetric structure with respect to either horizontal or vertical axis (with input to a round shown at the top and output shown at the bottom of the round block), as illustrated in Fig. 1.
In Fig. 1b, horizontal folding by a factor of two is demonstrated. We will denote this architecture by /2(h). In this architecture, a half of a round is implemented as combinational logic, and the entire round is executed using two clock cycles. As a result, the block processing time (and thus also throughput) stays approximately the same, and area decreases. These dependencies lead to the overall increase of the Throughput to Area ratio. In general, folding by a factor of k might be possible, and the corresponding architecture will be denoted by /k(h). Among the five finalists, the only candidate that can benefit substantially from horizontal folding is BLAKE. The round of BLAKE consists of two horizontal layers of identical G functions, separated only by a permutation. By implementing only one layer in combinational logic, horizontal folding by a factor of two can be easily achieved. Additionally, each G function has a very symmetric structure along the horizontal axis, and can be easily folded horizontally by a factor of 2. As a result, a folding factor of 4 can be achieved for the entire round. Other SHA-3 finalists do not demonstrate any similar symmetry.
In Fig. 1c, we demonstrate vertical folding by a factor of 2. We will denote this folding by /2(v). In this architecture, the datapath width is reduced by a factor of two. As a result two clock cycles are required to complete a round. In the first clock cycle, only bits of the internal state affecting the first half of the round output are provided to the input of R/2. In the second clock cycle, the remaining bits of the internal state are processed. The first output is stored in an auxiliary register of the size of s/2 bits. This output is concatenated with the output from the second iteration to form a new internal state. The clock period of this architecture is approximately equal to the clock period of the basic iterative architecture. As a result, the block processing time increases approximately by a factor of two compared to the basic iterative architecture. The area reduction is also smaller than in case of horizontal folding, because of the need for an extra s/2-bit register and a multiplexer. As a result the throughput to area ratio is likely to go
Fig. 1. Three hardware architectures of a hash function: a) basic iterative, x1, b) folded horizontally by a factor of 2, /2(h), c) folded vertically by a factor of 2, /2(v).
down. In general, vertical folding by a factor of k might be possible, and the corresponding architecture will be denoted by /k(v). Out of five final SHA-3 candidates, BLAKE and Groestl are most suitable for vertical folding. JH can be folded, but the gain in area is not expected to be substantial, because the round of JH is very simple, and does not dominate the total area of the circuit. For Skein and Keccak, the internal round symmetry, necessary for implementation of vertical folding, is limited.
For vertical folding with the factor k≥4 it is beneficial to store the internal state in memory, rather than in registers. The obtained throughput to area ratio can be substantially increased as a result of this change in the storage element. We will denote the obtained architectures as /k(v)-m.
In order to increase circuit throughput for processing of a single message, unrolling can be used. In Fig. 2a, architecture with unrolling by a factor of two is demonstrated. The combinational logic of a round is replicated, so now two rounds are performed per clock cycle. Since the total number of clock cycles is reduced approximately by a factor of two, and the clock period increases by a factor less than two (due to optimizations on the boundaries of two rounds, and the smaller relative contributions of the multiplexer delay, the register delay, and the register setup time), the total throughput increases. Unfortunately, at the same time, the area of the circuit is likely to increase by a factor close to the unrolling factor. As a result, in most cases, the throughput to area ratio decreases substantially compared to the basic iterative architecture. As such, architectures with unrolling are typically used only when throughput for a single long message is of the utmost concern, and area is abundant.
Nevertheless, there are exceptions to this rule. Unrolling can improve the throughput to area ratio when rounds used by an algorithm in subsequent iterations are not the same, or there is a potential for substantial delay reductions on the boundary between consecutive rounds. Among the five final SHA-3 finalists, this situation happens only for Skein. As a result, the throughput to area ratio of Skein becomes optimum for one of the unrolled architectures.
Further increase in the throughput and the throughput to area ratio of SHA-3 candidates is possible by using pipelined architectures. In order to take full advantage of the pipelined architectures multiple messages must be processed at the same time. Luckily, this is exactly the situation that appears most often in practical applications of hash functions. For example, in the most widespread Internet security protocols, such as IPSec, SSL, and WLAN (802.11), the inputs to a hash unit are packets. The maximum size of a packet for Internet is limited by so called Maximum Transmission Unit (MTU). The typical size of MTU for Ethernet based networks is 1500 bytes. The Maximum Transmission Unit for the Internet IPv4 path is even smaller, and set to 576 bytes. As a result, in a typical internet node, up to 80% of packets processed have the size of 576 bytes or less, and 100% of packets have sizes equal or smaller than 1500 bytes. Such small sizes of packets mean that hundreds of packets could be easily buffered in the processing nodes, in the form of packet queues, without introducing any significant latency to the total packet travel time from the source to destination. Therefore, the capabilities for parallel processing (including pipelining) seem to be primarily limited by the total area of the hash unit, and not by the number of messages available in parallel. In this paper, we will assume that the number of messages available in parallel is large (at least 10), and we will look at the combined throughput for all available streams of data.
Fig. 2. Three hardware architectures of a hash function a) unrolled by a factor of 2, x2, b) unrolled by a factor of 2 with 2 pipeline stages, x2-PPL2, c) basic iterative with 2 pipeline stages, x1-PPL2.
Notation: R – round, R/2 – half-round, s – state size in bits.
simultaneous processing of multiple streams of data. The throughput to area ratio may increase, but the improvement is not guaranteed for all algorithms, and all FPGA families, and may be small or negative in case the basic iterative architecture operates already at the clock frequency close to the maximum clock frequency supported by a given FPGA family.
The final alternative is architecture obtained by replicating the entire circuit multiple number of times. We call this architecture a multi-unit architecture, and we denote it by MUn, where n denotes the number of repetitions of the hash core. Obviously, in this architecture, throughput and area increase proportionally, and n messages are required to be present concurrently in order to take full advantage of the potential increase in throughput. A typical design approach would be to first find an architecture with the best throughput to area ratio, and then replicate it as many times as necessary in order to reach the desired throughput.
The formulas for the throughput of all aforementioned architectures, assuming processing of long messages, are summarized in Table 1.
Table 1: Formulas for the Throughput, Tp, of all investigated architectures. Notation: b – block size, r – number of rounds, f – number of clock cycles required to finalize computations for a block (f = 0 for Keccak and Groestl (P+Q), f=1 for all remaining algorithms), k – folding factor or unrolling factor, n – number of pipeline stages, T – clock period.
Notation Architecture Throughput
x1 Basic iterative Tp = b/(( r + f ) ⋅ T)
/k Folded by a factor of k Tp = b/(( k⋅r + f ) ⋅ T)
xk Unrolled by a factor of k Tp = b/(( r/k + f ) ⋅ T)
x1-PPLn Basic iterative
with n pipeline stages Tp = n⋅b/(( n⋅r + f ) ⋅ T) /k-PPLn Folded by a factor of k
with n pipeline stages Tp = n⋅b/(( n⋅k⋅r + f ) ⋅ T) xk-PPLn Unrolled by a factor of k
with n pipeline stages Tp* = n⋅b/(( n⋅r/k + f ) ⋅ T) MUn Multi-unit architecture based
on n repetitions of the basic iterative architecture
Tp = n⋅b/(( r + f ) ⋅ T)
5. Design Methodology and Design Environment
Our designs for the basic iterative, folded, and unrolled architectures use the interface and the communication protocol proposed in [15,23]. Our designs for the pipelined architectures, use the interface and surrounding logic shown in Fig. 3. Input FIFOs serve as packet queues. Each FIFO communicates with the corresponding Padding Unit and the associated Finite State Machine 1 (FSM1). FSM1 is responsible for loading the next block of data and padding the last block of a message, if needed (possibly in parallel with the Datapath processing the previous block under the control of FSM2). Outputs corresponding to four independent packets are first stored in the corresponding Parallel-In Serial-Out Units, and then multiplexed to the output FIFO.
All architectures have been modeled in VHDL-93. All VHDL codes have been thoroughly verified using a universal testbench, capable of testing an arbitrary hash function core. A special padding script was developed in Perl in order to pad messages included in the Known Answer Test (KAT) files distributed as a part of each candidate’s submission package.
For synthesis and implementation, we have used tools developed by FPGA vendors themselves:
• for Xilinx: Xilinx ISE Design Suite v. 13.1, including Xilinx XST, • for Altera: Quartus II v. 11.1 Subscription Edition Software.
The generation of a large number of results and optimization of tool options was facilitated by an open source benchmarking environment, called ATHENa (Automated Tool for Hardware EvaluatioN) [2,16].
All result graphs included in this paper use color codes introduced by Bernstein and Lange in [6,12].
Fig. 3: The interface, high-level block diagram, and surrounding logic of the Hash Unit for the pipelined architecture with four pipeline stages. Notation: Padding – Padding Unit, including SIPO (Serial-In Parallel-Out unit), PISO – Parallel-In Serial-Out unit, w – input/output bus width, w=64 for all investigated algorithms, except SHA-2-256, where w=32.
6.
Results with Padding
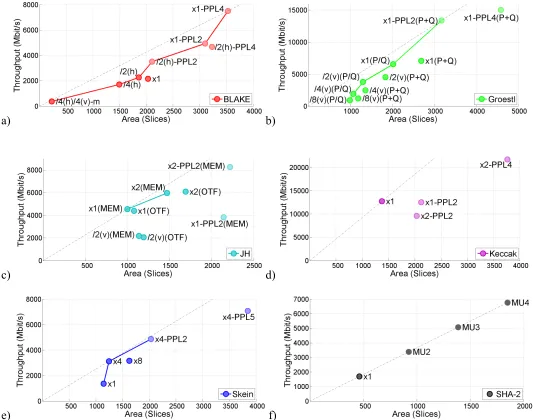
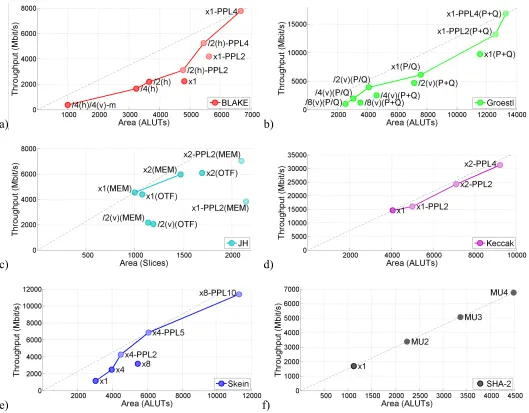
The results of our implementations with padding units are summarized in Figs. 4-9, and in Tables 2 and 3. In Figs. 4 and 5, we present the detailed throughput vs. area graphs for all implemented architectures of the 256-bit variants of six investigated algorithms in Xilinx Virtex 5 and Altera Stratix III, respectively.
• for Virtex 5: /4(h)/4(v)-m, i.e., architecture with horizontal folding by a factor of 4, combined
with vertical folding by a factor of 4, and internal state stored in memory;
• for Stratix III: /2(h), i.e., architecture with horizontal folding by a factor of 2.
The good performance of the former of these two architectures is associated with the significant reduction of the complexity of the input permutation module as a result of vertical folding by a factor of 4. The two less successful architectures include x1 and /2(h)-PPL4 for Virtex 5, and x1 and x1-PPL2 for Stratix III. These architectures are not included in our combined graphs shown in Figs. 6-9.
For Groestl (see Figs. 4b and 5b), we consider two major architecture types: a) parallel architectures, denoted (P+Q), in which Groestl permutations P and Q are implemented using two independent units, working in parallel, and b) quasi-pipeline architectures, denoted (P/Q), in which, the same unit is used to implement both P and Q, and the computations belonging to these two permutations are interleaved [38]. The details of the basic quasi-pipelined architecture of Groestl are described in [38, Section 9] and [23, Section 3.8]. In this study, we apply vertical folding and pipelining to both architectures. The best architectures overall appear to be: x1-PPL2 (P+Q) for Virtex 5, and x1-PPL4 (P+Q) for Stratix III. The best non-pipelined architectures are: x1 (P/Q) for Virtex 5, and /2(v) (P/Q) for Stratix III. Folded parallel architectures, /k(v) (P+Q), are slower than the quasi-pipelined architectures (P/Q) using comparable area. The same is true for the basic iterative parallel architecture, x1 (P+Q). An attempt to pipeline Groestl using 7 pipeline stages (x1-PPL7), using logic-only implementation of S-boxes, appeared to be rather unsuccessful.
For JH (see Figs. 4c and 5c), we consider two major types of architectures: a) with round constants stored in memory, JH (MEM), and b) with round constants calculated on the fly, JH (OTF). Both approaches seem to result in a very similar performance for the basic iterative architectures, x1. Neither vertical folding nor pipelining seem to be efficient when applied directly to the basic architecture. Vertical folding by two, somewhat unexpectedly, increases area, and the basic architecture with two pipeline stages does not improve throughput. Both undesired effects can be tracked back to the simplicity of the main round. Folding does not reduce area, because of extra registers and multiplexers introduced to a very simple round. Pipelining does not increase throughput, because a simple basic round has already very short delay, and is hard to divide into two well balanced pipeline stages. Overall, the best architectures are: x1 (MEM) for Virtex 5 and x2-PPL2 (MEM) for Stratix III.
For Keccak (see Figs. 4d and 5d), the best architecture overall is the basic iterative architecture. Pipelining appears to be quite unsuccessful in Virtex 5, and somewhat more successful in Stratix III, where three different pipelined architectures (x1-PPL2, x2-PPL2, and x2-PPL4) give similar throughput to area ratio as the basic iterative architecture, x1. Vertical folding has been attempted only for a version without padding, and therefore the corresponding results are not shown in Figs. 4-9. As shown in Table 5, vertical folding by a factor of 8, with internal state stored in memory, leads to the reduction in area by a factor of about 4 for Virtex 5 and about 1.5 for Stratix III, at the cost of a significant reduction in throughput, by a factor of about 16 in Virtex 5 and by a factor of about 18 in Stratix III. Thus, the throughput to area ratio decreases by a factor of 4 for Virtex 5, and a factor of 12 for Stratix III.
For Skein (see Figs. 4e and 5e), the unrolled by 4 architecture, x4, is significantly more efficient than the basic architecture, x1. At the same time, unrolling by 8 does not give any additional improvement in the throughput to area ratio. The best pipelined architectures are obtained by first unrolling basic architecture by a factor of four, and then pipelining the obtained circuit using two stages in Virtex 5, and five stages in Stratix III. Five pipeline stages are efficient in Stratix III because of an extra addition executed every fourth round, but they do not improve the overall throughput to area ratio in Virtex 5.
For SHA-2 (see Figs. 4f and 5f), none of the discussed techniques applies. The implementation of this function is already small, so reducing area is not necessary. The best way to speed up this function is by using multiple independent units of SHA-2 working in parallel. We denote this architecture by MUn, where n denotes the number of hash units.
throughput to area ratio of their best architecture, as identified above. This is because this architecture can be easily replicated, allowing for processing n streams of data in parallel. Both throughput and area will increase by a factor of n. The secondary criterion is the area of the best architecture. The smaller the area, the denser is the graph representing possible locations of a given function on the throughput vs. area graph.
a)
b)
c)
d)
e)
f)
a)
b)
c)
d)
e)
f)
Fig. 5. Throughput vs. Area graphs for multiple architectures of a) BLAKE-256, b) Groestl-256, c) JH-256, d) Keccak-256, e) Skein-256, and f) SHA-256, implemented in Altera Stratix III FPGAs. Notation: x1 – basic iterative architecture, /k(h) – horizontally folded by a factor of k, /k(v) - vertically folded by a factor of k, /k(v)-m - vertically folded by a factor of k with internal state stored in memory, xk – unrolled by a factor of k, PPLn – pipelined with n pipeline stages, (P+Q) – parallel architecture of Groestl, P/Q – quasi-pipelined architecture of Groestl, MEM – architecture of JH with round constants stored in memory, OTF – architecture of JH with round constants calculated on the fly.
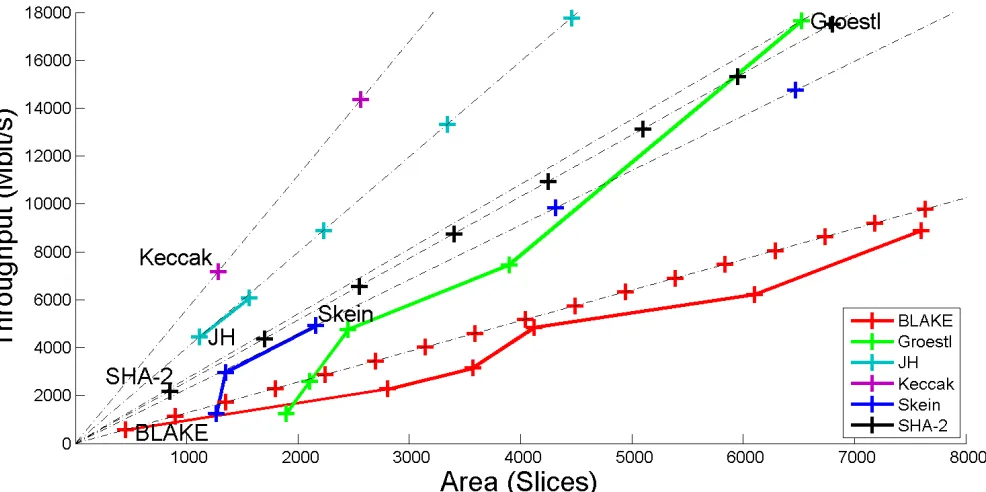
Fig. 6. Combined Throughput vs. Area graph for multiple hardware architectures of the 256-bit variants of BLAKE, Groestl, JH, Keccak, Skein, and SHA-2 implemented in Xilinx Virtex 5 FPGAs.
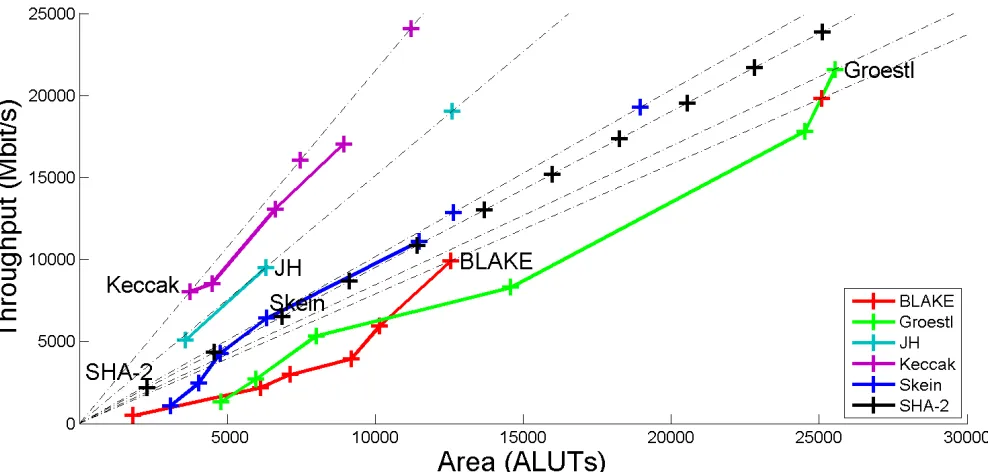
Fig. 8. Combined Throughput vs. Area graph for multiple hardware architectures of the 256-bit variants of BLAKE, Groestl, JH, Keccak, Skein, and SHA-2 implemented in Altera Stratix III FPGAs.
Fig. 9. Combined Throughput vs. Area graph for multiple hardware architectures of the 512-bit variants of BLAKE, Groestl, JH, Keccak, Skein, and SHA-2 implemented in Altera Stratix III FPGAs.
Table 2: Results for 256-bit variants with padding unit of the Round 3 SHA-3 candidates and SHA-2, implemented using all investigated architectures and four FPGA families, Virtex 5 and Virtex 6 from Xilinx, and Stratix III and Stratix IV from Altera. Notation: Tp – throughput, A – area, Tp/A – Throughput to Area Ratio. The best values of the throughput to area ratios and the best architectures for each hash function are listed in bold.
Arch Virtex 5 Virtex 6 Stratix III Stratix IV
Tp A Tp/A Tp A Tp/A Tp A Tp/A Tp A Tp/A
BLAKE-256
/4(h)/4(v)-‐m 379 230 1.65 428 200 2.14 379 992 0.38 395 1022 0.39
/4(h) 1713 1493 1.15 1957 891 2.20 1665 3238 0.51 1691 3234 0.52
/2(h) 2266 1860 1.22 2363 1391 1.70 2206 3660 0.60 2316 3680 0.63
x1 2156 2032 1.06 2174 1505 1.44 2244 4807 0.47 2322 4802 0.48
/2(h)-‐PPL2 3510 2107 1.67 3260 1690 1.93 3118 4765 0.65 3421 4765 0.72 /2(h)-‐PPL4 4675 3228 1.45 4332 2268 1.91 5238 5442 0.96 5443 5449 1.00 x1-‐PPL2 4943 3099 1.59 4542 2040 2.23 4193 5619 0.75 4483 5642 0.79
x1-‐PPL4 7510 3526 2.13 8246 2609 3.16 7787 6657 1.17 7898 6657 1.19
Groestl-256
/8(v) (P+Q) 1211 1191 1.02 1353 958 1.41 1248 3526 0.35 1172 3472 0.34 /4(v) (P+Q) 2486 1362 1.83 2901 1200 2.42 2533 4608 0.55 2391 4585 0.52 /2(v) (P+Q) 4508 1836 2.46 4915 1565 3.14 4685 7128 0.66 4597 7343 0.63 x1 (P+Q) 7081 2689 2.63 9187 2441 3.76 9760 11538 0.85 9181 11294 0.81
x1-‐PPL2 (P+Q) 13382 3172 4.22 11746 2968 3.96 13213 12572 1.05 12586 12570 1.00
x1-‐PPL4 (P+Q) 15015 4587 3.27 15624 4172 3.74 16903 13261 1.27 16126 13258 1.22
/8(v) (P/Q) 918 990 0.93 1105 750 1.47 1005 2526 0.40 966 2504 0.39 /4(v) (P/Q) 1920 1074 1.79 2099 811 2.59 1964 3061 0.64 1829 3059 0.60
/2(v) (P/Q) 3784 1302 2.91 4407 944 4.67 3925 4086 0.96 3644 4069 0.90 x1 (P/Q) 6572 2020 3.25 7071 1884 3.75 6140 7564 0.81 5640 7464 0.76
JH-256
/2(v) (MEM) 2176 1139 1.91 1978 879 2.25 2124 3636 0.58 2086 3629 0.57
x1 (MEM) 4543 1001 4.54 5086 918 5.54 5024 3383 1.49 4815 3415 1.41 x2 (MEM) 5972 1473 4.05 6883 1381 4.98 6532 5830 1.12 6099 5793 1.05 x1-‐PPL2 (MEM) 3838 2147 1.79 4840 1486 3.26 5177 4280 1.21 5233 4278 1.22
x2-‐PPL2 (MEM) 7041 2099 3.35 8409 1781 4.72 9804 6339 1.55 9526 6331 1.50
x2-‐PPL4 (MEM) 8526 3085 2.76 7928 2424 3.27 9342 7962 1.17 9207 7960 1.16 /2(v) (OTF) 2054 1194 1.72 2206 1094 2.02 2114 3766 0.56 1981 3798 0.52
x1 (OTF) 4392 1080 4.07 5177 920 5.63 5091 3569 1.43 4807 3656 1.31 x2 (OTF) 6094 1695 3.60 7198 1604 4.49 6401 6372 1.00 5878 6360 0.92
Keccak-256
x1 12745 1375 9.27 12451 1147 10.86 14624 4060 3.60 14009 4052 3.46
x1-‐PPL2 12523 2123 5.90 14942 1456 10.26 16047 5003 3.21 16878 5004 3.37 x2-‐PPL2 9610 2036 4.72 14444 2338 6.18 24242 7103 3.41 24942 7869 3.17 x2-‐PPL4 21717 3764 5.77 24644 2900 8.50 31296 9201 3.40 31691 9203 3.44
Skein-256
x1 1372 1145 1.20 1343 889 1.51 1152 3032 0.38 1269 3031 0.42
x4 3127 1245 2.51 2957 1026 2.88 2494 3960 0.63 2647 3970 0.67
x8 3168 1627 1.95 3548 1326 2.68 3193 5455 0.59 3336 5451 0.61
x4-‐PPL2 4873 2030 2.40 5679 1485 3.82 4280 4482 0.95 4688 4496 1.04
x4-‐PPL5 7077 3840 1.84 7325 2720 2.69 6869 6068 1.13 7824 6070 1.29
x8-‐PPL10 N/A N/A N/A 11118 5928 1.88 11390 11267 1.01 11485 11267 1.02 SHA-256
Table 3: Results for 512-bit variants with padding unit of the Round 3 SHA-3 candidates and SHA-2, implemented using all investigated architectures and four FPGA families, Virtex 5 and Virtex 6 from Xilinx, and Stratix III and Stratix IV from Altera. Notation: Tp – throughput, A – area, Tp/A – Throughput to Area Ratio. The best values of the throughput to area ratios and the best architectures for each hash function are listed in bold.
Arch Virtex 5 Virtex 6 Stratix III Stratix IV
Tp A Tp/A Tp A Tp/A Tp A Tp/A Tp A Tp/A
BLAKE-512
/4(h)/4(v)-‐m 575 449 1.28 625 350 1.79 495 1797 0.28 537 1791 0.30
/4(h) 2278 2805 0.81 2675 1639 1.63 2206 6124 0.36 2492 6399 0.39
/2(h) 3156 3569 0.88 3333 2608 1.28 3003 7115 0.42 3320 7114 0.47
x1 3046 3384 0.90 N/A N/A N/A 3010 9343 0.32 3387 9334 0.36
/2(h)-‐PPL2 4853 4123 1.18 4452 2882 1.54 3963 9188 0.43 4799 9177 0.52 /2(h)-‐PPL4 6225 6104 1.02 5412 3951 1.37 5938 10137 0.59 7668 10144 0.76 x1-‐PPL2 6296 5534 1.14 6430 4171 1.54 5705 10828 0.53 6356 10831 0.59
x1-‐PPL4 8882 7600 1.17 11030 5080 2.17 9908 12537 0.79 11048 12530 0.88
Groestl-512
/8(v) (P+Q) 1602 2233 0.72 1683 1726 0.98 1697 6768 0.25 1589 6723 0.24 /4(v) (P+Q) 3147 2570 1.22 3078 1952 1.58 3562 9089 0.39 3323 8916 0.37 /2(v) (P+Q) 5413 3364 1.61 6051 3078 1.97 6642 14597 0.46 6175 14263 0.43 x1 (P+Q) 8781 5448 1.61 11608 5112 2.27 12976 22239 0.58 11903 21807 0.55
x1-‐PPL2 (P+Q) 17655 6525 2.71 16218 5740 2.83 17826 24518 0.73 16363 24612 0.66
x1-‐PPL4 (P+Q) 17918 8453 2.12 16033 7391 2.17 21595 25529 0.85 20357 25530 0.80
/8(v) (P/Q) 1238 1890 0.65 1271 1358 0.94 1317 4780 0.28 1296 4774 0.27 /4(v) (P/Q) 2602 2107 1.24 2684 1459 1.84 2710 5961 0.45 2586 5887 0.44 /2(v) (P/Q) 4750 2449 1.94 5040 1797 2.80 5352 7995 0.67 5023 7896 0.64 x1 (P/Q) 7462 3895 1.92 6843 3285 2.08 8310 14578 0.57 7882 14542 0.54
JH-512
/2(v) (MEM) 2044 1145 1.79 2052 925 2.22 2124 3636 0.58 2086 3629 0.57
x1 (MEM) 4533 1125 4.03 4834 901 5.37 4309 3930 1.10 4201 3919 1.07 x2 (MEM) 6067 1561 3.89 6701 1417 4.73 6532 5830 1.12 6099 5793 1.05 x1-‐PPL2 (MEM) 3897 2244 1.74 4541 1589 2.86 5157 4537 1.14 5319 4536 1.17
x2-‐PPL2 (MEM) 8266 2223 3.72 8514 1977 4.31 9514 6297 1.51 9484 6303 1.50
x2-‐PPL4 (MEM) 6186 3645 1.70 8047 2744 2.93 9328 8084 1.15 9512 8079 1.18 /2(v) (OTF) 1985 1228 1.62 2131 1077 1.98 2114 3766 0.56 1981 3798 0.52
x1 (OTF) 4443 1114 3.99 4914 965 5.09 5091 3569 1.43 4807 3656 1.31
x2 (OTF) 5940 1664 3.57 6732 1546 4.35 6401 6372 1.00 5878 6360 0.92 Keccak-512
x1 7179 1283 5.60 7465 1052 7.10 8029 3734 2.15 7607 3723 2.04
x1-‐PPL2 7380 1774 4.16 8114 1263 6.42 8550 4484 1.91 8962 4481 2.00
x2-‐PPL2 7126 1996 3.57 N/A N/A N/A 13090 6617 1.98 12490 6580 1.90
x2-‐PPL4 13552 3428 3.95 13640 2550 5.35 17058 8934 1.91 17335 8934 1.94 Skein-512
x1 1258 1267 0.99 1446 987 1.47 1103 3086 0.36 1216 3088 0.39
x4 2972 1348 2.20 3141 1186 2.65 2493 4035 0.62 2597 4026 0.65
x8 2870 1556 1.84 3690 1454 2.54 3137 5527 0.57 3357 5536 0.61
x4-‐PPL2 4916 2157 2.28 5713 1567 3.65 4292 4756 0.90 4758 4767 1.00
x4-‐PPL5 5829 4377 1.33 7337 3160 2.32 6428 6319 1.02 7123 6324 1.13
x8-‐PPL10 5946 9032 0.66 9130 6544 1.40 11111 11485 0.97 10542 11486 0.92 SHA-512
7.
Results Without Padding
In Table 4, we investigate the effect of padding unit on the performance of selected non-pipelined architectures. Based on this table, the largest decrease in the throughput to area ratio is equal to 18%. This decrease depends on the FPGA family, and reaches the maximum of about 10% for Virtex 5, 14% for Virtex 6, 18% for Stratix III, and 15% for Stratix IV. This level variations in the throughput to area ratio do not affect the ranking of candidates as determined in Section 6.
In Tables 5 and 6, the complete set of results for implementations without padding is given. These results are important for comparison with results from other groups, as majority of results reported by other groups during the competition (and submitted to the ATHENa database [3]) concern designs with no padding unit.
Additionally, as shown in the same tables, a folded architecture with internal state stored in memory, /8(v)-m, has been implemented for JH-256 and Keccak-256, in the version without padding. For JH-256, implemented in Virtex 5 and Virtex 6, area decreases by a factor greater than 3 and throughput by a factor greater than 30, compared to the basic iterative architecture. In Stratix III and Stratix IV, area decreases by a factor of about 1.7 and throughput by a factor of about 40. Thus, this architecture is quite inefficient in both Xilinx and Altera FPGAs, and should be considered only when no other architecture fits within the area budget. For Keccak-256, implemented in Virtex 5 and Virtex 6 using the same architecture, area decreases by a factor greater than 3.5 and throughput by a factor greater than 10, compared to the basic iterative architecture. In Stratix III and Stratix IV, area decreases by a factor of about 1.5 and throughput by a factor of about 20. Thus, this architecture might be acceptable in case of Xilinx FPGAs, but is quite inefficient in case of Altera FPGAs.
Table 4: The effect of the padding unit on the performance of 5 Round 3 SHA-3 candidates in four FPGA families, Virtex 5 and Virtex 6 from Xilinx, and Stratix III and Stratix IV from Altera. Notation: Tp – throughput, A – area, Tp/A – Throughput to Area Ratio, Δ [%] – relative change in the Throughput, Area, and Throughput to Area ratio as a result of adding padding unit to the hash unit. The relative change in the throughput to area ratio has been marked in bold.
Arch Virtex 5 Virtex 6 Stratix III Stratix IV
Tp A Tp/A Tp A Tp/A Tp A Tp/A Tp A Tp/A
BLAKE-256
/2(h) 2308 1771 1.30 2226 1257 1.77 2157 3553 0.61 2337 3543 0.66
/2(h)-PAD 2266 1860 1.22 2363 1391 1.70 2206 3660 0.60 2316 3680 0.63
Δ [%] -‐1.83 5.03 -‐6.53 6.18 10.66 -‐4.04 2.25 3.01 -‐0.74 -‐0.90 3.87 -‐4.59
Groestl-256 (P/Q)
x1 6117 1795 3.41 7220 1870 3.86 6008 7386 0.81 5776 7404 0.78
x1-PAD 6572 2020 3.25 7071 1884 3.75 6140 7564 0.81 5640 7464 0.76
Δ [%] 7.44 12.53 -‐4.53 -‐2.06 0.75 -‐2.79 2.19 2.41 -‐0.21 -‐2.36 0.81 -‐3.14
JH-256 (MEM)
x1 4955 982 5.05 5412 849 6.37 5276 3221 1.64 4759 3210 1.48
x1-PAD 4543 1001 4.54 5086 918 5.54 5024 3383 1.49 4815 3415 1.41
Δ [%] -‐8.32 1.93 -‐10.06 -‐6.02 8.13 -‐13.09 -‐4.77 5.03 -‐9.33 1.17 6.39 -‐4.90
Keccak-256
x1 13337 1369 9.74 11839 1086 10.90 15493 3531 4.39 14401 3541 4.07
x1-PAD 12745 1375 9.27 12451 1147 10.86 14624 4060 3.60 14009 4052 3.46
Δ [%] -‐4.44 0.44 -‐4.86 5.16 5.62 -‐0.43 -‐5.61 14.98 -‐17.91 -‐2.72 14.43 -‐14.99
Skein-256
x4 3023 1218 2.48 3373 1005 3.36 2475 3943 0.63 2592 3936 0.66
x4-PAD 3127 1245 2.51 2957 1026 2.88 2495 3960 0.63 2647 3970 0.67
Table 5: Results for 256-bit variants without padding unit of the Round 3 SHA-3 candidates and SHA-2, implemented using all investigated architectures and four FPGA families, Virtex 5 and Virtex 6 from Xilinx, and Stratix III and Stratix IV from Altera. Notation: Tp – throughput, A – area, Tp/A – Throughput to Area Ratio. The best values of the throughput to area ratios and the best architectures for each hash function are listed in bold.
Arch Virtex 5 Virtex 6 Stratix III Stratix IV
Tp A Tp/A Tp A Tp/A Tp A Tp/A Tp A Tp/A
BLAKE-256
/4(h)/4(v)-‐m 389 231 1.69 432 182 2.38 370 924 0.40 399 935 0.43
/4(h) 1735 1437 1.21 1882 886 2.12 1695 3093 0.55 1735 3085 0.56
/2(h) 2308 1771 1.30 2226 1257 1.77 2157 3553 0.61 2337 3543 0.66
x1 2533 2279 1.11 2416 1711 1.41 2181 4620 0.47 2312 4618 0.50
/2(h)-‐PPL2 3506 2136 1.64 3178 1630 1.95 3131 4570 0.69 3409 4567 0.75 /2(h)-‐PPL4 4633 3226 1.44 4807 2407 2.00 5205 5039 1.03 5467 5042 1.08 x1-‐PPL2 4761 2976 1.60 4768 2111 2.26 4162 5436 0.77 4429 5423 0.82
x1-‐PPL4 7547 3495 2.16 8056 2530 3.18 7583 6267 1.21 8063 6271 1.29
Groestl-256
/8(v) (P+Q) 1237 1124 1.10 1371 936 1.46 1240 3306 0.38 1173 3288 0.36 /4(v) (P+Q) 2215 1208 1.83 2850 1072 2.66 2576 4528 0.57 2366 4402 0.54 /2(v) (P+Q) 4254 1734 2.45 4850 1548 3.13 5028 7444 0.68 4387 6895 0.64 x1 (P+Q) 7214 2906 2.48 8754 2395 3.65 9572 11193 0.86 8962 10961 0.82 x1-‐PPL2 (P+Q) 12479 2971 4.20 13410 2873 4.67 13166 12531 1.05 12290 12203 1.01
x1-‐PPL4 (P+Q) 16353 4177 3.91 16213 3597 4.51 16198 12885 1.26 16141 12933 1.25
/8(v) (P/Q) 951 981 0.97 1057 705 1.50 1009 2346 0.43 976 2342 0.43 /4(v) (P/Q) 1907 993 1.92 2381 859 2.77 1998 2919 0.68 1837 2902 0.63
/2(v) (P/Q) 3721 1195 3.11 4201 898 4.68 3818 3914 0.98 3701 3906 0.95 x1 (P/Q) 6117 1795 3.41 7220 1870 3.86 6008 7386 0.81 5776 7404 0.78
JH-256
/8(v)-‐m (MEM) 138 306 0.45 157 226 0.69 133 1865 0.07 118 1849 0.06 /2(v) (MEM) 2094 1009 2.08 2327 944 2.46 2131 3379 0.63 2138 3368 0.63
x1 (MEM) 4955 982 5.05 5412 849 6.37 5276 3221 1.64 4759 3210 1.48 x2 (MEM) 6149 1489 4.13 6904 1335 5.17 6418 5584 1.15 6128 5542 1.11 x1-‐PPL2 (MEM) 4711 1842 2.56 5202 1320 3.94 5463 4263 1.28 5439 4259 1.28
x2-‐PPL2 (MEM) 8289 2312 3.59 9284 2050 4.53 10116 6294 1.61 9772 6259 1.56
x2-‐PPL4 (MEM) 8526 3085 2.76 8839 2162 4.09 9927 6892 1.44 9994 6883 1.45 /2(v) (OTF) 2181 1120 1.95 1993 845 2.36 2084 3473 0.60 2035 3538 0.58 x1 (OTF) 4840 971 4.98 5255 917 5.73 5071 3388 1.50 4912 3385 1.45 x2 (OTF) 6196 1640 3.78 7046 1493 4.72 6359 6121 1.04 5817 5993 0.97
Keccak-256
/8(v)-‐m 855 354 2.41 1078 306 3.52 874 2397 0.36 813 2387 0.34
x1 13337 1369 9.74 11839 1086 10.90 15493 3531 4.39 14401 3541 4.07
x1-‐PPL2 16121 1950 8.27 18803 1474 12.76 19971 4810 4.15 19415 4807 4.04
x2-‐PPL2 17677 2390 7.40 N/A N/A N/A 25283 7107 3.56 23660 7018 3.37 x2-‐PPL4 26690 3714 7.19 29825 2748 10.85 35780 8806 4.06 35006 8803 3.98
Skein-256
x1 1179 1025 1.15 1330 858 1.55 1115 3005 0.37 1226 3003 0.41
x4 3023 1218 2.48 3373 1005 3.36 2475 3943 0.63 2592 3936 0.66
x8 2890 1492 1.94 3459 1333 2.60 3161 5432 0.58 3345 5432 0.62
x4-‐PPL2 5338 1858 2.87 6212 1628 3.82 4273 4423 0.97 4709 4446 1.06
x4-‐PPL5 6819 4130 1.65 7669 3126 2.45 6974 5941 1.17 7675 5925 1.30
x8-‐PPL10 N/A N/A N/A 12403 5447 2.28 11741 11163 1.05 11792 10992 1.07 SHA-256
Table 6: Results for 512-bit variants without padding unit of the Round 3 SHA-3 candidates and SHA-2, implemented using all investigated architectures and four FPGA families, Virtex 5 and Virtex 6 from Xilinx, and Stratix III and Stratix IV from Altera. Notation: Tp – throughput, A – area, Tp/A – Throughput to Area Ratio. The best values of the throughput to area ratios and the best architectures for each hash function are listed in bold.
Arch Virtex 5 Virtex 6 Stratix III Stratix IV
Tp A Tp/A Tp A Tp/A Tp A Tp/A Tp A Tp/A
BLAKE-512
/4(h)/4(v)-‐m 560 386 1.45 613 309 1.98 491 1680 0.29 543 1676 0.32
/4(h) 2300 2840 0.81 2646 1584 1.67 2186 5891 0.37 2442 5885 0.42
/2(h) 3264 3435 0.95 3478 2610 1.33 2928 6977 0.42 3318 6971 0.48
x1 N/A N/A N/A N/A N/A N/A 2965 9033 0.33 3323 9024 0.37
/2(h)-‐PPL2 4841 4515 1.07 4478 2879 1.56 3954 8969 0.44 4742 8959 0.53 /2(h)-‐PPL4 6171 5794 1.07 6915 4575 1.51 5991 9684 0.62 7859 9694 0.81 x1-‐PPL2 6364 5674 1.12 6606 4616 1.43 5660 10625 0.53 6351 10615 0.60
x1-‐PPL4 9567 7497 1.28 10706 5267 2.03 9980 12074 0.83 11075 12082 0.92
Groestl-512
/8(v) (P+Q) 1557 2251 0.69 1726 1773 0.97 1677 6549 0.26 1614 6510 0.25 /4(v) (P+Q) 3112 2393 1.30 3230 2113 1.53 3447 8727 0.39 3277 8750 0.37 /2(v) (P+Q) 5119 3289 1.56 5793 2971 1.95 6595 14318 0.46 6265 14207 0.44 x1 (P+Q) 10020 5588 1.79 12262 5203 2.36 13061 22062 0.59 11936 21902 0.54
x1-‐PPL2 (P+Q) 17591 6568 2.68 16114 6290 2.56 16900 24292 0.70 16114 24241 0.66 x1-‐PPL4 (P+Q) N/A N/A N/A N/A N/A N/A 21158 25515 0.83 20580 25407 0.81
/8(v) (P/Q) 1211 1722 0.70 1326 1358 0.98 1335 4598 0.29 1307 4592 0.28 /4(v) (P/Q) 2573 2036 1.26 2772 1529 1.81 2700 5786 0.47 2596 5770 0.45
/2(v) (P/Q) 4816 2336 2.06 5319 1761 3.02 5262 7763 0.68 4989 7724 0.65 x1 (P/Q) 7686 3853 1.99 8375 3630 2.31 8214 14291 0.57 8379 14620 0.57
JH-512
/8(v)-‐m (MEM) 138 307 0.45 154 228 0.68 128 1817 0.07 119 1851 0.06 /2(v) (MEM) 2052 1055 1.95 2491 996 2.50 2224 3664 0.61 2175 3660 0.59
x1 (MEM) 4882 1037 4.71 5825 931 6.26 5011 3288 1.52 5139 3294 1.56
x2 (MEM) 6203 1587 3.91 6859 1377 4.98 6630 5768 1.15 6305 5786 1.09 x1-‐PPL2 (MEM) 4635 1990 2.33 5060 1534 3.30 5361 4521 1.19 5319 4521 1.18
x2-‐PPL2 (MEM) 8183 2494 3.28 9439 2128 4.44 9881 6339 1.56 9665 6309 1.53 x2-‐PPL4 (MEM) 8107 3408 2.38 9011 2568 3.51 9456 7427 1.27 8806 7392 1.19 /2(v) (OTF) 2027 1127 1.80 2104 954 2.21 2107 3680 0.57 1982 3669 0.54
x1 (OTF) 4686 992 4.72 5181 939 5.52 5181 3557 1.46 5043 3605 1.40 x2 (OTF) 6413 1870 3.43 7128 1501 4.75 6268 6276 1.00 6032 6314 0.96
Keccak-512
/8(v)-‐m 512 355 1.44 631 316 2.00 498 2310 0.22 471 2293 0.21
x1 7612 1320 5.77 7220 1061 6.81 8526 3471 2.46 7825 3467 2.26
x1-‐PPL2 9306 1720 5.41 9619 1468 6.55 11215 4294 2.61 10816 4295 2.52
x2-‐PPL2 9915 2297 4.32 N/A N/A N/A 13389 6523 2.05 12984 6519 1.99 x2-‐PPL4 12935 3387 3.82 15661 2539 6.17 20356 8553 2.38 19300 8549 2.26
Skein-512
x1 1201 1069 1.12 1441 987 1.46 1135 3072 0.37 1229 3073 0.40
x4 3084 1418 2.17 3462 1114 3.11 2438 4006 0.61 2736 4015 0.68
x8 2832 1577 1.80 3573 1373 2.60 3121 5589 0.56 3322 5507 0.60
x4-‐PPL2 5378 2026 2.65 5943 1702 3.49 4271 4705 0.91 4682 4683 1.00
x4-‐PPL5 N/A N/A N/A 7071 3486 2.03 6670 6199 1.08 6972 6185 1.13
x8-‐PPL10 N/A N/A N/A 12176 6145 1.98 11063 11205 0.99 10802 11204 0.96 SHA-512
8.
Rankings Based on the Throughput to Area Ratio
In order to explicitly compare SHA-3 finalists against each other across four different FPGA families, we use Tables 7-10, and Figs 10 and 11.
All results presented in these comparisons concern versions of designs without padding units. This choice has been made in order to take into account results submitted by other groups, as majority of these results assume that padding is done outside of the implemented circuits.
The rankings for each FPGA family are divided along the two criteria: a) 256-bit vs. 512-bit variant, and
b) all architectures vs. single-message architectures.
As a result, four rankings are listed for each family, as shown in Tables 7-10.
The category “all architectures” means that we allow both single-message and multi-message architectures. In case two architectures offer the same Throughput to Area ratio, the priority is given to architecture with the smaller area. As a result, the multi-unit architectures, MUn, do not appear in our rankings as they offer at best the same throughput to area ratio as the basic architectures they are based on. Thus, the primary way of improving throughput to area ratio for multi-message architectures is pipelining.
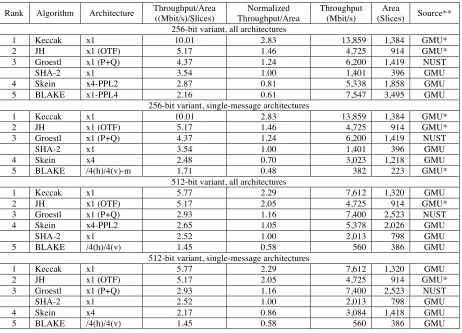
Table 7: Ranking of SHA-3 candidates for 256-bit variant in Xilinx Virtex 5 FPGA. Designs without padding, implemented using Xilinx ISE 13.1 (unless explicitly stated otherwise using *).
Rank Algorithm Architecture Throughput/Area
((Mbit/s)/Slices)
Normalized Throughput/Area
Throughput (Mbit/s)
Area
(Slices) Source**
256-bit variant, all architectures
1 Keccak x1 10.01 2.83 13,859 1,384 GMU*
2 JH x1 (OTF) 5.17 1.46 4,725 914 GMU*
3 Groestl x1 (P+Q) 4.37 1.24 6,200 1,419 NUST
SHA-2 x1 3.54 1.00 1,401 396 GMU
4 Skein x4-PPL2 2.87 0.81 5,338 1,858 GMU
5 BLAKE x1-PPL4 2.16 0.61 7,547 3,495 GMU
256-bit variant, single-message architectures
1 Keccak x1 10.01 2.83 13,859 1,384 GMU*
2 JH x1 (OTF) 5.17 1.46 4,725 914 GMU*
3 Groestl x1 (P+Q) 4.37 1.24 6,200 1,419 NUST
SHA-2 x1 3.54 1.00 1,401 396 GMU
4 Skein x4 2.48 0.70 3,023 1,218 GMU
5 BLAKE /4(h)/4(v)-m 1.71 0.48 382 223 GMU*
512-bit variant, all architectures
1 Keccak x1 5.77 2.29 7,612 1,320 GMU
2 JH x1 (OTF) 5.17 2.05 4,725 914 GMU*
3 Groestl x1 (P+Q) 2.93 1.16 7,400 2,523 NUST
4 Skein x4-PPL2 2.65 1.05 5,378 2,026 GMU
SHA-2 x1 2.52 1.00 2,013 798 GMU
5 BLAKE /4(h)/4(v) 1.45 0.58 560 386 GMU
512-bit variant, single-message architectures
1 Keccak x1 5.77 2.29 7,612 1,320 GMU
2 JH x1 (OTF) 5.17 2.05 4,725 914 GMU*
3 Groestl x1 (P+Q) 2.93 1.16 7,400 2,523 NUST
SHA-2 x1 2.52 1.00 2,013 798 GMU
4 Skein x4 2.17 0.86 3,084 1,418 GMU
5 BLAKE /4(h)/4(v) 1.45 0.58 560 386 GMU
* Results obtained using Xilinx ISE v.12.4
As shown in Table 7, for Virtex 5, the ranking of SHA-3 finalists is identical in all categories. Three candidates, Keccak, JH, and Groestl consistently outperform SHA-2. The difference between Keccak and JH is very significant for the 256-bit variants of both functions (almost a factor of 2), and substantially decreases for the 512-bit variants (because of the smaller message block size in 512 vs. Keccak-256). The advantage of Groestl over SHA-2 also decreases for the 512-bit variants of both functions. For the 256-bit variants of the algorithms, only Skein and BLAKE can benefit from pipelining (in terms of the increase in the throughput to area ratio). For the 512-bit variants of the finalists, none algorithm was shown to benefit from pipelining.
As shown in Table 8, for Virtex 6, the ranking of the five SHA-3 candidates is the same as in Virtex 5, and identical in all categories. Keccak is the only candidate that outperforms SHA-2 for the 256-bit variants of the compared functions. For the 512-bit variants, the performance of Keccak decreases, and becomes comparable to that of JH. Both Keccak and JH outperform SHA-2 in terms of the throughput to area ratio. Groestl, Skein, and BLAKE consistently lag behind SHA-2.
Table 8: Ranking of SHA-3 candidates for 256-bit variant in Xilinx Virtex 6 FPGA. Designs without padding, implemented using Xilinx ISE v.13.1 (unless explicitly stated otherwise using *).
Rank Algorithm Architecture Throughput/Area
((Mbit/s)/Slices)
Normalized Throughput/Area
Throughput (Mbit/s)
Area
(Slices) Source**
256-bit variant, all architectures
1 Keccak x1 14.94 2.19 13,670 915 NUST
SHA-2 x1 6.84 1.00 1,634 239 GMU
2 JH x1 (MEM) 6.73 0.98 5,700 847 GMU*
3 Groestl x1 (P+Q) 6.56 0.96 9,620 1,467 NUST
4 Skein x4-PPL2 3.82 0.56 6,212 1,628 GMU
5 BLAKE x1-PPL4 3.18 0.47 8,056 2,530 GMU
256-bit variant, single-message architectures
1 Keccak x1 14.94 2.19 13,670 915 NUST
SHA-2 x1 6.84 1.00 1,634 239 GMU*
2 JH x1 (MEM) 6.73 0.98 5,700 847 GMU*
3 Groestl x1 (P+Q) 6.56 0.96 9,620 1,467 NUST
4 Skein x4 3.36 0.49 3,373 1,005 GMU
5 BLAKE Lightweight 2.86 0.42 475 166 GMU
512-bit variant, all architectures
1 Keccak x1 6.89 1.48 6,990 1,015 NUST
2 JH x1 (MEM) 6.26 1.35 5,825 931 GMU
SHA-2 x1 4.64 1.00 2,381 513 GMU*
3 Groestl x1 (P+Q) 3.89 0.84 9,170 2,359 NUST
4 Skein x4-PPL2 3.49 0.75 5,943 1,702 GMU
5 BLAKE x1-PPL4 2.03 0.44 10,706 5,267 GMU
512-bit variant, single-message architectures
1 Keccak x1 6.89 1.48 6,990 1,015 NUST
2 JH x1 (MEM) 6.26 1.35 5,825 931 GMU
SHA-2 x1 4.64 1.00 2,381 513 GMU*
3 Groestl x1 (P+Q) 3.89 0.84 9,170 2,359 NUST
4 Skein x4 3.11 0.67 3,462 1,114 GMU
5 BLAKE /4(h)/4(v)-m 1.98 0.43 613 309 GMU
* Results obtained using Xilinx ISE v.12.4
Table 9: Ranking of SHA-3 candidates for 256-bit variant in Altera Stratix III FPGA. Designs without padding, implemented using Altera Quartus II v.11.1.
Rank Algorithm Architecture Throughput/Area
((Mbit/s)/Slices)
Normalized Throughput/Area
Throughput (Mbit/s)
Area
(ALUTs) Source
256-bit variant, all architectures
1 Keccak x1 4.39 2.54 15,493 3,531 GMU
SHA-2 x1 1.73 1.00 1,656 959 GMU
2 JH x1 (MEM) 1.64 0.95 5,276 3,221 GMU
3 Groestl x1-PPL4
(P+Q) 1.26 0.73 16,197 12,885 GMU
4 BLAKE x1-PPL4 1.21 0.70 7,583 6,267 GMU
5 Skein x4-PPL5 1.17 0.68 6,974 5,941 GMU
256-bit variant, single-message architectures
1 Keccak x1 4.39 2.54 15,493 3,531 GMU
SHA-2 x1 1.73 1.00 1,656 959 GMU
2 JH x1 (MEM) 1.64 0.95 5,276 3,221 GMU
3 Groestl /2(v) (P/Q) 0.98 0.56 3,818 3,914 GMU
4 Skein x4 0.63 0.36 2,475 3,943 GMU
5 BLAKE /2(h) 0.61 0.35 2,158 3,553 GMU
512-bit variant, all architectures
1 Keccak x1-PPL2 2.61 2.45 11,215 4,294 GMU
2 JH x2-PPL2 1.56 1.46 9,881 6,339 GMU
3 Skein x4-PPL5 1.08 1.01 6,670 6,199 GMU
SHA-2 x1 1.07 1.00 2,128 1,995 GMU
4 Groestl x1-PPL4
(P+Q) 0.83 0.78 21,158 25,515 GMU
5 BLAKE x1-PPL4 0.83 0.77 9,980 12,074 GMU
512-bit variant, single-message architectures
1 Keccak x1 2.46 2.30 8,526 3,471 GMU
2 JH x1 (MEM) 1.52 1.43 5,011 3,288 GMU
SHA-2 x1 1.07 1.00 2,128 1,995 GMU
3 Groestl /2(v) (P/Q) 0.68 0.64 5,262 7,763 GMU
4 Skein x4 0.61 0.57 2,438 4,006 GMU
5 BLAKE /2(h) 0.42 0.39 2,928 6,977 GMU
As shown in Table 9, for Stratix III and 256-bit variants o the algorithms, the ranking remains almost the same as in Virtex 5 and Virtex 6. Keccak is the only candidate that outperforms SHA-2. Groestl, BLAKE, Skein have efficient pipelined architectures, with almost identical throughput to area ratio. For the 512-bit variants, Keccak and JH are the only candidates that outperform SHA-2 in both categories. In the category of all architectures, Skein has almost identical performance as SHA-2, and Groestl almost identical performance to BLAKE. For the single-message architectures, the differences between the algorithms increase, and the ranking of the candidates becomes the same as in case of Virtex 5 and Virtex 6.
The results for Stratix IV, shown in Table 10, are very similar to those for Stratix III. The primary difference is that for the 512-bit variants of the algorithms, and single-message architectures, Skein jumps ahead of Groestl. For the 512-bit variants and all architectures, Groestl lags behind BLAKE, and becomes least efficient algorithm.
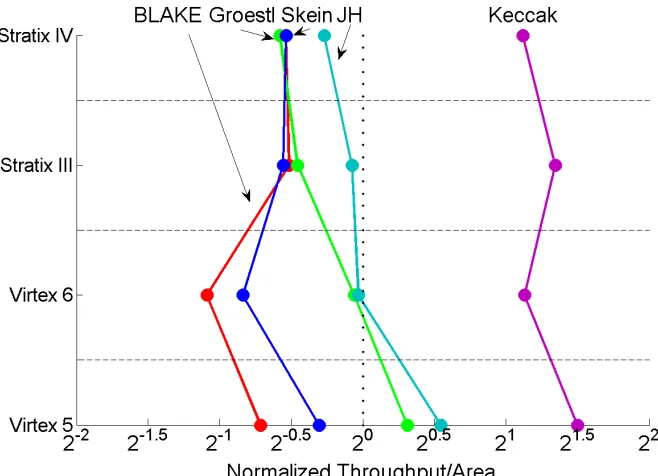
quite well correlated, with normalized results for Virtex 5 consistently higher than the corresponding normalized values for Virtex 6. These smaller normalized values for Virtex 6 come primarily from the fact that SHA-2 is implemented more efficiently in Virtex 6. On the other hand, in terms of absolute values of the throughput to area ratios, these ratios are consistently higher, as expected, in Virtex 6 for all investigated algorithms (as demonstrated by Tables 7 and 8).
The results for Altera families seem to differ from the results for Xilinx families in several important aspects. In particular, for the 256-bit variants and single-message architectures (see Fig. 10b), the performance gap between JH and Groestl widens in Altera families, while on the other hand BLAKE catches up with Skein. BLAKE, Skein, and Groestl, all benefit from pipelining in Altera families (see Fig. 10a). Additionally, these three algorithms have almost the same normalized throughput to area ratio for both Altera families. For the 512-bit variants of the algorithms and all architectures, Stratix IV seem to be particularly unsuitable for Groestl, which drops from the 3rd position in Xilinx families, to the last 5th position in Stratix IV (see Fig. 11a).
Table 10: Ranking of SHA-3 candidates for 256-bit variant in Altera Stratix IV FPGA. Designs without padding, implemented using Altera Quartus II v.11.1 (unless explicitly stated otherwise using *).
Rank Algorithm Architecture Throughput/Area
((Mbit/s)/Slices)
Normalized Throughput/Area
Throughput (Mbit/s)
Area
(ALUTs) Source
256-bit variant, all architectures
1 Keccak x1 4.07 2.17 14,401 3,541 GMU
SHA-2 x1 1.87 1.00 1,798 959 GMU
2 JH x2-PPL2
(MEM) 1.56 0.83 9,772 6,259 GMU
3 Skein x4-PPL5 1.30 0.69 7,676 5,925 GMU
4 BLAKE x1-PPL4 1.29 0.69 8,063 6,271 GMU
5 Groestl x1-PPL4
(P+Q) 1.25 0.67 16,141 12,933 GMU
256-bit variant, single-message architectures
1 Keccak x1 4.07 2.17 14,401 3,541 GMU
SHA-2 x1 1.87 1.00 1,798 959 GMU
2 JH x1 (MEM) 1.52 0.81 4,876 3,218 GMU*
3 Groestl /2(v) (P/Q) 0.95 0.51 3,701 3,906 GMU
4 Skein x4 0.66 0.35 2,621 3,968 GMU*
5 BLAKE /2(h) 0.66 0.35 2,337 3,543 GMU
512-bit variant, all architectures
1 Keccak x1-PPL2 2.52 2.11 10,816 4,295 GMU
2 JH x1 (MEM) 1.56 1.31 5,139 3,294 GMU
SHA-2 x1 1.19 1.00 2,378 1,996 GMU
3 Skein x4-PPL5 1.13 0.95 6,972 6,185 GMU
4 BLAKE x1-PPL4 0.92 0.77 11,075 12,082 GMU
5 Groestl x1-PPL4
(P+Q) 0.81 0.68 20,580 25,407 GMU
512-bit variant, single-message architectures
1 Keccak x1 2.26 1.89 7,825 3,467 GMU
2 JH x1 (MEM) 1.56 1.31 5,139 3,294 GMU
SHA-2 x1 1.19 1.00 2,378 1,996 GMU
3 Skein x4 0.68 0.57 2,736 4,015 GMU
4 Groestl /2(v) (P/Q) 0.65 0.54 4,989 7,724 GMU
5 BLAKE /2(h) 0.48 0.40 3,318 6,971 GMU
a) 256-bit variant, all architectures
b) 256-bit variant, single-message architectures
Fig. 10. Rankings of SHA-3 finalists in terms of the Normalized Throughput/Area Ratio for a) all architectures (including single-message and multi-message architecture),
b) single-message architectures.
a) 512-bit variant, all architectures
b) 512-bit variant, single-message architectures
Fig. 11. Rankings of SHA-3 finalists in terms of the Normalized Throughput/Area Ratio for a) all architectures (including single-message and multi-message architecture),
b) single-message architectures.
9. Correlation between FPGA results and ASIC results
The number of hardware architectures of SHA-3 candidates implemented in ASICs to date is very small compared to the number of architectures implemented in FPGAs. Typically, only the best non-pipelined architectures for the 256-bit variants of the SHA-3 finalists are reported [18,19,20]. At the same time, multiple applications use ASICs as a primary way of implementing cryptographic transformations, and this trend is likely to continue in the future. Therefore, it is very interesting to see, whether there exist any strong correlation between results obtained for the ASIC and FPGA implementations of the same architectures. In our experiment, performed in collaboration with the group from ETH Zurich, we have implemented selected architectures for all SHA-3 candidates and SHA-2 using standard-cell CMOS 65nm UMC ASIC technology (UMC65LL) offered through Europractice MPW services, and using a 65 nm high-performance Altera FPGA family Stratix III. The selected architectures included the following non-pipelined architectures: basic iterative architectures, x1, for Keccak and SHA-2, basic iterative architecture with round constants computed on the fly, x1 (OTF), for JH, basic iterative parallel architecture of Groestl (P+Q), horizontally folded two times architecture of BLAKE, /2(h), and the unrolled 4 times architecture of Skein, x4.
a) 65nm ASIC b) 65nm Stratix III FPGA
c) d)
All architectures have been designed for the 256-bit variants of the functions, without padding units, and with wide input and output interface (512 or 1088 bits at the input and 256 bits at the output). Exactly the same VHDL source codes have been synthesized, mapped, placed and routed using both technologies. The results, normalized to the results for SHA-2, are presented in Fig. 12. A very good correlation between normalized throughput and normalized area in both technologies have been observed. Ranking in terms of throughput is identical in both technologies. In terms of area, the biggest difference is a relatively smaller area of BLAKE in ASIC technology. In Stratix III FPGAs, JH and BLAKE have almost the same area, in ASIC BLAKE is about 20% smaller than JH.
The biggest difference appears in terms of the throughput to area ratio, where BLAKE moves from the 4th position in tie with Skein in Stratix III to the 3rd position, ahead of Groestl for ASIC. Overall correlation is however very good and indicates that evaluations using Altera FPGAs are likely to give similar results to the evaluations using ASICs fabricated using equivalent technology. Interestingly, similar comparison using Xilinx Virtex 5 FPGAs results in much worse correlation.
10.
Results for Implementations using Embedded Resources of FPGAs
The study of the impact of embedded resources on hardware implementations of the SHA-3 candidates has been performed for both non-pipelined (single-message) and pipelined (multi-message) architectures, with padding unit.
The influence of embedded resources on the performance of non-pipelined architectures of all 14 Round 2 candidates has been reported first in [37]. Here, we narrow down this study to five SHA-3 finalists, and we implement all of them using the most efficient non-pipelined and pipelined architectures with padding unit.
The numerical effect of using embedded resources in Xilinx Virtex 5 and Altera Stratix III in non-pipelined architectures is summarized in Tables 11-14. In Tables 11 and 12, we have tabulated results for all logic-only implementations, and the corresponding implementations with embedded resources. The relative improvement in terms of Throughput, Area (in CLB slices for Virtex 5, and ALUTs for Stratix III), and Throughput to Area ratio is reported.
None of the final candidates can take advantage of DSP units, because none of them uses multiplication. An attempt to use DSP units for the implementation of a 64-bit addition in Skein, resulted in very inefficient implementations in both Virtex 5 and Stratix III. Similarly, an attempt to use DSP units for the implementation of addition in BLAKE resulted in quite inefficient implementations (not reported in Tables 11 and 12).
Block memories can be used in implementations of BLAKE, Groestl, JH, and Keccak. Based on the results presented in Tables 11 and 12, BLAKE and Groestl benefit most from using embedded memories, with the improvement in the Throughput to Area ratio higher for BLAKE in Virtex 5 FPGAs, and higher for Groestl in Altera Stratix III FPGAs. In Fig. 13, we show the implementation of the Permute transformation using block memories in BLAKE. In Fig. 16, we demonstrate the use of block memories to implement Groestl using a T-box based architecture [36,37].
A relatively small drop (< 15%) in throughput was observed for majority of the candidates. The three exceptions were JH on Virtex 5, with the drop of about 33%, and Skein on Virtex 5 and Stratix III, with the drop of approximately 40%. Skein specifically suffered from the lack of support for a 64-bit addition in DSP units of Virtex 5 and Stratix III.
Area, measured in the number of reconfigurable logic resources (CLB slices for Virtex 5 and ALUTs for Stratix III), decreased the most for BLAKE and Groestl, with BLAKE benefiting more on Virtex 5, and Groestl benefiting more on Stratix III. In all remaining cases, the decrease was smaller than 20%, and in case of Keccak and Skein implemented on Stratix III FPGAs, the amount of reconfigurable logic even increased.