JEEECCS, Volume 2, Issue 3, pages 35-40, 2016
A Software Application for the Statistical
Control Used in Quality Engineering
Corina Savulescu
Department of Electronic, Computers and Electrical Engineering
University of Pitesti Pitesti, Romania [email protected]
Dumitru Brebeanu
Department of Electronic, Computers and Electrical Engineering
University of Pitesti Pitesti, Romania [email protected]
Abstract – The quality concept involves all activities ensuring that a product meets all fabrication requirements. The quality tests validate the performance of a product to perform reliably its tasks. In this paper, we present the implementation of a software solution for tests used in statistical control. We designed an application for either personal computer or mobile phone that will improve procedures for quality engineering.
Keywords - statistical control, quality engieneering, software application
I. INTRODUCTION
The statistical control is base on a mathematical report carried out in a previous step. This method uses the information provided by a sample, which is subsequently generalised to the entire lot. As a prerequisite condition, the sample has to be representative for the entire lot studied. [1]
The STAS 6085/72 standard recommends three methods for sample selection, based on:
● random numbers list; ● blind extraction; ● multi-step procedure.
The control based on the products attributes is used when the features to be checked are measurable or not, but the value of these features must meet an imposed tolerance range.
To make a decision on the quality of a controlled lot (accepting or rejecting decision), it is essential to calculate the following specific parameters:
● the size of the sample to be checked – n;
● the maximum number of faults admitted in the sample to accept the lot – A;
● the minimum number of faults in the sample above which the lot is rejected – R.
In order to calculate these three parameters, we created specific software, specially designed for this purpose. This software will use the following input data:
● N = the lot size; the lot components need to be as homogenous as possible.
●NC = the control level; there are seven standardized
levels. The first control levels (S1-S4) are specific levels and the next three (I-III) is control levels of
When the control level is moving from level S1to III, the sample size is increase.
Therefore, when the control level is increase, the quality also is increase.
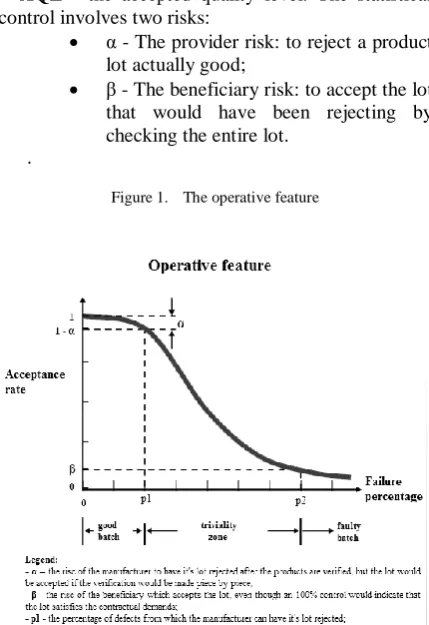
● AQL - the accepted quality level. The statistical control involves two risks:
α - The provider risk: to reject a product lot actually good;
β - The beneficiary risk: to accept the lot that would have been rejecting by checking the entire lot.
.
Figure 1. The operative feature
● Rigorousness level of the control – is relating to
the sample size and the number of faults needed in order to reject the lot. The following levels of rigorousness apply normal, severe or low. In the usual practice, the “normal” level is applied. However, if five successive lots are rejected under this level, it is necessary to shift the rigorousness level to the “severe” control. In this situation, we use smaller values for accepted (A) and rejected (R) parameters. If there is previous information on products’ quality, the rigorousness level can be shift to “low” control.
● The type of test- can be:
- single: the decision to accept or reject the lot is
- double: one or two samples are extracted, after which a decision is made on accepting or rejecting the lot or on the need of another extraction;
- multiple: one, two or more samples are extracted;
based on the quality of each sample, we decide to accept or reject the lot or to make another extraction; the maximum number of extractions is set to seven.
Here we present this software application specially designed to help the statistical control during lots’ testing.
II. THE SOFTWARE APPLICATION
We designed a software application accessed through a web portal able to calculate the specific parameters used in the quality control: n, A, and R, based on input data decided beforehand. This application implemented in HTML/CSS with JQuery, is base on Bootstrap 3, which makes it “responsive” (the application can be also use on mobile phones with “Android” operating system).
This application can be open in any browser (Google Chrome, Mozilla Firefox, and Internet Explorer) available for personal computers (PC). To open the application on a PC, one must access the folder where the executable file “index.html” is situated and double click on the icon. This makes launching the application in the browser installed on that PC. [2]
Figure 2. The installing of the application for PC
On the mobile phone, we need first to install the application “Open in Browser”; then, this application can be open using any browser on the device.
Figure 3. The installing of the application for mobile phone
A. The application for PC
This application has five input data ( N, Nc, AQL, Rigorousness level of the control and The type of test).
The application for PC has a graphical interface like in Fig. 4. Here, the user will specified the values for those five input parameters for this test.
In next step, are determinate those three values for output parameters from specifically correlation between elements from database.
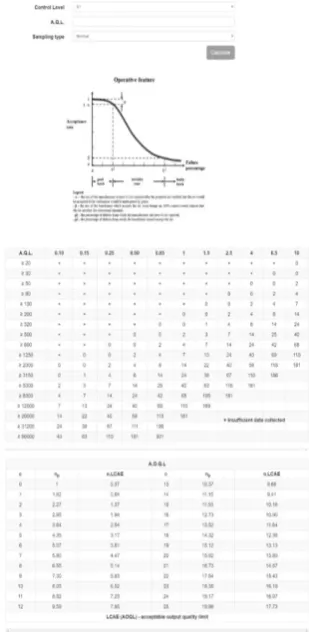
The most important element for a statistical control is the value for AQL.
Two of output data are the maximum number of faults admitted in the sample to accept the lot – A and the minimum number of faults in the sample above which the lot is rejected – R.
There is a math addiction between those parameters.
For the single test: R=A+1, and for double test or multiplying test, this addiction is applied only for the last pair of values.
Only for reduced test this relation is not exist, because this test is make in specific conditions.
B. The application for mobile phone
The graphical interface of the application for mobile phone is present in Fig. 5.
Figure 5. The graphical interface of the application for mobile phone
III. CALCULATING THE SPECIFIC PARAMETERS FOR STATISTICAL CONTROL
We present below the use of the application to calculate the parameters for different types of tests.
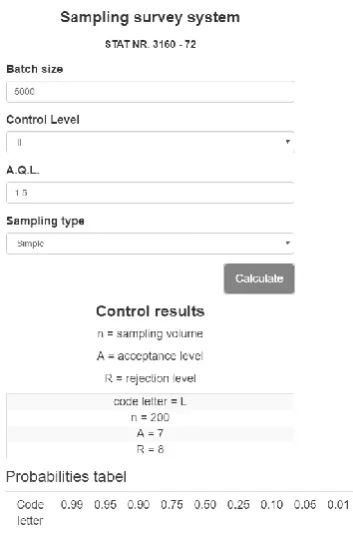
Single test
Consider a lot of a size of N = 5000. Starting from the premise that secondary faults exist in the lot, we set a value of AQL=1.5 and a control level of NC = II, and we want to calculate the sample size (n) and the level for accepting (A) or rejecting (B) the lot. First, we specify the input parameters, as in Fig.6: N - the lot size AQL - the acceptable quality level
NC - the control level
Figure 6. The input data for the single test
After we specified the input parameters, the operator can click on the button “Calculate”. This will trigger the pop-up of the output data (Fig.7.).
n - the sample volume A - the number of acceptance R -the number of rejection
Double test
Consider a lot of a size of N = 70000. Starting from the premise that secondary faults exist in the lot, we set a value of AQL=10 and a control level of NC =
I, and we want to calculate the sample size (n) and the level for accepting (A) or rejecting (B) the lot. First, we specify the input parameters, as in Fig.8: N - the lot size AQL - the acceptable quality level
NC - the control level
Figure 8. The input data for double test
After we specified the input parameters, the operator can click on the button “Calculate”. This will trigger the pop-up of the output data (Fig.9.).
n - the sample volume A - the number of acceptance R -the number of rejection
Figure 9. The output data for double test
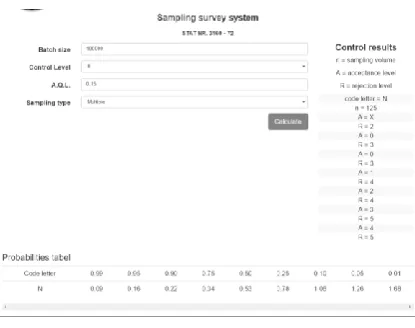
The multiple tests
In this example, the lot size is N = 100000. Starting from the premise that secondary faults exist, we set the value for AQL=0.15 and the control level NC = II as in Fig.5. We calculate the sample size (n) and the level for accepting (A) or rejecting (R) the lot as in Fig. 10.
Figure 10. The input data for multiple test
The normal severe test
In this example, the lot size is N = 5000. Starting from the premise that that secondary faults exist, we set the value for AQL=1.5 and the control level NC =
II (Fig. 10.). We calculate the sample size (n) and the level for accepting (A) or rejecting (R) the lot. [4]
Figure 12. The input data for severe normal test
In next picture, we can see a math addiction between A and R.
This test can be use when five consecutive tests for the same producer indicated a fault result.
Figure 13. The experimental results for severe test
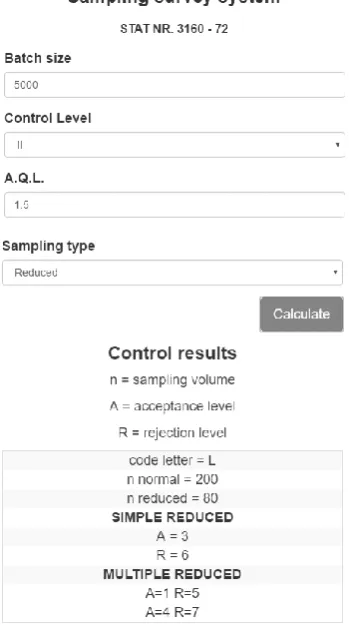
The normal reduced test
In this example, the lot size is N = 5000. Starting from the premise that that secondary faults exist, we set the value for AQL=1.5 and the control level NC =
II (Fig. 12.). We calculate the sample size (n) and the level for accepting (A) or rejecting (R) the lot.
Figure 14. The input data for reduced test
In next picture, we can see that between A and R does not any mathematical relation, because this is a special test. This is use when we know more information about the producer and we are according a credit for this producer.
CONCLUSION
The quality assurance has a special importance in all aspects of life. If a single element involved in such a complex system does not meet the required quality standards, it can result in a malfunction of the system.
The statistical control at reception is one of the very important steps in determining the products’ quality. There are many methods for meeting this goal, but we proposed and designed an online software application to resolve this issue. Among the important advantages of our application, we can enumerate the use on either personal computer or mobile phone, easiness to use, and the need of minimal hardware and software resources.
This application will be used to quality engineering laboratories and it is develop in collaboration with the students from Electronics profile from the University of Pitesti.
REFERENCES
[1] M. Dragomirescu, O. Dragomirescu, C. Savulescu - Fiabilitatea sistemelor electronice, Indrumar de laborator, Ed. Univ. Pitesti, 1998
[2] Ganciu T- Elemente de statistica si fiabilitate, Ed. “Gh. Asachi” Iasi, 2002I. S. Jacobs and C. P. Bean
[3] Pecht, M., Bordelon, I. – Electronic Hardware Reability, CRC Press LLC,
[4] M. Iorgulescu- Study of three-phase bridge rectifier diagnosis based on output voltage and current analysis, Advanced Topics in Electrical Engineering (ATEE), 2013 8th International Symposium on , 23-25 May 2013, Page(s):1 - 6 , Print ISBN: 978-1-4673-5979-5 , Publisher: IEEE
[5] Tian, J. and Nguyen, A. (1999). Statistical web testing and reliability analysis. In Proc. 9th Int. Con$ on Software Quality, pp. 263-274, Cambridge, MA.
[6] Biffl, S. and Halling, M. (2003). Investigating the defect detection effectiveness and cost benefit of nominal inspection teams. IEEE Trans. on Software Engineering, 29(5):385- 397.