COMPARISON OF DEGRADATION OF METHYLENE BLUE
DYE BY ZnO, N DOPED ZnO AND IRON ORE REJECTS
Vrinda Borker
[a], Rajashri Karmali
[b]and Koyar Rane
[c]Keywords: dye degradation; zinc oxide; N-doped ZnO; iron ore reject; methylene blue
Textile effluent containing unused dye when released in surroundings pollutes water bodies. It requires processing before disposal. Iron ore reject created during mining creates environmental pollution but contains minerals of technological importance. It has ~30-50 % iron in the form of γ-Fe2O3, α-Fe2O3 andFe3O4 is wasted if thrown in fields, so can be used to degrade organic dyes. Mineralization of methylene blue,
MB a model dye is carried out using photocatalyst either iron ore reject, synthesized ZnO or ZnO1-xNx and the results are compared. ZnO is
synthesised from oxalate and nitrogen doped ZnO from hydrazinated oxalate precursors. FTIR study of zinc complexes indicates formation of precursors and XRD of decomposed complexes reveal formation of zinc oxide with wurtzite structure. The presence of nitrogen in ZnO 1-xNx is confirmed by chemical estimation and XPS studies. SEM reveals the particle size of ZnO1-xNx ~69 nm and ZnO ~0.5-1µm. ZnO1-xNx
absorbs in the visible region and ZnO in UV region. Band gap energy calculated using Diffuse reflectance Spectrum is 2.48 eV for the former, 3.19eV for the later and 2.38 eV for ore reject. Mineralizing property of ore reject, ZnO and ZnO1-xNx are compared by electrons
spray ionisation mass spectrometry study (ESI-MS) of degradation products, COD measurement and CO2, NO3- and SO4-2 estimation.
Reusability study, kinetic study of degradation of MB dye using photocatalysts and ESI-MS study of degraded products of MB reveal better efficacy of iron ore rejects amongst three. Thus efficiency of iron ore reject > ZnO1-xNx. > ZnO as photocatalyst.
* Corresponding Author Fax: +9108322462315, Email: [email protected]
[a*] Dhempe college of Arts and Science, Panaji Goa, 403001, India.
[b] Department of Chemistry, Government College of Arts, Science and Commerce, Khandola, Goa, 403107, India [c] Rani Chennamma University, Belgaum 591156, India
Introduction
The dyes present in textile effluent pollute the water bodies. Materials like agricultural waste, ash, oxides of zinc, titania, iron1-9 etc. are used in waste treatment of industrial
effluent. The oxides are also used in degradation of hazardous gases, removal of organic pollutants and inhibition of undesirable microorganisms from water.10 Zinc
and titanium oxides are used as photocatalyst in organic dye degradation using UV radiation of ~378 nm. Zinc oxide is a semiconductor with an average bandgap of 3.37 eV and has varied applications.11 It generates electron–hole pairs on
exposure to ultraviolet radiations. However, sunlight consists ~2 % UV, limits the use of solar radiation for the photodegradation. Cation/anion doping of oxides is tried to enhance the photocatalytic properties.12 Increased
photocatalytic activity under visible light is mostly due to the synergistic effect of substantial nitrogen doping, high surface area and presence of oxygen vacancy in oxides.13
Zinc oxide when doped with nitrogen replaces oxygen from the lattice forming ZnO1-xNx (x≤ 0.15).14Decomposition of
hydrazinated zinc oxalate forms yellow
ZnO
1-xN
x (absorbs in the visible region of the sunlight).15 Hydrazine modifiedprecursors yield spinels, perovskites with large surface area.15-19 ZnO
1-xNx obtained from hydrazinated oxalate has
surface area ~11.8 m2 g-1 and found to be good bactericidal
agent effective against E. coliin our earlier work.20 In the
present investigation it is used for dye degradation.
The pollution in mining area is mainly because of ore reject: material remaining after beneficiation of the ore. These rejects/tailings are generally stored in the pits developed during mining. During rains they flow in the fields and ruin crops. They contain more than 40 % Fe which is wasted. We used iron ore reject for degradation of model organic dye methylene blue (MB) giving rejects a value addition.21
Methylene blue (MB belongs to thiazine class of dyes) is difficult to decompose under visible light and is chosen as a model dye to evaluate photocatalysis.
Present study aims at comparison of MB degradation results using iron ore, zinc oxide and N doped zinc oxide. So oxalate and hydrazinated oxalate of zinc are synthesized, analysed and decomposed to yield ZnO and ZnO1-xNx.
These oxides as well as iron ore reject are characterized and their efficacy is tested by photo-catalytic degradation of MB. Photodegradation products generated during investigation are compared to understand the relative efficacy of three photocatalysts.
Experimental
Synthesis of zinc oxide precursor
Characterization of precursors and oxides
Standard chemical analysis, Infrared analysis (Shimadzu IR Prestige 21), TG/DTA studies (STA 409 PC LUXX-NETZCH) and isothermal weight loss study are carried out to fix formula for the zinc oxalate and its hydrazinated precursor. The decomposition temperature of both the precursors are obtained by TG/DTA recorded from room temperature to 1000 oC (heating rate-10K/min). The
precursors are decomposed at ~700 oC to obtain zinc oxides.
Phase identification of the metal oxide is carried out by X-ray diffraction (Rigaku Powder X-X-ray diffractometer using CuKα radiation, =1.5418 Å). Scanning electron
micrographs (SEM) of oxides are obtained on JEOL JSM – 5800.
Nitrogen analysis is made on HIROBA EMGA 2800. The diffuse reflectance spectra (DRS) of oxides are recorded on UV-2401-Rev A 6700 with diffuse reflectance accessory to determine the absorption in the range of 200-800 nm. BaSO4
is used as reference. The bandgap energies are calculated using equation: Band gap (Eg) in eV=1239.8/max. (max. is
maximum wavelength of absorbtion from differential plots of reflectance spectra).
X ray photoelectron spectra, XPS is obtained at 298 K using MgK radiation on a VG Microtech Multilab ESCA 3000 spectrometer.
Characterization of iron ore reject
The various studies carried out of iron ore reject such as chemical analysis by standard methods,22 infrared analysis
by Shimadzu IR Prestige 21, elemental analysis by EDS, diffuse reflectance spectrum (DRS) by UV-visible spectrophotometer (Shimadzu UV-2401-Rev A 6700) and saturation magnetization measurement by Satmagan (Saturation Magnetization Analyser) Model 135 of Corrigan make. The phase identification of the metal oxides present in reject is carried out by X-ray diffraction (Rigaku Powder X-ray diffractometer) and Scanning electron micrographs (SEM) by JEOL JSM – 5800.
Photodegradation studies
Photodegradation or decolorization of an aqueous solution of methylene blue (MB), was monitored spectrophotometrically (Shimadzu UV-2401-Rev A 6700) at λmax = 665 nm. The solution of MB was maintained at
neutral pH. 50 mL aqueous solution of MB dye (0.5x10⁻⁴ M)
with 200 mg of catalyst (ZnO or ZnO1-xNx or iron ore reject)
added was exposed to sunlight. 2 mL of test solution was filtered after every 30 minutes of sunlight exposure and tested on spectrophotometer. Simultaneously solution of MB, without the catalyst was also exposed to sunlight and checked on spectrophotometer after every 30 minutes (to check photolysis). Solar light intensity and the power generated were measured every 30 minutes using Luxmeter LX-101 and solar kit of TATA BP Solar Bangalore, India respectively. The average light intensity during the experiment was 300 to 724 lux units. The power was 0.24 W cm-1 to 0.52 W cm-1.
Chemical and ESI-MS studies of the photodegradation products of methylene blue
The chemical oxygen demand (COD) test allows measurement of organic waste in water in terms of the total quantity of oxygen required for the oxidation of organic matter to CO2 and water.
COD of MB solution during degradation is measured by the standard K2Cr2O7 method.23 The percentage of MB
degraded or chemical oxygen demand removal (, %) is calculated according to the equation,
Co is the initial chemical oxygen demand (mg L-1) and
C is the chemical oxygen demand after treatment (mg L-1).
The concentrations of nitrate ions, NO3-, sulfate ions,
SO42- and free CO2 (mg L-1) are tested after complete
de-colorization of MB by standard chemical methods.24, 25 The
decolorized solution is extracted with chloroform and the residue obtained after drying is dissolved in methanol and products are analyzed by electrospray ionization mass ESI-MS using an electrospray/quadrupole/time-of-flight (QTOF) mass spectrometer (QstarXL, MDS Sciex).
Zinc oxides and iron ore rejects are washed and dried after use and then reused for degradation. The reusability is tested three times.
Results and discussion
We confirm formation of zinc oxalate and hydrazinated zinc oxalate from infra red studies (Fig.1) of precursors. The band positions are observed at 1300, 1654 cm-1 due to v
s
(o-c-o) and vas (o-c-o) respectively. A broad band between
3000 to 3600 cm-1 is due to v (OH).26-28 Hydrazine linkage is
developed with band position between 1130-1200 cm-1 due
to NH2) and between 3100-3500 cm-1 due to v(N-H)
stretching in hydrazinated zinc oxalate.
Figure 1. FTIR spectra of zinc oxalate and hydrazinated zinc oxalate
0
0 100C C
C
Table 1. Hydrazine content, oxalate content and weight loss study of precursors
TG (Fig. 2) showed major weight loss of ~60 % till 600
oC in both precursors. he endotherms and exotherms till 600 oC in DTA suggested that dehydration, decarboxylation,
dehydrazination and decomposition occurs till this temperature. A small endotherm at ~678 oC in zinc oxalate
and ~759.4 oC in hydrazinated complex is due to structure
formation (no weight loss occurs in TG at these temperatures).
Figure 2. TG/DTA of zinc oxalate and hydrazinated zinc oxalate
Total weight loss study, TG/DTA study and chemical analysis (hydrazine and oxalate content) of complex confirmed formula of zinc oxalate as ZnC2O4.2H2O and
hydrazinated complex as ZnC2O4.N2H4.H2O (Table 1).
Figure 3. XRD of ZnO and ZnO1-xNx
The complexes were decomposed at 700oC; the former
yielded white oxide and the later yellow. XRD of decomposed complexes, Fig. 3 match well with the Joint Committee on Powder Diffraction Standards (JCPDS) file of
ZnO (Wurtzite). 13.75 % Nitrogen was present in ZnO1-xNx
(yellow), measured by oxygen and nitrogen analyzer. However there was no difference in XRD pattern of ZnO and ZnO1-xNx.Similar observations were reported.14
XPS studies of ZnO1-xNx were recorded for N1s and
Zn2p3/2 core levels. The N1s core level appeared at a binding
energy (B.E.) ~ 398 eV Fig. 4.
Figure 4. X-ray photoelectron spectrum of (a) N 1s and (b) Zn 2p electron in ZnO1-xNx
This suggests N in ZnO1-xNx is similar to NH3 or amines.
The nitride B.E. is reported to be ~397 eV. So electron density on nitrogen is less than that of nitrides. Zn 2p core level shows B. E. ~ 1021 eV (Fig.4b). The lower B.E. of Zn 2p core level (reported, 1022 eV14) is due to covalent nature
of Zn-N bond. These observations were similar to reported.14 They suggest that electron density on Zn in ZnO
1-xNx is slightly more than ZnO. Nitrogen donated some
electrons to Zn. This enhanced photocatalytic degradation of MB.
Precursor Hydrazine content, % Oxalate content, % Total Weight loss %
Calculated Observed Calculated Observed Calculated TG Isothermal
ZnC2O4 .2H2O - - 46.4 46.2 57.0 60.5 57.03
Diffuse reflectance spectra (Fig. 5) of ZnO and ZnO1-xNx
showed that the former absorbed in UV region and later in the visible region; indicating the possibility of photocatalysis by ZnO1-xNx with visible light.
Figure 5. Diffuse reflectance spectra of ZnO and ZnO1-xNx (inset
derivative of the diffuse reflectance spectra)
The band gap energy calculated from derivative of the spectra is 3.19 eV for ZnO and 2.48 eV for ZnO1-xNx. The
lower value of energy of ZnO1-xNx helped in increasing
number of electron hole pair thus enhancing the dye degradation. Scanning electron micrographic studies (Fig. 6) of ZnO1-xNx indicated uniform particles ~69 nm and ZnO,
~0.5-2 μm with BET surface area of ~ 11.8 m2 g-1 and 8.137
m2 g -1 respectively. The large surface area of ZnO
1-xNx, and
less band gap energy (electrons excitation better) are important parameters in photocatalysis.
Figure 6. SEM pictures (a) ZnO (b) ZnO1-xNx
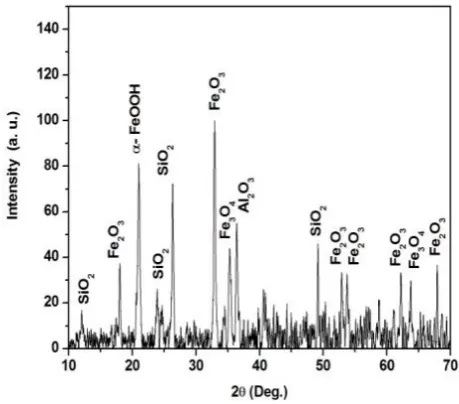
Chemical analysis of ore reject revealed the presence of 54% total Fe reported in earlier work21
. XRD analysis of
iron ore rejects Fig. 7 and EDS results21 (Table 2) showed
the presence of Fe2O3 (α, γ, ε), Fe3O4, α- FeOOH, SiO2,
Al2O3 and small amounts of MnO2. The peak positions were
matched with the JCPDS files.
Table 2. EDS results of analysis on iron ore reject
Figure 7. XRD of iron ore reject
FTIR of ore reject Fig. 8, showed absorption at 545 cm-1
due to Fe-O in Fe3O4.
Figure 8. FT-IR of iron ore reject
The presence of broad and intense absorption band at 3100-3200 cm-1 was due to FeOOH, at 795, 913 cm-1 due to
O-H bending, 1650 cm-1 due to H-O-H bending and at 3694
cm-1 due to surface hydroxyl groups. These results agreed
well with results of XRD and EDS.
Iron ore reject showed different sizes and shapes of particles Fig. 9.
Figure 9. SEM picture of iron ore reject
Element Weight% Atomic%
O K 43.64 71.07
Al K 2.74 2.64
Si K 2.60 2.42
K K 0.32 0.21
Mn K 0.70 0.33
Diffuse reflectance spectra (Fig.10) of iron ore reject revealed the absorption in visible region.
Figure 10. Diffuse reflectance spectra of iron ore reject (inset derivative of the diffuse reflectance spectra)
The band gap energy calculated was 2.39 eV. The derivative peaks may be assigned to the phases Goethite (α-FeOOH) at 439 nm, Maghemite (γ-Fe2O3) at 360 nm,
Hematite (α- Fe2O3) at 565 nm and Magnetite (Fe3O4) at
711nm.29-31 Components present in reject absorb in visible
region enhancing the photo catalysis in sunlight.
Figure 11. UV-Visible spectra of MB (pH=7)during degradation using a) ZnO; b) ZnO1-xNx; c) iron ore rejects; d)
photolysis(absence of catalyst)
Maxima of UV-Visible absorbance spectra of methylene blue (λmax=665 nm) diminished with increase in sunlight
exposure time in presence of ZnO, ZnO1-xNx and iron ore
reject (Fig. 11a, b, c) due to breaking of the dye molecule. In presence of sunlight and ZnO (white) MB showed decolorisation in 210 minutes, in presence of ZnO1-xNx
(yellow) in 210 minutes, and in presence of iron ore reject in 150 minutes. Only sunlight exposure (photolysis-without addition photocatalyst), showed decrease in absorption
maxima but required 1200 minutes for decolorisation. The plot (Fig. 12) of variation in Absorbance of MB solution with time of sunlight exposure in presence of ZnO1-xNx and
iron ore reject showed a sharp decrease. Photolysis (absence of any catalyst) degraded MB marginally.
Figure 12. Decrease in absorbance of 0.5x10⁻⁴ M MB solution with
sunlight exposure (the average light intensity, 300 to 724 lux units and the power, 0.24 to 0.52 W cm-1).
The kinetic study of MB degradation in sunlight using photocatalysts revealed that it follows first order equation:
where k is rate constant. The rate constants were listed in Table 3.
Table 3. Percent degradation and the rate constants for MB degradation
The rate constant values indicated efficiency of ZnO1-xNx
(14.7x10⁻³min-1) compared to the ZnO (8.36x10⁻³min-1) in
dye degradation. The rate constant, k was highest for iron ore reject degradation, 17.3x10⁻³min -1. Degradation by ore
rejects21 is due to formation of H
2O2 by Fe2+/Fe3+ similar to
explanation by Fenton.32
O2(ads) + e- → O2-• (1)
O2-• + H2O →HO2•+ OH- (2)
2HO2• → H2O2 +O2 (3)
HO2• + Fe3+ → Fe2+ +O2 (4)
Fe2+ + H 2O2→ OH• + OH- + Fe3+ (5)
Photocatalyst % degradation for 0.5 x10⁻⁴ M MB
k, min -1
ZnO 90% 8.36x10⁻³
ZnO1-xNx 98% 14.7x10⁻³
Iron ore reject 97% 17.3x10⁻³
Photolysis 45% 3.11x10⁻³
0 lnC kt
C
Table 4. Products of MB degradation on iron ore reject photocatalyst analyzed by ESI-MS.
C16H20N3O2S
(M+)=318.0305
C14H17N2O3S
(M+)=293.0952
C13H15N2O3S
(M+)=279.0897
C12H10N3S
(M+)=228.1013 C
6H9N2O4S
(M+)=205.0275
C6H6NO3S
(M+)=172.0599
C6H8NO2S
(M+)=158.0504 C4H5O6
(M+)=148.9778
C7H11N2O
(M+)=139.0138
C4H6O4
(M+)=121.0012
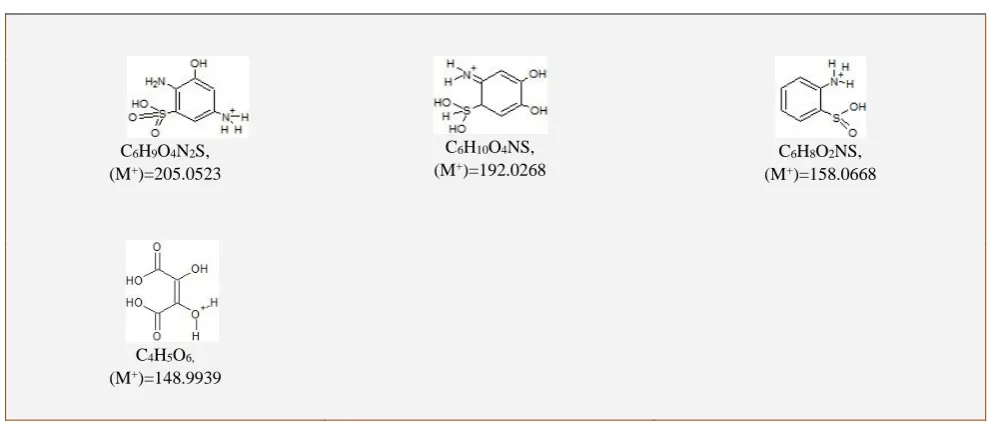
Table 5. Products of MB degradation using ZnO1-xNx analyzed by ESI-MS
.
C6H9O4N2S,
(M+)=205.0523
C6H10O4NS,
(M+)=192.0268
C6H8O2NS,
(M+)=158.0668
C4H5O6,
Oxygen adsorbed on surface of iron ore reject takes electron from the substrate and forms oxygen radical, which later reacts with water molecule forming hydrogen peroxide. Fe2+ of the ore gets oxidized by hydrogen peroxide to form
Fe3+, a hydroxyl radical and a hydroxyl anion.
Fe3+ + H
2O2 → Fe2+ + OOH• + H+ (6)
Another molecule of hydrogen peroxide converted Fe+3
back to Fe2+, a peroxide radical and a proton. The hydroxyl
radicals (OH•) are effective in destroying organic dye molecules. This chain reaction continuously generates hydroxyl radical at each conversion.
Continuous formation of Fe2+ and Fe3+ during MB
degradation by iron ore is responsible for fast decolorisation in 150 minutes and highest k (17.3x10⁻³ min-1).
SATMAGAN study has confirmed increased amount of Fe2+
after each use. FeO content of reject was 5.02 %.
It increased to 5.55 % after first use. Fe3O4 contains Fe2+
so efficiency of ore rejects increases after each use.
Following reactions are followed during degradation of MB by ZnO.33
ZnO semiconductor + h→ ZnO (ecb- + hvb+) (7)
where
ecb- = electrons in the conduction band (cb);
hvb+ = holes in the valence band (vb)
ZnO (ecb- ) + O2 (adsorbed)→ ZnO + O2•- (8)
ZnO (h +) + HO(ads) → ZnO + OH• +H+ (9)
Table 6. Products of MB degradation on ZnO photocatalyst analyzed by ESI-MS.
C13H15O3N2S,
(M+)=279.1189
C6H9O4N2S,
(M+)=205.0545
C8H10O3NS,
(M+)=200.0814
C6H10O4NS,
(M+)=192.0265 C8H10O3N,
(M+)=167.9653
C6H8O2NS,
(M+)=158.0668 C4H5O6,
(M+)=148.9934
Table 7. Products of solar degradation of MB without catalyst (photolysis) analyzed by ESI-MS.
C14H16O3N3S,
(M+)=306.1127
C16H18N3S,
(M+)=284.07774 C15H16N3S,
(M+)=270.0679
C12H8NS,
(M+)=198.0964
C8H11O3 N2,
(M+)=183.0843
C6H10O3NS,
(M+)=176.1126
C6H8O2NS,
(M+)=158.0690 C4H5O6,
Direct oxidation of organic molecule by surface holes was also possible.
ZnO (hvb+)+org. compd. → ZnO+H2O+ CO2 (10)
Using ESR spectroscopic data it is reported that the formation of active OH• and O2•- species takes place during
photodegradation of organic compounds.34
O2•- + H+ →HO2• (11)
2HO2• → H2O2 +O2 (12)
H2O2 → 2OH• (13)
Thus hydroxyl radicals are formed during degradation of MB in presence of all three photocatalyst. More the number of electron hole pairs formed more will be formation of these radicals. ZnO1-xNx was yellow in colour due to loss of
oxygen from lattice. Such non stoichiometric oxygen deficiencies lead to n-type semiconductor and absorb radiation in the visible region. Higher amount of visible radiations in sunlight compared to UV enhances electron pair formation when yellow ZnO1-xNx is used then white
ZnO. XPS results also have inferred that nitrogen in the lattice donates electrons to Zn, so these electrons generate hydroxyl radicals. Increased formation of hydroxyl radical formation in ZnO1-xNx is responsible for higher value of rate
constant k (14.7x10⁻³ min-1)compared to the ZnO (8.36x10⁻³
min-1). Reports14 claim that ZnO
1-xNx is effective in catalysis
application as compared to ZnO and our study confirms the same.
However when iron ore reject is used there is continuous formation of hydroxyl radicals and so the degradation is faster than zinc oxides.
It is reported33 that the OH• radicals attack the C-S+=C
functional group in MB (C16H18N3S+Cl-) forming sulfoxide
(RS(=O)R’) (equation 14). The attack of the second OH•
radical on the sulfoxide produces sulfone (RSO2R’)
(equation 15) and causes the dissociation of two benzenic rings. Sulfone then gives rise to sulfonic acid (RSO3H)
(equation 17) which further gets oxidised to sulphate ion (equation 18).
Methylene blue degradation
Cl-
C16H18N3S +OH• → C16H18N3S=O (14)
C16H18N3S=O+OH•→C8H11O2N2S+C8H11N (15)
C16H18N3S=O+OH•→C8H10NSO2+C8H11N-NH2 (16)
C8H10NSO2 + OH• → C8H10N-SO3H (17)
C8H10NSO3H + OH•→[C8H10N]•+SO4-2+2H+ (18)
So degradation is directly proportional to hydroxyl radicals formed.
Detection of hydroxylated products in ESI-MS study (Table 4, 5, 6, and 7) confirmed that photodegradation of MB by three photocatalysts proceeded through hydroxyl radical mechanism.
The peak at m/z=284 in photolysed MB (without catalyst) correspond to methylene blue molecular ion. The peak at m/z = 270, and 198 correspond to loss of methyl groups, and dimethyl amino groups from aromatic rings on both sides of MB respectively. The peaks at m/z = 306, 279 were due to successive addition of hydroxyl in the MB molecule. The breaking of MB molecule was suggested by the presence of peaks at m/z = 205, 200, 192, 183, 176, 168, 158 and 149. Thus ESI-MS indicated presence of some organic moieties in the decolorized solution of MB. A careful comparison the degradation products of MB using ZnO, ZnO1-xNx, iron ore
reject, and photolysis is
ZnO: C13H15O3N2S, C6H9O4N2S, C8H10O3NS, C6H10O4NS,
C8H10O3N, C6H8O2NS, C4H5O6
ZnO1-xNx: C6H9O4N2S, C6H10O4NS, C6H8O2NS, C4H5O6
Iron ore rejects:C16H20N3O2S, C14H17N2O3S, C13H15N2O3S,
C12H10N3S, C6H9N2O4S, C6H6NO3S, C6H8NO2S, C4H5O6,
C7H11N2O, C4H6O4
Photolysis:C14H16O3N3S, C16H18N3S, C15H16N3S, C12H8NS,
C8H11O3N2, C6H10O3NS, C6H8O2NS, C4H5O6
It suggests that photolysis of MB, C16H18N3SCl, lead to
organic moiety having C16, C15, C14 in them while ZnO1-xNx
showed organic moieties having C6 and C4, so better
degradation. When iron ore and ZnO were used decolourised solution also contained some molecules with C16, C13, etc.
Decolorisation of MB did not convey about total degradation to nontoxic molecules. MB, C16H18N3SCl is
blue in colour and leuco MB, reduced form of MB is colorless. It can be converted back to MB. Thus it should be confirmed that decolourisation in our investigation was not formation of leuco MB. The complete mineralization of the molecule35 may be written as follows:
2C16H18N3SCl + 25 O2 →2 HCl+2 H2SO4+6 HNO3 +
32 CO2 + 12 H2O
Formation of SO42-, NO3- and CO2 from the degraded MB
solution (Table 8) indicated the mineralization of the dye.
Concentration of free CO2 after 150 minutes was; 14.25
mg L-1 in presence of ZnO
1-xNx, 10.69 mg L-1 in presence of
ZnO, and 49.89 mg L-1 in case of iron ore reject. Thus iron
ore reject was able to convert more organic moiety into CO2. % COD removal was highest when ZnO1-xNx (90 %)
and iron ore reject (86 %) were used. Direct photolysis showed an increase in the COD from 84 % to 294 % after 30 minutes of light exposure. It further increased to ~572 % on complete decolourization (required ~ 20 h) revealing presence of organic moiety in solution after decolourisation. S+
N
N N
H3C CH3
CH3
Table 8. % COD, amount of free CO2, nitrate and sulphate generated during MB photo degradation in presence of catalyst
Catalyst added COD mg L-1 % COD
removal
Free CO2 Nitrate, mg L-1 Sulphate mg L-1
t0 t30 t150 t150 t150 t30 t150
Iron ore reject 84 44 12 86 49.89 0.77 2.55 3.10
ZnO1-xNx 84 36 08 90 14.25 0.80 0.11 0.90
ZnO 84 44 28 67 10.69 0.80 0.16 0.88
Photolysis (only sunlight)
84 294 572.4 COD added - 2.60 0.75 32.5
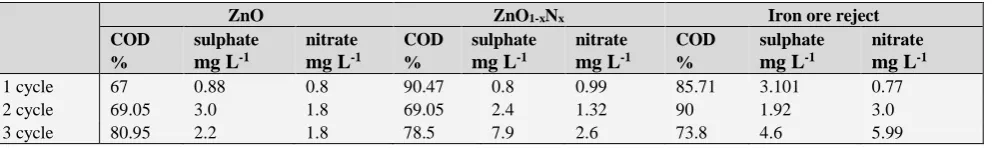
Table 9. %COD, amount of free CO2, nitrate and sulphate generated during MB photo degradation when catalysts are reused
ESI-MS study (Table 7) supported this observation. The photolysis led to incomplete mineralization and formation of oxygen demanding organic species. ZnO with its wide band gap of ~3.19 eV effectively absorbed the UV radiation of the sunlight (~2 % UV in sunlight reaches earth crust) and produced the electron hole pair and initiated photodegradation. N-doped ZnO due to the band gap modification (~2.48 eV in DRS study) and absorption of visible light lead to increased electron hole production, enhancing photocatalysis, higher % COD removal and CO2
formation. Electron-hole recombination also decreased due to the band gap modifications.
Lack of nitrate content in the early stages of degradation was due to formation of ammonium ions initially and later oxidation to nitrates. Quantity of sulphate ions released was low due to the formation of gases, H2S/SO2.31, 33
200 mg ZnO1-xNx was able to degrade 50 mL of 0.5x10⁻⁴
M MB in 150 minutes with ~90 % COD removal, 0.8 mg L-1
NO31- and 0.99 mg L-1 SO42-. It also showed reusability
(Table 9) with increased formation of sulphates and nitrates. Time required for de-colorization of MB by ZnO1-xNx was
constant during reuse but showed a decrease in COD removal in the 2nd run (Table 9).
200 mg of ore reject was able to degrade 50 mL of 0.5x10⁻⁴ M MB in 150 minutes with ~86 % COD removal,
0.77 mg L-1 NO
31- and 3.1 mg L-1 SO42- Thus ore had better
mineralizing action as compared to ZnO and ZnO1-xNx.
Degradation enhanced during its reuse due to conversion of Fe3+ to Fe2+ ions which increased formation of hydroxyl ions.
The degradation time decreased from 150 minutes to 120 minutes and 90 minutes during the second and third use, respectively. ZnO1-xNx did not show this trend. 2 g of reject
added to 50 mL of 0.5x10⁻⁴ M MB was able to degrade the
dye instantaneously. This was also not observed when 2 g ZnO1-xNx were used.
All catalysts were reused three times (Table 9) without losing the original activity suggesting that there was negligible adsorption of the degradation products on their surface.
Conclusions
The two precursors zinc oxalate and hydrazinated zinc oxalate were synthesized. On decomposition, zinc oxalate yielded white ZnO and hydrazinated zinc oxalate yellow ZnO1-xNx. Presence of nitrogen in yellow oxide was
confirmed by XPS and oxygen nitrogen analyser. N-doped zinc oxide, ZnO1-xNx obtained from the hydrazinated
precursor required less time for degradation of the methylene blue dye as compared to ZnO. ESI-MS results indicate presence of small amounts of some organic moieties on complete decolourization. Photolysis of MB, C16H18N3SCl, lead to formation of organic moiety having
C16, C15, C14 in them while ZnO1-xNx lead to formation of
molecules with C6 and C4. No loss in the efficiency of ZnO
and ZnO1-xNx makes them suitable for reuse. The
electron-hole pair formation in ZnO and ZnO1-xNx on exposure to
sunlight lead to hydroxyl radical formation, those are responsible for degradation. ZnO1-xNx absorbs in visible
region and so more electron hole pairs are formed. In XPS study it is inferred that nitrogen is likely to donate some electrons to Zn. So they also enhance generation of hydroxyl radicals. This increases efficiency of ZnO1-xNx. Band gap
energy calculated from DRS are 2.48 eV and 3.19 eV for ZnO1-xNx and ZnO respectively indicating easier electron
excitation in the former than later. Thus ZnO1-xNx showed
better dye degradation. Iron ore reject contained about 54 % total Fe with lower band gap energy 2.39 eV. The time required for dye degradation using iron ore rejects is least, 150 minutes with higher first order rate constant 17.3x10⁻³
min-1 as compared to ZnO which required 210 minutes with
k, 8.36x10⁻³ min-1 and ZnO
1-xNx with k, 14.7x10⁻³ min-1.
During degradation ore reject forms hydroxyl ion radicals similar to fenton reagent. Chain reaction during the process supplies hydroxyl ions continuously due to formation of Fe3+/Fe2+. Hence efficacy of ore reject is best amongst the
three. Increased amount of Fe2+ during reuse is proved by
SATMAGAN. The dye molecule is converted to gases. Formation of SO42-, NO3- and CO2 indicated the
mineralization of the dye. Concentration of SO42- and free
CO2 is found higher when ore reject is used for
degradation. % COD removal is higher for iron ore reject and ZnO1-xNx.
ZnO ZnO1-xNx Iron ore reject
COD %
sulphate
mg L-1
nitrate
mg L-1
COD %
sulphate
mg L-1
nitrate
mg L-1
COD %
sulphate
mg L-1
nitrate
mg L-1
Thus Iron ore rejects, an environmental pollutant, easily available on mining sites can be used to degrade dyes and other unsaturated organic compounds then synthesizing oxides. Comparing the three photocatalysts for dye degradation, iron ore reject > ZnO1-xNx. > ZnO.
Acknowledgement
Authors thank Dr. C. G. Naik, National Institute of Oceanography, Goa, India for helping in ESI-MS study and Dr. Gopinath S. C., National Chemical Laboratories, Pune, India for XPS study.
References
1Smelcerovic M., Dordevic D., Novakovic M., Mizdrakovic M., J.
Serbian Chem. Soc., 2010,75(6), 855.
2Sriwong C., Wongnawa S., Patarapaiboolchai O., J. Environ. Sci.,
2012, 24, 464.
3Elghniji K., Hentati O., Mlaik N., Mahfoudh A., Ksibi M., J.
Environ. Sci.,2012, 24, 479.
4Rashed M. N., El-amin A.A., Intern. J. Phys. Sci., 2007, 2, 73. 5Noorjahan M., Pratap Reddy M., Durga Kumari, V., Lavedrine, B.,
Boule, P., Subrahmanyam, M., J. Photochem. Photobiol. A: Chem.,2003, 156, 179.
6Chakrabarti, S., Dutta B. K., J. Hazard. Mater.,2004, 112, 433. 7Byrappa K., Subramani, A. K., Ananda, S., Lokanatha Rai, K. M.
and Dinesh, R., Bull. Mater. Sci., 2006, 29, 433.
8Daneshvar N., Aber S., Seyed Dorraji M. S., Khataee A. R.
and Rasoulifard M. H., Int. J. Chem. Biomol. Eng., 2008, 1, 24.
9Liu, H., Yang, Y., Kang, J., Fan, M., Qu, J., J. Environ. Sci.,2012,
24, 242.
10Padmavathy, N., Vijayaraghavan, R., Sci. Techn. Adv. Mater.,
2008, 9, 1.
11Moezzi, A., McDonagh, A. M., Cortie, M. B., Chem. Eng. J.,
2012, 185, 1.
12 Rane, K. S., Mhalsiker, R., Yin, S., Sato, T., Cho, K., Dunbar
E. and Biswas, P., J. Solid State Chem., 2006, 179, 3033.
13Noor, A., Mishra, T., Sahu, R. K. and Tiwari, J. P., J. Mater.
Chem., 2010, 20, 10876.
14Mapa, M. and Gopinath, C. S., Chem. Mater., 2009, 21, 351.
15Rane, K. S., Uskaikar, H., Pednekar, R. and Mhalsikar, R., J.
Therm. Anal. Calor., 2007, 90, 627.
16 Moye, V., Rane, K. S. and Kamat Dalal, V. N., J. Mater. Sci.
Mater. Electr.,1990, 1, 212
17Borker, V., Rane, K. S., Kamat Dalal, V. N., J. Mater. Sci.
Mater. Electr.,1993, 4, 241.
18Rane, K. S., Verenkar, V. M. S. and Sawant, P. Y., Bull. Mater.
Sci.,2001, 24, 323.
19Rane, K. S., Verenkar, V. M. S. and Sawant, P. Y., Bull. Mater.
Sci.,2001, 24, 331
20Karmali, R. S., Bartakke, A., Borker, V. P., Rane, K. S.,
Biointerface Res. Appl. Chem., 2011, 1, 57.
21Karmali, R. S., Borker, V. P., Rane, K. S., Naik, C. G., J. Solid
Waste Manag., 2012, 38, 232.
22Vogel I. A., “Textbook of Quantitative Inorganic analysis”,
Longman, UK., 1978.
23Feng, X., Zhu, S., Hou, H., WaterS. A., 2006, 32, 43.
24Manivasakam, N., Physicochemical examination of water sewage
and industrial effluents, Pragati Prakashan, Meerut, 1980.
25Ramesh, R. and Anbu, M., Chemical methods for environmental
analysis, water and sediment, Macmillan India Press, 1996.
26Fujita, J., Martell, A. E., Nakamoto, K.,J. hem, Phys., 1962, 36,
324.
27Fujita, J., Martell, A. E., Nakamoto, K., J
.
Chem,Phys.,1962, 36,331.
28Braibanti, A., Dallavalle, F., Pellinghelli, M. A., Leporati, E.,
Inorg. Chem., 1968, 7, 1430.
29Scheinost, A. C., Chavernas, A., Barron, V., Torrent, J., Clays
Clay Minerals,1998, 46, 528.
30Shen, Z. X., Cao, J. J., Zhang, X. Y., Arimoto, R., Ji, J. F.,
Balsam, W. L., Wang, Y. Q., Zhang, R. J., Li, X. X., Sci. Total Environ., 2006, 367, 899.
31Cornell, R. M., Schwertmann, U., The iron oxides: structure,
properties, reactions, occurrences and uses, 2nd Edition,
Wiley-VCH, 2003.
32Fenton, H. J. H., J. Chem. Soc. Trans.,1894, 65, 899.
33Houas, A., Lachheb, H., Ksibi, M., Elaloui, E., Guillard, C.,
Herrmann, J., Appl, Catal, B: Environ., 2001, 31, 145.
34Fu, H., Zhang, L., Zhang, S., Zhu, Y. and Zhao, J., J. Phys. Chem.
B,2006, 110, 3061.
35Nath, S., Ghosh, S. K., Panigrahi, S., Thundat, T., Pal, T.,
Langmuir, 2004, 20, 7880.