INFLUENCE OF COFFEE ON THE CORROSION RESISTANCE
OF ORTHODONTIC WIRES IN ARTIFICIAL SALIVA
A. Christy Catherine Mary,
[a]S. Rajendran
[b,c]and J. Jeyasundari
[d]Keywords: artificial saliva; corrosion; metals; coffee; polarization study; AC impedance spectra.
Corrosion resistance of Ni-Ti, Thermoactive alloy, and SS 316 L alloy in artificial saliva (AS) in the absence and presence of coffee has been evaluated by electrochemical studies such as polarization study and AC impedance spectroscopy. The polarization and AC impedance spectroscopy studies lead to the conclusion that corrosion resistance of the alloys decreases in the following order: SS 316 L alloy > Thermoactive alloy> Ni-Ti alloy. In all the three cases, the corrosion resistance of the wires increases in the presence of coffee. Among the three orthodontic wires, SS316L alloy is the best candidate.
* Corresponding Author
E-Mail: [email protected]
[a] Department of Chemistry, Parvathy’s Arts and Science College, Dindigul. India.
[b] Department of Chemistry, Corrosion Research Center, St.Antony’s College of Arts and Sciences For Women, Dindigul.
[c] Department of Chemistry, AMET University, 135, East Coast road, Kanathur – 603112, Chennai, India.
[d] Department of Chemistry, SVN College, Madurai, India.
Introduction
Metallic materials such as Ag, Au, Ni-Ti, Ni-Cr, SS 316L, SS18/8, etc., are used as implants in regulative oral surgery to the array of teeth. The metals for complete and partial crowns and bridges should be hypoallergenic materials with good mechanical properties, corrosion resistant towards soft drinks, hot drinks, food items, and tablets. Titanium alloys are the most commonly used material for implantation of the teeth.1 Corrosion of metallic implants has vital importance
because it can adversely affect the biocompatibility and mechanical integrity of implants. The electrochemical behavior of orthodontic wires in artificial saliva has been investigated by polarization study and AC impedance spectra2. The resistance to corrosion of the metallic
orthodontic wires in simulated intra–oral environment has been evaluated by Ziebowicz et al.3 The effects of
multilayered Ti/TiN or single-layered TiN film deposited by Pulse-Biased Arc Ion Plating (PBAIP) on the corrosion behavior of NiTi orthodontic wires in artificial saliva have also been investigated.4 Rajendran et al. have studied the corrosion behavior of SS 316L and AS in artificial saliva in the presence of electoral, spirulina powder, and glucose, respectively.5,6,7 A lot of studied have been published on the
use of natural products as corrosion inhibitors.7-13 Corrosion
behavior of Thermoactive super elastic shape memory alloy and Gold 22K has been investigated in artificial saliva in the presence of syzygium cumini fruit juice.15 The corrosion
resistance of Ti depends on the passive film alloys formed on surface.16-20
In the present study, the corrosion resistance of Ni-Ti, SS 316L, and Thermoactive alloys has been evaluated by
electrochemical studies such as polarization study and AC impedance spectroscopy in artificial saliva in presence and absence of coffee.
Materials and methods
Preparation of coffee test solution
The coffee test solution was prepared by heating 250 ml of milk to boil, and with added the 5 g of instant coffee powder (BRU Instant Coffee ), the mixture was mixed with a teaspoon of sugar.
Corrosion behavior of Ni-Ti, Thermoactive alloy, and SS316L alloy have been investigated in various test solutions such as artificial saliva (AS), coffee, AS + coffee. The composition of AS is given in Table 1.
Table 1. The composition of artificial saliva
Content Concentration, g L-1
NaCl 0.4
NaH2PO4.2H2O 0.690
KCl 0.4
CaCl2.2H2O 0.906
Na2S.9H2O 0.005
Urea 1
The metal specimens were immersed in Fusayama-Meyer artificial saliva.21 The pH of the solution was 6.5. In electrochemical studies, the alloys were used as working electrodes. Artificial saliva was used as an electrolyte. The experiments were carried out at 64.5 ˚ C (temperature of the coffee drink).
Potentiodynamic polarization study
Table 2. Corrosion parameters of metals immersed in artificial saliva (AS) in the absence and the presence of coffee obtained by polarization study
The working electrode was one of the three alloys. A saturated calomel electrode (SCE) was the reference electrode, and platinum was the counter electrode.
AC impedance spectra
The cell setup was the same as in the case of polarization study. The real part (Z’) and imaginary part (-Z”) of the cell impedance were measured in ohms at various frequencies.
Result and Discussion
Analysis of polarization curves
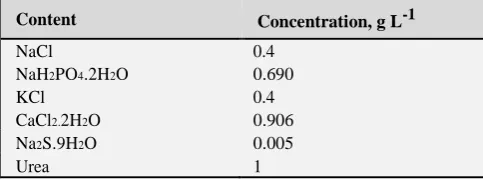
Polarization analysis has been used for detection of the protective films formed on the metal surface during corrosion inhibition process.22 The corrosion parameters of Ni-Ti, Thermoactive alloy, and SS316L alloy in the test solutions are given in Table 2, and the potentiodynamic polarization curves are shown in Figures 1 and 2.
Figure 1.Polarization curve of Ni-Ti alloy, SS 316L alloy and Thermoactive alloy immersed in AS
As it is given in Table 2, when Ni-Ti alloy was immersed in AS, the corrosion potential is -375 mV vs. SCE (Figure 1a). The Linear Polarization Resistance (LPR) value was 3277970 ohm cm2, and the corrosion current (I
corr) was
-8 -2
When the Thermoactive alloy was immersed in AS the Ecorr value wa -501 mV vs. SCE (Figure 1c). The LPR value
was 7930745 ohm cm2. This was found to be higher than in
case of Ni-Ti alloy. The corrosion current is (Icorr) was
found to be 5.775 x 10⁻⁹ A cm-2 . This was found to be lower
than in case of Ni-Ti alloy. These observations indicated that thermoactive alloy was more corrosion resistant than Ni-Ti alloy.
In the case of Thermoactive alloys, the cathodic Tafel slope was (bc) 158 mV decade-1, and the anodic Tafel slope
was (ba) 315 mV decade-1. These values suggested that
during anodic polarization, the rate of change of corrosion current with potential was high, and it was less during the cathodic polarization.
When the SS316L alloy was immersed in AS, the corrosion potential was - 454 mV vs. SCE (Figure 1b). The LPR value was 12072330 ohm cm2. The corrosion current
was 1.127x10⁻⁸ A cm-2. The values of Tafel slopes (b
c = 164;
ba = 317 mV decade-1) indicated that the rate of change of
current with potential increased in higher rate during the anodic polarization than during the cathodic polarization. A comparison of LPR values and corrosion current values of these alloys investigated revealed that SS316L was more corrosion resistance than other two alloys.
Corrosion behavior of alloys in AS containing coffee
Ni -Ti alloy
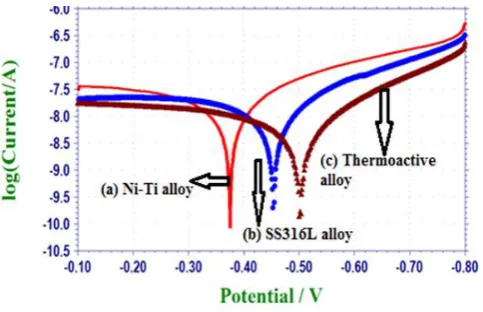
AS it can be seen in Table 2, when Ni-Ti alloy was immersed in AS containing coffee, the corrosion potential was -778 mV vs. SCE (Figure 2a). It was interesting to note that in the presence of coffee the LPR value increased (5557295 ohm cm-2) and the corrosion current value
decreased (7.170 x 10⁻⁹ A cm-2). It seemed that a protective
layer was formed on the metal surface which controled the rate of corrosion of Ni-Ti in AS in the presence of coffee. The values of Tafel slopes were bc = 130 mV decade-1; ba =
339 mV decade-1.
Thermoactive alloy
When the Thermoactive alloy was immersed in AS containing coffee the corrosion potential was -712 mV vs. SCE (Figure 2c). The Tafel slope were bc = 130 mV
-1 -1
Metal System Ecorr,
mV vs SCE
bc,
mV decade-1
ba,
mV decade-1
LPR,
ohm cm2
Icorr,
A cm-2
Ni-Ti alloy AS -395 178 302 3277970 1.488x10⁻⁸
AS+Coffee -778 126 335 5557295 7.170x10⁻⁹
SS316L alloy AS -454 164 317 4177473 1.127 x10⁻⁸
AS+Coffee -447 123 216 12072330 2.825x10⁻⁹
Thermoactive alloy AS -501 158 315 7936745 5.775x10⁻⁸
Table 3. Corrosion parameters of metals immersed in Artificial saliva (AS) in the absence and the presence of coffee obtained by AC impedance spectra
The LPR value was increased from 7936745 ohm cm2 to
8025230 ohm cm2, the corrosion current was decreased from
5.775 x 10 -8 A cm-2 to 5.095 x 10⁻⁹ A cm-2. That is, in the
presence of coffee, the corrosion resistance of thermoactive alloy was increased.
Figure 2. Polarization curve of Ni-Ti alloy, SS316L alloy and Thermoactive alloy immersed in AS+Coffee
SS 316 L alloy
In the presence of coffee, the corrosion resistance of SS316L increased. This is revealed by the increase in LPR value (from 4177473 ohm cm2 to 12072330 ohm cm2 ) and
decrease in corrosion current (from 1.127 x10⁻⁸ to 2.825 x
10-9) (Figure 2b). The value of Tafel slope were b
c = 123
mV decade-1; b
a = 216 mV decade-1. Thus polarization study
leads to the conclusion that in the presence of coffee in AS the corrosion resistance of alloys decreased in the following order: SS316L alloy > Thermoactive alloy> Ni-Ti alloy. Polarization study reveals that the corrosion resistance of the three alloys in AS in absence and presence of coffee decreases in the following order; SS316L alloy > Thermoactive alloy> Ni-Ti alloy.
Implication
It implies that SS316L alloy is a better candidate for making orthodontic wire.
AC impedance spectra
AC impedance parameters such as charge transfer resistance (Rt), double layer capacitance (Cdl) (derived from
Nyquist plots) and impedance value log (Z ohm-1) (derived
from Bode plots), of various alloys immersed in AS and AS containing coffee, are given in Table 3. AS impedance spectra are shown in Fig 3 to 5 (Nyquist Plots) and 6 to 11 (Bode plots).
Ni-Ti alloy
When Ni-Ti is immersed in AS (Figure 3a), the charge transfer resistance was 1227 ohm cm2. The double layer
capacitance was 4.1538x 10⁻¹⁰ F cm-2. The impedance value
[log (Z ohm-1)] was 4.20315 in the presence of coffee
(Figure 3b), Rt value increased (from 12278 ohm cm2 to
38238 ohm cm2) and C
dl value was decreased. There was an
increase in the value of impedance [log(Z ohm-1)] (Fig 7b).
These observations indicated that in the presence of coffee in AS, the corrosion rate of Ni-Ti was reduced due to the formation of the protective film formed on the metal surface.
Figure 3. AC impedance spectra (Nyquist plot) of Ni-Ti alloy immersed in AS and AS+Coffee
Thermoactive alloy
When the Thermoactive alloy was immersed in AS (Figure 4a), the Rt value is 27941 ohm cm2. The double
layer capacitance was 1.8253x 10⁻¹⁰ F cm-2. The impedance
value [log (Z ohm-1)] was 3.82(Figure 8).
Metal System Nyquist plot, Rt ohm cm2 Cdl, F cm-2 Bode plot, impedance log(Z ohm-1)
Ni-Ti alloy AS 12278 4.1538 4.203
AS+coffee 3823.8 1.30759 4.4
SS316L alloy AS 12468 4.0905 4.443
AS+coffee 247279.52 2.0235 4.6
Thermoac-tive alloy AS 27941 1.8253 4.344
When the Rt values were compared with the value of
Ni-Ti, it was noted that Thermoactive alloy was more corrosion resistant in AS than Ni-Ti alloy. Similarly, when Thermoactive alloy was immersed in AS mixed with coffee (Figure 4b) the Rt value was increased from 27941 to 88930
ohm cm2, the C
dl value decreased from 1.8253 x 10⁻¹⁰ F cm-2
to 5.622 x 10⁻¹¹ F cm-2, and the impedance value increased
from 3.871 to 4.393 (Figure 9). This observation concluded that the film formation on the metal surface in AS in the presence of coffee.
Figure 4. AC impedance spectra (Nyquist plot) of Thermoactive alloy immersed in AS and AS+Coffee
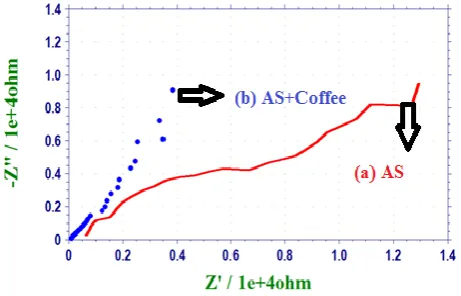
SS316L alloy
When SS316 L alloy was immersed in AS, the Rt value
was 12468 ohm cm2. The C
dl value was 4.0905x 10⁻¹⁰ F cm-2,
and the impedance value [log (Z ohm-1)] was 4.443 (Figure
10). These observations suggest that the protective film formed on the SS316L alloy. SS316L was a better candidate in AS since it was more corrosion resistant than Ni-Ti and Thermoactive alloys.
Figure 5. AC impedance spectra (Nyquist plot) of SS 316L alloy immersed in AS and AS+Coffee
When SS316L was immersed in AS in the presence of coffee the Rt value is increase from 12468 to 247279.52
ohm cm2, the C
dl value is decreased from 4.0905 x 10⁻¹⁰ F
cm-2 to 2.0235 x 10⁻¹⁰ F cm-2 and impedance value increased
from 4.443 to 4.6 [log (Z ohm-1)] (Figure 11).
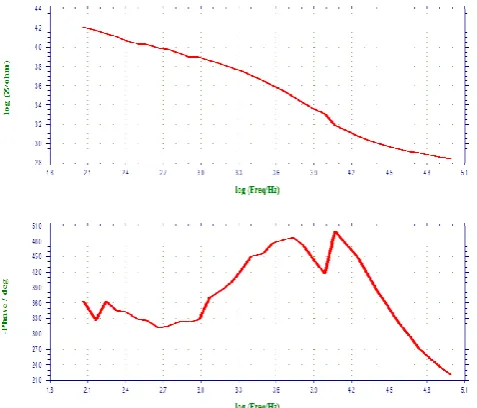
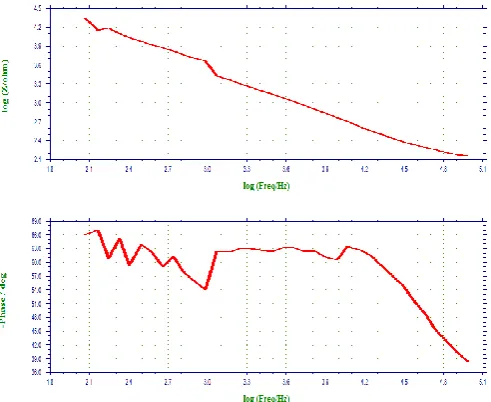
Figure 6.AC impedance spectra (Bode Plot) of Ni-Ti alloy immersed in AS
Figure 7.AC impedance spectra (Bode Plot) of Ni-Ti alloy immersed in AS +Coffee
Figure 9.AC impedance spectra (Bode plot) of Thermoactive alloy immersed in AS+Coffee
Figure 10. AC impedance spectra (Bode plot) of SS316L immersed in AS
Figure 11. AC impedance spectra (Bode plot) of SS316L immersed in AS+Coffee
Conclusion
The present study led to the conclusion that in the presence of coffee in AS, the corrosion resistance of SS316L increased. In the presence of coffee in AS, the corrosion resistance of alloys decreased in the following order;
SS 316 L alloy > Thermoactive alloy> Ni-Ti alloy
Acknowledgement
The authors of thankful to their Managements.
References
1Saranya, R., Rajendran, S., Krishnaveni, A., Pandiyarajan, M.,
Nagalakshmi, R., Eur. Chem. Bull, 2013, 2(4), 163-170. DOI: 10.17628/ecb.2013.2.163-170
2Vieira, A. C., Ribeiro, A. R., Rocha, L. A., Celis, J. P., WEAR,
2006, 261, 994. https://doi.org/10.1016/j.wear.2006.03.031
3Ziebowicz, A., Walke, W., Barucha Kepka, A., Kiel, M., J.
Achiev. Mater. Manuf. Engg., 2008, 27, 151-154.
4Kiu, C. L., Chu, P. K., Lin, Q. Q., Yang, D. Z., Corr. Sci., 2007,
49, 3783. https://doi.org/10.1016/j.corsci.2007.03.041
5Rajendran, S., Chitra Devi, P., John Mary, S., Krishnaveni, A.,
Kanchana, S., Lidia Christy., Nagalakshmi, R., Narayana Samy, B., Zastit. Mater., 2010, 51(3), 149-158.
6Rajendran, S., Paul Raj, J., Regan, P., Jeyasundari, J., Manivanna,
M., J. Dent. Oral Hyg., 2009, 1, 1-8.
7Rajendran, S., Uma, V., Krishnaveni, A., Jeyasundari, J.,
Shyamaladevi, B.,.Manivanna, M., Arabian J. Sci. Engg.
2009, 34(2), 147-158.
8Loto, C. A., Mohammed, A. Loto, I.., Corros. Prevent. Control,
2003, 50(3), 107-118.
9Loto, C. A., Mohammed, A. Loto., I., Corros. Prevent. Control,
2000, 47(2), 50-56.
10Da Rocha, J. C., Da Cunha, P. G. J.., Elia, E. D., Corros. Sci.,
2010, 52(7), 2341-2348.
https://doi.org/10.1016/j.corsci.2010.03.033A
11Okafor, P. C., Ebenso, E. E., Pigment Resin Technol., 2007,
36(3), 134-140. https://doi.org/10.1108/03699420710748992
12Priya, S. L., Chitra, A., Rajendran, S., Anuradha, K., Surf. Engg.,
2005, 21(3), 229-231.
https://doi.org/10.1179/174329405X50073
13Bouyanzer, A., Hammouti, B., Bull. Electrochem., 2004, 20(2),
63-65.
14Singh., A., Quraishi, M. A., Res. Chem. Intermed., 2015, 41(3),
2901-2914. https://doi.org/10.1007/s11164-013-1398-3
15Madhumitha, S., Priyadharshini, V., Sheela, A., Adithya, C.,
Sangeetha, M.,.Rajendran, S., Int. J. Nano corr. Sci. Engg. 2016, 3(4), 407-414.
16Lausmaa, J., Kasemo, J. B., Hansson, S., Biomaterials, 1985, 6,
23-27. https://doi.org/10.1016/0142-9612(85)90033-x
17Nakagava, M., Malsuya, S., Shiraishi, T., Ohta, M., J. Dent. Res.
1999, 78(9), 1568-1572.
https://doi.org/10.1177/00220345990780091201
18Kononen., Mauno, Lavonius, H., Eeva, T., Kivilahti, K., Dent.
19Morshita, M., Chikuda, M., Astrida, Y., Morinaga, M., Yukawa,
N., Adachi, H., J. Japan Inst. Metals, 1999, 55(6), 720-726.
https://doi.org/10.2320/jinstmet1952.55.6_720
20Watanabe, T., Narito, H., J. Japan Inst. Metals, 1988, 52(8),
780-785. https://doi.org/10.2320/jinstmet1952.52.8_780
21Kinani, L., Chtaini, A., Leonardo J. Sci., 2007, 11, 33-40.
22Saranya, R., Rajendran, S., Krishnaveni, A., Jayasundari, J., Eur.
Chem. Bull. 2013, 2(6), 389-392. DOI: 10.17628/ecb.2013.2.389-392