ISSN 1479‐4403 54 ©ACPIL Reference this paper as Tang C M and Chaw L Y, “Digital Literacy: A Prerequisite for Effective Learning in a Blended Learning Environment?” The Electronic Journal of e‐Learning Volume 14 Issue 1 2016, (pp54‐65) available online at
Learning Environment?
Chun
Meng
Tang
1and
Lee
Yen
Chaw
21
James
Cook
University,
Singapore
Campus,
Singapore
2
UCSI
University,
Kuala
Lumpur,
Malaysia
Abstract: Blended learning has propelled into mainstream education in recent years with the help of digital technology. Commonly available digital devices and the Internet have made access to learning resources such as learning management systems, online libraries, digital media, etc. convenient and flexible for both lecturers and students. Beyond the physical classroom walls, learning can still continue at another place and time. However, although today’s students generally face no difficulties in using technology for everyday social and entertainment activities, it would be constructive to understand if the students can make effective use of technology for learning as well. It has been posited that to make effective use of technology for learning, one needs to have a certain level of digital literacy. Digital literacy for learning is more than just knowing how to operate the technology, but also having the right information management and critical thinking skills, as well as proper online behaviours. This study aims to answer the question: Do students require digital literacy to be effective in learning in a blended learning environment? To answer this question, this study examined the relationships between effective learning and four digital literacy constructs; i.e. underpinnings, background knowledge, central competencies, and attitudes and perspectives. Responses were first collected from the students who were taking courses in a blended learning environment at a local university and then analysed using partial least squares. Analyses show that the four digital literacy constructs could be reduced to three, and the three digital literacy constructs each had a statistically significant relationship with the effective learning construct. This study provides evidence that digital literacy is a prerequisite for students to be effective in learning in a blended learning environment.
Keywords: blended learning, digital literacy, effective learning, higher education, online learning, partial least squares
1
Introduction
Digital technology has become an integrated part of education (Benson and Kolsaker, 2015) and is changing the ways today’s students learn (Coccoli et al., 2014). Digital technology includes a wide range of computing hardware and software, e.g. mobile devices, web tools, application software, communications and storage services, etc. (Mohammadyari and Singh, 2015; Ng, 2012). Students use digital technology for such learning activities as reading and sending email, accessing learning management systems, reading e‐journals or e‐ books, doing online quizzes, participating in discussion forums, and so on (Jones et al., 2010; Waycott et al., 2010).
Educational institutions are taking advantage of advances in digital technology to engage their students with various teaching and learning modes. One such mode is blended learning (Porter et al., 2014) which integrates technologies into the learning delivery process, and hopefully overcomes some limitations of face‐to‐face classroom learning (Akkoyunlu and Yılmaz‐Soylu, 2008). Blended learning allows students to learn anytime, anywhere, and in the way they want to. Complementing face‐to‐face classroom teaching with online learning (Coccoli et al., 2014), blended learning has become popular among educational institutions.
However, Joy and Garcia (2000) caution educators against assuming that students would learn better from technology‐based learning delivery systems. Although students use technology in their everyday activities, they might not necessarily be familiar with or use technology for learning (Waycott et al., 2010). Students might use technology more for social or entertainment purposes but not for learning (Prior et al., 2016). Gurung and Rutledge (2014) share the view that digital learners need help on how to use technology effectively for learning. Ng (2012) contends that students might not know how to use technology for learning. Already possessing certain level of digital literacy, however, they should be able to learn to use technology for learning easily.
People who have multiple literacies to use digital technology efficiently and effectively are deemed to be digitally literate (Mohammadyari and Singh, 2015). As digital technology plays a key role in blended learning, it is expected that students need a certain level of digital literacy for them to learn effectively (Eshet, 2004). Hence, it is essential for educators to ask the question: Do students require digital literacy to be effective in learning in a blended learning environment? This study aims to answer this question.
The following sections provide an overview of blended learning, review the concept of digital literacy and its components, explain the measurement of effective learning, describe the research design and method, present the data analyses and results, and conclude the paper.
2
Research
background
2.1 Blended learning
A learning delivery approach which blends face‐to‐face classroom learning and online learning, blended learning provides such flexibility as anytime and anywhere access to learning management systems (LMS). An LMS provides an online delivery platform for lecturers and students to share learning resources, equipping them with useful system tools and functions (Glogowska et al., 2011; De Smet et al., 2012). Blended learning promotes independent learning and online cooperation, and yet retains some face‐to‐face classroom teaching (Deschacht and Goeman, 2015). The basic premise is to complement face‐to‐face classroom learning by giving students the learning flexibility as enabled by digital technology.
Given limited classroom space and increasing student number, blended learning seems to be a feasible solution (Garrison and Vaugha, 2013) which meets the needs of students, educators, and universities (Moskal, Dziuban and Hartman, 2013). Blended learning brings some benefits, e.g. higher classroom efficiency, greater teaching flexibility, more convenience for students, and better learning engagement (Owston, York and Murtha, 2013). Deschacht and Goeman (2015) analysed two groups of first‐year university students to understand if blended learning had an effect on their academic performance. Both groups took the same courses and exams, but the course delivery mode was different. One group followed the blended learning approach and the other, face‐to‐face classroom learning. The findings showed that blended learning improved academic performance.
However, adopting blended learning does not necessarily improve the student learning experience (Cortizo et al., 2010). Benson and Kolsaker (2015) contend that technology is only one part of blended learning, and more understanding is still needed about its pedagogical benefits. In addition, the digital environment that students are in today could have caused them to develop different learning attitudes and styles (Coccoli et al., 2014). Jones et al. (2010) collected data from some 500 first‐year students at five UK universities to study their use of technology for social and learning activities. Students born after 1983 were compared to those born before 1983. The findings showed that there were differences in terms of the use of technology among the students, not just between the groups but within the groups as well. Margaryan, Littlejohn and Vojt (2011) surveyed 160 third‐year university students to understand what digital technologies the students used and how they used them. They compared students born in or after 1980 with those born before 1980. The findings showed that those born in or after 1980 were not more advanced in their use of digital technologies nor did they have very different learning styles from those born before 1980.
Kember et al. (2010) find that blended learning is not just about using LMS as an online repository of learning materials. Instead, educators should incorporate learning activities that engage students to foster active learning. Coccoli et al. (2014) explain that knowing technology alone is not enough for success in learning; equally important is that one needs to have the right competencies and attitudes. A study by Owston, York and Murtha (2013), which analysed how student perceptions of blended learning could have affected their course grade, showed that compared to low‐achieving students, high‐achieving students were more satisfied with their blended learning courses, claiming that these courses were more convenient, more engaging, and they learned better. Low‐achieving students might find blended learning courses challenging if they lack independent study skills or if the difficulty level of the subject matter is high.
Blended learning can have different configurations of face‐to‐face classroom learning and online learning in different learning contexts (Garrison and Kanuka, 2004) and a good integration is always a challenge (McKenzie et al., 2013). Staker and Horn (2012) identifies four blended learning models for primary and secondary education: Rotation, Flex, Self‐Blend, and Enriched‐Virtual. D2L (2014), a company that specialises in developing integrated learning platforms, proposes five blended learning models: Face‐to‐Face Driver, Rotation, Flex, Online Lab, and Online Driver. Moskal, Dziuban and Hartman (2013) suggest that there is no one best blended learning model. Instead, there are a set of critical success factors, such as institutional goals and objectives; alignment between goals of administrators and faculty members; organisational capacity; faculty development and course development support; support for online students and faculty; robust and reliable infrastructure; longitudinal data collection and assessment; policy development; and funding model.
2.2 Digital literacy
Today’s students are familiar with digital technology and generally know how to access, create, and share digital information (Ting, 2015). Greene, Yu and Copeland (2014) suppose that to be digitally literate, one not only needs to be able to search and manage, but also to scrutinise and integrate digital information. Although today’s students are generally considered tech‐savvy, many of them find it difficult to do so effectively. They conclude that students need to acquire planning, monitoring, and controlling skills in relation to information management, as well as critical thinking skills. Gilster (1997) supports the notion that to be digitally literate, one does not just know how to find information from the web, but also has the ability to understand and assemble information from different print or digital sources. Digital literacy involves the mastery of ideas, and is not just about using the technology itself.
The European Framework for Digital Literacy (EFDL), an outcome of the DigEuLit project and initiated to recognise the importance of digital literacy, defines digital literacy as follows:
Digital literacy is the awareness, attitude and ability of individuals to appropriately use digital
tools and facilities to identify, access, manage, integrate, evaluate, analyse and synthesize digital
resources, construct new knowledge, create media expressions, and communicate with others, in
the context of specific life situations, in order to enable constructive social action; and to reflect
upon this process.” (Martin, 2006, p.155)
Jisc (2014) emphasises that digital literacy is context‐dependent and suggests a seven‐element digital literacy model: media literacy, information literacy, digital scholarship, learning skills, communications and collaboration, career and identify management, and ICT literacy. Ng (2012) explains that digital literacy comprises three key dimensions: technical, cognitive, and social‐emotional. The technical dimension concerns the skills needed to use IT proficiently. The cognitive dimension concerns the skills needed to search, evaluate, and synthesise digital information critically, and at the same time, to be conscious of any ethical, moral, and legal issues. The social‐emotional dimension concerns the skills needed to socialise online in a proper manner.
Bawden (2008) explains that the concept of digital literacy is very broad and can include very specific skills and competencies to general awareness and perspectives. He distinguishes four components of digital literacy: (1) underpinnings ‐ the ability to read and write as well as to use software packages and computers; (2) background knowledge ‐ an understanding of how digital and non‐digital information is created from various forms of resources and communicated; (3) central competencies ‐ the ability to assemble knowledge from multiple sources; and (4) attitudes and perspectives ‐ the ability to learn independently as well as to exhibit good behaviour in a digital environment.
Digital literacy needs to be renewed as digital technology evolves over time. It can be classified into three levels (Martin, 2006): (1) digital competence ‐ digital know‐how; (2) digital usage ‐ applications of digital competence; and (3) digital transformation ‐ creation of new knowledge as a result of digital usage. Prior et al. (2016) observe that students can exhibit different levels of digital literacy. Thus, assuming that all students have the same level or a certain level of digital literacy can lead to a problem in online learning – What the students are capable of doing might be different from the expectations of teachers.
2.3 Effective learning
To assess how effective learning is as a result of adopting blended learning, the revised Bloom's taxonomy provides some good pointers. Commonly used as a reference framework when designing learning activities, objectives, and outcomes (Blooma et al., 2013), the original Bloom’s taxonomy was first published in 1956 (Bloom et al., 1956). As a cognitive taxonomy, Bloom’s taxonomy categorises learning outcomes, from the lowest to the highest, into six levels: knowledge, comprehension, application, analysis, synthesis, and evaluation (Tyran, 2010). The taxonomy was revised in 2001 with changes to its category names: remembering, understanding, applying, analysing, evaluating, and creating (Krathwohl, 2002).
2.4 Research model
Using the four digital literacy constructs; i.e. underpinnings, background knowledge, central competencies, and attitudes and perspectives, as conceptualised by Bawden (2008) and the revised Bloom’s taxonomy as a point of departure, this study proposed a research model (Figure 1). Another of our study adopted Jisc’s digital literacy model; this study included only Bawden’s digital literacy components.
Figure 1: Research model
3
Research
method
3.1 Construct operationalisation
To develop a scale for a construct, the construct must first be conceptualised theoretically (Segars, 1997). Following that, a group of scale items can then be developed based on the conceptual domain of the construct (MacKenzie et al., 2005). After a review of past literature and a questionnaire pretest, this study developed a 5‐item scale for each of the four digital literacy constructs and a 6‐item scale for the effective learning construct.
3.2 Data collection
An online questionnaire was used to collect data from the students of a university that had adopted blended learning. An invitation, with a link to the questionnaire, for the students to fill in the questionnaire was made on the LMS commonly accessed by them. The questionnaire consisted of four sections. Section A asked two questions about learning delivery. Section B consisted of two questions. One question was about the four digital literacy constructs (a total of 20 scale items, coded as D1 to D20, in random order) and the other the effective learning construct. All items were measured using a 5‐point Likert‐type scale, 5 being “strongly agree” and 1 being “strongly disagree.” Section C asked four questions about usage of LMS. Section D asked two demographic questions. A total of 176 respondents provided the responses. 15 responses were removed as outliners in subsequent analyses. Thus, there were only 161 valid responses. Of the 161 respondents, 87 were male students (54%) and 74 female (46%).
4
Data
analysis
and
results
4.1 Learning delivery and LMS usage
Table 1 provides a summary of the respondents’ preference for different learning delivery modes. In order of preference (“prefer” and “strongly prefer”), a higher percentage of the respondents preferred classroom learning (74.5%), as compared to blended learning (64%) or online learning (63.9%).
Table 1: Preference for individual learning delivery modes
Classroom learning Online learning Blended learning
N % N % N %
Strongly not prefer 2 1.2 2 1.2 0 0.0
Not prefer 2 1.2 12 7.5 8 5.0
Maybe 37 23.0 44 27.3 50 31.1
Prefer 72 44.7 82 50.9 60 37.3
Strongly prefer 48 29.8 21 13.0 43 26.7
Total 161 100.0 161 100.0 161 100.0
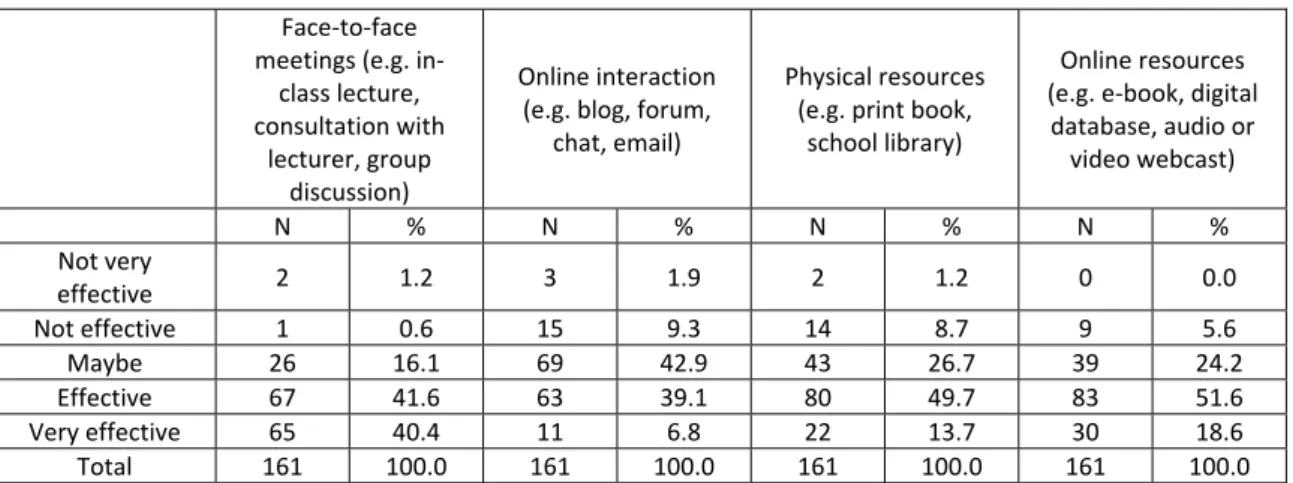
Table 2 provides a summary of what the respondents thought about the effectiveness of different learning activities or resources. In order of effectiveness (“effective” and “very effective”), a higher percentage of the respondents thought that face‐to‐face meetings (82%) were more effective than online interactions (45.9%); and online resources (70.2%) were more effective than physical resources (63.4%).
Table 2: Effectiveness of delivery methods
Face‐to‐face meetings (e.g. in‐
class lecture, consultation with
lecturer, group discussion)
Online interaction (e.g. blog, forum,
chat, email)
Physical resources (e.g. print book,
school library)
Online resources (e.g. e‐book, digital
database, audio or video webcast)
N % N % N % N %
Not very
effective 2 1.2 3 1.9 2 1.2 0 0.0
Not effective 1 0.6 15 9.3 14 8.7 9 5.6
Maybe 26 16.1 69 42.9 43 26.7 39 24.2
Effective 67 41.6 63 39.1 80 49.7 83 51.6
Very effective 65 40.4 11 6.8 22 13.7 30 18.6 Total 161 100.0 161 100.0 161 100.0 161 100.0 Table 3 provides a summary of the features the respondents liked the most about LMS (they could choose more than one feature). In order of frequency, the three largest percentages were online resources (78.5%), online course announcements (52.1%), and online assignment submission (47.9%).
Table 3: LMS features
LMS features N %
Online resources (e.g. lecture notes, PowerPoint slides, tutorial questions) 128 78.5 Online course announcements 85 52.1 Online assignment submission 78 47.9 Online assessment (e.g. quiz) 73 44.8
Online grade centre 59 36.2
Online discussion (e.g. blog, forum, chat) 34 20.9 Table 4 provides a summary of the usage of LMS.
Table 4: Usage of LMS
Demographic information N %
Semesters using the LMS 1 semester 50 31.1
2 semesters 69 42.9
3 semesters 28 17.4
4 semesters 5 3.1
5 semesters 2 1.2
More than 5 semesters 7 4.3 Hours using the LMS per day Less than 1 hour 93 57.8
Between 1 to 2 hours 48 29.8 Between 2 to 3 hours 16 9.9 Between 3 to 4 hours 2 1.2 More than 4 hours 2 1.2 Primary device accessing the LMS Desktop computer 57 35.4
Notebook 45 28.0
Smartphone 47 29.2
Tablet 12 7.5
4.2 Exploratory factor analysis
An exploratory factor analysis (EFA) is necessary to examine dimensionality of a scale before a confirmatory factor analysis (CFA) (Gerbing and Anderson, 1988). The analysis attempts to examine loadings of individual scale items across factors, identifying scale items that load strongly on a particular factor (Gefen and Straub, 2005). In this study, a factor analysis assessed the four digital literacy constructs using the principal axis factoring extraction method. A separate factor analysis assessed the effective learning construct. Straub, Boudreau and Gefen (2004) advise against mixing independent and dependent constructs in EFA but instead, suggest examining the constructs separately. Assuming that there were correlations among the constructs, the Promax rotation method was used (Hair et al., 2005). Before a factor analysis of the four digital literacy constructs, a check for multivariate outliers was performed. Following the rule that a case is considered a multivariate outlier if the probability of its squared Mahalanobis distance is equal or less than 0.001 (Tabachnick and Fidell, 2007), of the 176 cases, 10 cases were removed. KMO (> 0.5) and Barlett’s test (p < 0.05) were checked first for appropriateness for factor analysis (Hair et al., 2005). Both KMO and Barlett’s tests satisfied the criteria. Two criteria were used to decide deletion of scale items: (1) scale items loaded < 0.5 on any one of the factors, or (2) scale items cross‐loaded > 0.5 on two or more factors (Hair et al., 2005). Iteration 1 showed scale item D10 cross‐loaded on two factors. Thus, it was removed from further analysis. In iteration 2, a simple structure was obtained. Factor scores were then calculated to check for outliers. Those scale items that had a factor score of larger than +/‐ 3.0 were considered as outliners (Deneshkumar et al., 2014). Of the 166 cases, 5 cases were removed. Thus, the remaining 161 cases were kept for further analysis. Subsequent 7 iterations deleted 7 scale items (D14, D19, D6, D3, D7, D9, and D11) and obtained a simple structure. Table 5 provides a summary of the factors.
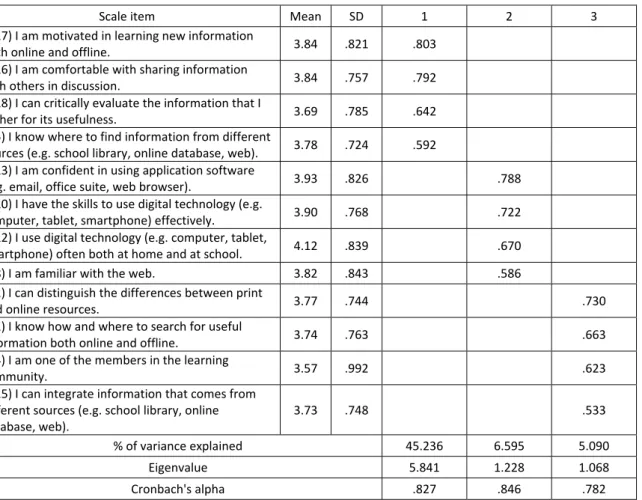
EFA revealed that the four digital literacy constructs proposed originally had been reduced to three. While the construct underpinnings retained its original scale items, scale items of the other three digital literacy constructs loaded on just two factors. In relation to knowledge acquisition in organisational learning, Huber (1991) identifies five processes: congenital learning (acquired in the form of prior knowledge); experiential learning (acquired by learning from doing); vicarious learning (acquired by observing others); grafting (acquired by hiring people who know); and searching (acquired by actively searching for information). With reference to the concepts of knowledge acquisition in organisational learning (Huber, 1991) and to better reflect the meaning of the scale items of each, these two newly‐identified factors were labelled as experiential learning and searching respectively. In factor analysis, it is common to find the number of constructs originally proposed in a research model to change as a result of factor analysis; that is, the number of constructs may be reduced (Gable, Sedera and Chan, 2003) or added (Cohen, Thiraios and Kandilorou, 2008). After deciding on the number of factors to be retained, it is then necessary to interpret and label the factors based on the meaning of the scale items loaded on the respective factors (Hair et al., 2005).
A factor analysis of the effective learning construct showed a one‐factor simple structure (L1 to L6, Eigenvalue = 4.526, % of variance explained = 70.590, Cronbach's alpha = .935).
Table 5: EFA results
Scale item Mean SD 1 2 3
(D17) I am motivated in learning new information
both online and offline. 3.84 .821 .803
(D16) I am comfortable with sharing information
with others in discussion. 3.84 .757 .792
(D18) I can critically evaluate the information that I
gather for its usefulness. 3.69 .785 .642
(D5) I know where to find information from different
sources (e.g. school library, online database, web). 3.78 .724 .592 (D13) I am confident in using application software
(e.g. email, office suite, web browser). 3.93 .826 .788 (D20) I have the skills to use digital technology (e.g.
computer, tablet, smartphone) effectively. 3.90 .768 .722 (D12) I use digital technology (e.g. computer, tablet,
smartphone) often both at home and at school. 4.12 .839 .670 (D8) I am familiar with the web. 3.82 .843 .586
(D2) I can distinguish the differences between print
and online resources. 3.77 .744 .730
(D1) I know how and where to search for useful
information both online and offline. 3.74 .763 .663 (D4) I am one of the members in the learning
community. 3.57 .992 .623
(D15) I can integrate information that comes from different sources (e.g. school library, online database, web).
3.73 .748
.533
% of variance explained 45.236 6.595 5.090
Eigenvalue 5.841 1.228 1.068
Cronbach's alpha .827 .846 .782
4.3 Confirmatory factor analysis
Unlike EFA, in confirmatory factor analysis (CFA), the relationships between a construct and its scale items are prescribed before the statistical analysis (Gefen and Straub, 2005). This study performed a CFA with the partial least squares (PLS) approach. PLS approach aims to examine variances and significance of relationships, and is appropriate for making predictions (Fornell and Bookstein, 1982; Gefen, Straub and Boudreau, 2000). Gerbing and Anderson (1988) propose a two‐step modelling approach to PLS analysis. They contend that a two‐step approach that examines both the measurement model and structural model makes a complete confirmatory assessment of construct validity. The first step examines the measurement model, and the second step examines both the measurement and structural models simultaneously. Following Gerbing and Anderson (1988), in this study, the measurement model was tested first for internal consistency reliability, convergent validity, and discriminant validity (Dunn, Seaker and Waller, 1994). Next, by estimating the path coefficients and R2, the structural model was examined for the relationships between the exogenous and endogenous constructs (Gerbing and Anderson, 1988). To perform the PLS analysis, this study used the SmartPLS software.
4.3.1 Measurement model
First, the loadings of individual items were examined. Those that did not load more than 0.7 on the intended construct were deleted to establish unidimensionality (Chin, 1998). Scale item D4 of the construct central competencies did not meet the threshold value (0.599). Thus, it was removed from further analyses. After D4 was removed, loadings of all scale items on their intended constructs were above 0.7.
Having established that all scale items had satisfactory loading, subsequent analyses checked for internal consistency reliability, convergent validity, and discriminant validity.
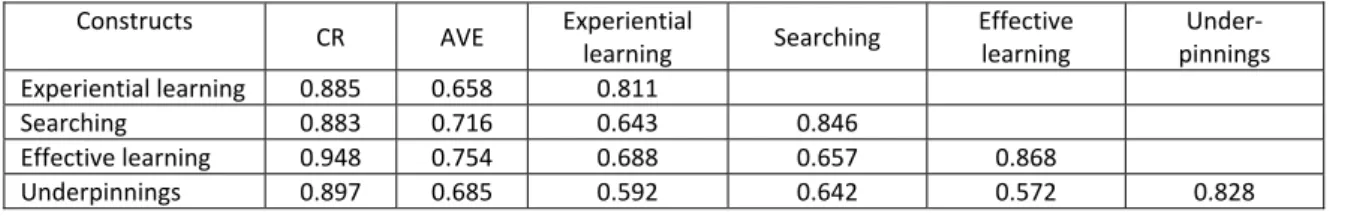
Internal consistency reliability ‐ For satisfactory internal consistency reliability, composite reliability of a construct should exceed 0.7 (Chin, 1998, Fornell and Larcker, 1981). As depicted in Table 6, composite reliability of all constructs was above 0.7. Thus, internal consistency reliability of individual constructs was satisfactory.
Table 6: CR, AVE, and construct correlations Constructs
CR AVE Experiential
learning Searching
Effective learning
Under‐ pinnings
Experiential learning 0.885 0.658 0.811
Searching 0.883 0.716 0.643 0.846
Effective learning 0.948 0.754 0.688 0.657 0.868 Underpinnings 0.897 0.685 0.592 0.642 0.572 0.828 Note: CR: composite reliability; AVE: average variance extracted; square roots of average variances extracted (AVE) are shown on diagonal; correlations between constructs are shown on off‐diagonal.
Convergent validity ‐ For satisfactory convergent validity, three criteria should be met: (1) composite reliability of a construct should exceed 0.7 (Chin, 1998; Fornell and Larcker, 1981); (2) average variance extracted (AVE) of a construct should exceed 0.5 (Chin, 1998; Fornell and Larcker, 1981); and (3) loading of scale items should exceed 0.7 on the intended construct (Barclay, Higgins and Thompson, 1995; Chin, 1998). When AVE is more than 0.5, the variance of individual constructs is larger than that contributed by the measurement error (Segars, 1997). As depicted in Table 6, composite reliability of all constructs was above 0.7. In addition, AVEs of all constructs were above 0.5. As depicted in Table 7, loadings of all scale items on the intended constructs were above 0.7. Thus, it was evident that all constructs had satisfactory convergent validity.
Table 7: Factor loadings and cross loadings Scale items
Experiential
learning Searching
Effective learning
Under‐ pinnings (D5) I know where to find information from
different sources (e.g. school library, online database, web).
0.758 0.558 0.504 0.418
(D16) I am comfortable with sharing information
with others in discussion. 0.828 0.537 0.541 0.480
(D17) I am motivated in learning new information
both online and offline. 0.813 0.423 0.514 0.434
(D18) I can critically evaluate the information that
I gather for its usefulness. 0.843 0.561 0.653 0.569
(D2) I can distinguish the differences between
print and online resources. 0.415 0.777 0.449 0.512
(D15) I can integrate information that comes from different sources (e.g. school library, online database, web).
0.572 0.879 0.635 0.600
(D1) I know how and where to search for useful
information both online and offline. 0.624 0.879 0.562 0.512
(L1) I am able to recall the material that I have
learned. 0.570 0.532 0.874 0.419
(L2) I am able to explain the material that I have
learned. 0.557 0.588 0.878 0.531
(L3) I am able to apply the material that I have
learned. 0.644 0.610 0.893 0.539
(L4) I am able to critically analyse a problem
situation to suggest solutions. 0.617 0.514 0.851 0.409
(L5) I am able to evaluate the quality of
information that I receive. 0.642 0.564 0.889 0.522
(L6) I am able to integrate material from different
resources to create useful information. 0.548 0.610 0.824 0.547
(D8) I am familiar with the web. 0.466 0.591 0.413 0.813
(D12) I use digital technology (e.g. computer, tablet, smartphone) often both at home and at school.
0.472 0.486 0.434 0.799
(D13) I am confident in using application software
(e.g. email, office suite, web browser). 0.504 0.602 0.529 0.883
(D20) I have the skills to use digital technology
(e.g. computer, tablet, smartphone) effectively. 0.514 0.449 0.501 0.813
Discriminant Validity ‐ For satisfactory discriminant validity, two criteria should be met: (1) scale items should load > 0.50 on the intended construct, but lower or weakly on the other unintended constructs (Straub, Boudreau and Gefen, 2004); and (2) the square root of AVE of a latent construct should be larger than the
correlation between that particular construct and any other constructs in the model (Chin, 1998; Fornell and Larcker, 1981; Gefen and Straub, 2005). As depicted in Table 6, it was evident that individual scale items loaded > 0.50 on their intended constructs and significantly lower on any other constructs. Table 6 provides evidence that the square root of AVE of individual constructs was higher than the correlation between it and any other constructs in the model.
4.3.2 Structural model
The structural model was examined next. A bootstrapping procedure of 500 sub‐samples was used to calculate t‐statistics of path coefficients between the exogenous and endogenous constructs (Gefen, Straub and Boudreau, 2000). As depicted in Figure 2, two‐tailed t‐statistics showed all path coefficients between the constructs were significant at p < 0.01 (t‐statistics > 2.57 were significant at p < 0.01). It was evident that the constructs of underpinnings, experiential learning, and searching explained about 56% of the variance in the effective learning construct (R2 = 0.561).
Figure 2: Structural model
5
Discussion
and
conclusions
This study set off to answer the question: Do students require digital literacy to be effective in learning in a blended learning environment? This study provides evidence that for blended learning to be successful, there is a need for students to be digitally literate. As concluded by Mohammadyari and Singh (2015), people who have high digital literacy can adapt well to e‐learning as they would find it easy to learn the technologies specific for educational purposes, and are more efficient and effective in information management.
Analyses show that the four digital literacy constructs conceptualised by Bawden (2008) can be reduced to three. These three constructs are: underpinnings, experiential learning, and searching, and together they account for more than half of the learning effectiveness of respondents in a blended learning environment at the local university. It is quite clear that to be digitally literate, a very basic requirement is possessing the skills to use digital technology. The similarities between Bawden’s (2008) digital literacy components and Huber’s (1991) knowledge acquisition processes explain how students can acquire knowledge in order to become digitally literate. In searching for information, students learn how and where to search for information effectively from different sources ‐ this helps build their background knowledge. In learning to synthesise information for new knowledge and sharing information with others, students gain experiences to build their competencies and develop the right attitudes and perspectives. These three constructs are also consistent with Ng’s (2012) digital literacy dimensions, i.e. technical, cognitive, and social‐emotional.
This study also highlights a notable observation. A higher percentage (74.5% vs. 63.9%) of the respondents prefer classroom learning as compared to online learning. In online learning, students and teachers do not normally meet physically but instead are connected on an online learning platform such as LMS (Prior et al., 2016). Phillips, Turnbull and He (2015) suppose that although online learning is becoming common these days because of its accessibility and flexibility, one needs a high level of self‐directed learning readiness in order to do well. Considering that 74% of the respondents have used LMS for just one or two semesters, it is likely that they have just joined the university from secondary schools where face‐to‐face classroom teaching is common. Thus, some respondents might lack the confidence and skills for self‐directed learning. The percentage of respondents who prefer blended learning (64%) is very close to that of online learning though.
It is also interesting to note that a higher percentage (82% vs. 45.9%) of the respondents find that face‐to‐face meetings (e.g. in‐class lectures, consultations with lecturers, group discussions, etc.) are more effective than online interactions (e.g. blogs, forums, chats, emails, etc.). Despite the convenience brought by digital technology and the respondents having a certain level of digital literacy, they still find the need to meet in classrooms. This might be due to the urge for some physical community connection with other students as well as lecturers amid the virtual world enabled by digital technology.
Given that today’s young university students (most respondents are below 25 years old at the university this study was conducted) generally have good knowledge of using digital technology in their everyday activities (e.g. finding information online, watching videos, listening to music, using social media, etc.), it is not a surprise that a higher percentage (70.2% vs. 63.4%) of the respondents find online resources (e.g. e‐books, digital databases, audio or video webcasts, etc.) more effective than physical resources (e.g. print books, school libraries, etc.). The top three most liked LMS features are online resources, online course announcements, and online assignment submission. Only 20.9% of the respondents like online discussions (e.g. blogs, forums, chats, etc.).
Learning from the findings of this study, when planning or delivering blended learning courses, lecturers need to first understand the students in terms of their level of digital literacy for learning. A good fit of digital literacy level to course expectations is necessary for successful blended learning. If some students have low digital literacy levels, additional exercises and tutorials can be used to help these students improve their digital literacy capabilities. Ng (2012) supports that students can learn to use educational technologies not familiar to them for learning if they are introduced to and given a chance to use these technologies. He reasons that the students would normally not use educational technologies unless there is such a need.
In addition, blended learning is reported to have increased student dropout rates (Deschacht and Goeman, 2015). One reason could be that unlike face‐to‐face classroom learning, blended learning requires a certain level of self‐directed learning. Phillips, Turnbull and He (2015) propose that self‐directed learning readiness is linked to three factors, i.e. self‐control, self‐management, and desire for learning. Prior et al. (2016) find that students who have strong self‐efficacy are more confident, independent, and motivated. They conclude that a positive student attitude and high digital literacy can improve self‐efficacy, which in turn contributes positively to such online behaviours as peer engagement, learning management system interaction, and convener interaction. Thus, by helping students to develop digital literacy, lecturers can also help foster self‐directed learning among the students.
5.1 Research limitations
The respondents in this study had different LMS usage experience. The majority of them (60.3%) had used the LMS for two or three semesters, but about a third for only one semester. How familiar they were with the LMS could influence their views of how useful the LMS was in their learning process. In addition, the respondents were from different courses. The types and levels of digital literacy capabilities required of them could be diverse across subject matter areas.
5.2 Future research directions
The study context was a local university that had adopted blended learning. Future studies can examine the original research model in different contexts, e.g. primary or secondary schools, professional courses, working adults, full‐time young students, etc. Also, the factors, i.e. underpinnings, experiential learning, and searching, explained slightly more than 50% of the variance in effective learning. There are other factors that could contribute to effective learning, e.g. environmental factors. Future studies can consider new factors, investigate interactions among the factors, and introduce moderators.
References
Akkoyunlu, B. and Yılmaz‐Soylu, M. (2008) “Development of a Scale on Learners' Views on Blended Learning and its Implementation Process”, Internet and Higher Education, Vol. 11, pp. 26‐32.
Barclay, D., Higgins, C. and Thompson, R. (1995) “The Partial Least Squares (PLS) Approach to Causal Modeling: Personal Computer Adoption and Use as an Illustration”, Technology Studies, Vol. 2, No. 2, pp. 285‐309.
Bawden, D. (2008) Origins and Concepts of Digital Literacy. In: Lankshear, C. and Knobel, M. (eds). Digital Literacies: Concepts, Policies and Practices, Peter Lang, New York.
Bawden, D. and Robinson, L. (2009) “The Dark Side of Information: Overload, Anxiety and Other Paradoxes and Pathologies”, Journal of Information Science, Vol. 35, No. 2, pp. 180‐191.
Benson, V. and Kolsaker, A. (2015) “Instructor Approaches to Blended Management Learning: A Tale of Two Business Schools”, The International Journal of Management Education, Vol. 13, No. 3, pp. 316‐325.
Bloom, B., Engelhart, M.D., Furst, E.J., Hill, W.H. and Krathwohl, D.R. (1956) Taxonomy of Educational Objectives: The Classification of Educational Goals, Longman, New York.
Blooma, M.J., Kurian, J.C., Chua, A.Y.K, Goh, D.H.L. and Lien, N.H. (2013) “Social Question Answering: Analyzing Knowledge, Cognitive Processes and Social Dimensions of Micro‐Collaborations”, Computers & Education, Vol. 69, pp. 109‐120. Brown, S.L. and Eisenhardt, K.M. (1998) Competing on the Edge: Strategy as Structured Chaos, Harvard Business School
Press, Boston.
Chin, W.W. (1998) “Issues and Opinion on Structure Equation Modelling”, MIS Quarterly, Vol. 22, No.1, pp. vii‐xvi. Coccoli, M., Guercio, A., Maresca, P. and Stanganelli. L. (2014) “Smarter Universities: A Vision for the Fast Changing Digital
Era”, Journal of Visual Languages and Computing, Vol. 25, pp. 1003‐1011.
Cohen, S., Thiraios, D. and Kandilorou, M. (2008) “Performance Parameters Interrelations from a Balanced Scorecard Perspective: An Analysis of Greek Companies”, Managerial Auditing Journal, Vol. 23, No. 5, pp. 485‐503. Cor zo, J.L., Rodríguez, E., Vijande, R., Sierra, J.M. and Noriega, A. (2010) “Blended Learning Applied to the Study of
Mechanical Couplings in Engineering”, Computers & Education, Vol. 54, pp. 1006‐1019. D2L. (2014) Blended Learning: Where Teaching Meets Technology. [Online] Available at:
<http://content.brightspace.com/wp‐content/uploads/Blended_Learning_Where_Teaching_Meets_Technology.pdf> [Accessed: 30 April 2015].
De Smet, C., Bourgonjon, J., De Wever, B., Schellens, T. and Valcke, M. (2012) “Researching Instructional Use and the Technology Acceptation of Learning Management Systems by Secondary School Teachers”, Computers & Education, Vol. 58, pp. 688‐696.
Deneshkumar, V., Senthamaraikannan, K. and Manikandan, M. (2014) “Identification of Outliers in Medical Diagnostic System Using Data Mining Techniques”, International Journal of Statistics and Applications, Vol. 4, No. 6, pp. 241‐248. Deschacht, N. and Goeman, K. (2015) “The Effect of Blended Learning on Course Persistence and Performance of Adult
Learners: A Difference‐In‐Differences Analysis”, Computers & Education, Vol. 87, pp. 83‐89.
Dunn, S.C., Seaker R.F. and Waller, M.A. (1994) “Latent Variables in Business Logistics Research: Scale Development and Validation”, Journal of Business Logistics, Vol. 15, No. 2, pp. 145‐172.
Eshet, Y. (2004). “Digital Literacy: A Conceptual Framework for Survival Skills in the Digital Era”, Journal of Educational Multimedia and Hypermedia, Vol. 13, No. 1, pp. 93‐106.
Fornell, C. and Bookstein, F.L. (1982) ”Two Structural Equation Models: LISREL and PLS Applied to Consumer Exit‐Voice Theory”, Journal of Marketing Research, Vol. 19, No. 4, pp. 440‐452.
Fornell, C. and Larcker, D.F. (1981) ”Structural Equation Models with Unobservable Variables and Measurement Error: Algebra and Statistics”, Journal of Marketing Research, Vol. 18, No. 3, pp. 382‐388.
Gable, G.G., Sedera, D. and Chan, T. (2003) ”Enterprise Systems Success: A Measurement Model”, Proceedings of the 24th International Conference on Information Systems, pp. 576‐591.
Garrison, D.R. and Kanuka, H. (2004) “Blended learning: Uncovering its Transformative Potential in Higher Education”, Internet and Higher Education, Vol. 7, pp. 95‐105.
Garrison, D.R. and Vaughan, N.D. (2013) “Institutional Change and Leadership Associated with Blended Learning Innovation: Two Case Studies”, Internet and Higher Education, Vol. 18, pp. 24‐28.
Gefen, D. and Straub, D. (2005) “A Practical Guide to Factorial Validity Using PLS‐Graph: Tutorial and Annotated Example”, Communications of the Association for Information Systems, Vol. 16, No. 5, pp. 91‐109.
Gefen, D., Straub, D.W. and Boudreau, M. (2000) “Structural Equation Modeling and Regression: Guidelines for Research Practice”, Communications of the Association for Information Systems, Vol. 4, No. 7, pp. 1‐77.
Gerbing, D.W. and Anderson, J.C.B. (1988) “An Updated Paradigm for Scale Development Incorporating Unidimensionality and Its Assessment”, Journal of Marketing Research, Vol. 25, No. 2, pp. 186‐192.
Gilster, P. (1997) Digital literacy, Wiley, New York.
Glogowska, M., Young, P., Lockyer, L. and Moule, P. (2011) “How ‘Blended’ is Blended Learning?: Students' Perceptions of Issues around the Integration of Online and Face‐To‐Face Learning in a Continuing Professional Development (CPD) Health Care Context”, Nurse Education Today, Vol. 31, pp. 887‐891.
Greene, J.A., Yu, S.B. and Copeland, D.Z. (2014) “Measuring Critical Components of Digital Literacy and their Relationships with Learning”, Computers & Education, Vol. 76, pp. 55‐69.
Gurung, B. and Rutledge, D. (2014) “Digital Learners and the Overlapping of their Personal and Educational Digital Engagement”, Computers & Education, Vol. 77, pp. 91–100.
Hair, J.F., Black, B., Babin, B., Anderson, R.E. and Tatham, R.L. (2005) Multivariate Data Analysis (6th ed.), Pearson, Upper Saddle River.
Huber, G. P. (1991) “Organizational Learning: The Contributing Processes and the Literatures”, Organization Science, Vol. 2, No. 1, pp. 88‐115.
Jisc. (2014) Developing digital literacies. [Online] Available at: <https://jisc.ac.uk/guides/developing‐digital‐literacies> [Accessed: 30 April 2015].
Jones, C., Ramanau, R., Cross, S. and Healing, G. (2010) “Net Generation or Digital Natives: Is there A Distinct New Generation Entering University?”, Computers & Education, Vol. 54, pp. 722‐732.
Joy, E. and Garcia, F. (2000) “Measuring Learning Effectiveness: A New Look at No‐Significant‐Difference Findings”, Journal of Asynchronous Learning Networks, Vol. 4, No. 1, pp. 3‐39.
Kember, D., McNaught, C., Chong, F.C.Y., Lam, P. and Cheng, K.F. (2010) “Understanding the Ways in Which Design Features of Educational Websites Impact upon Student Learning Outcomes in Blended Learning Environments”, Computers & Education, Vol. 55, pp. 1183‐1192.
Krathwohl, D.R. (2002) “A Revision of Bloom’s Taxonomy: An Overview”, Theory Into Practice, Vol. 41, No. 4, pp. 212‐218. MacKenzie, S.B., Podsakoff, P.M. and Jarvis, C.B. (2005) “The Problem of Measurement Model Misspecification in
Behavioral and Organisational Research and Some Recommended Solutions”, Journal of Applied Psychology, Vol. 90, No. 4, pp. 710‐730.
Margaryan, A., Littlejohn, A. and Vojt, G. (2011) “Are Digital Natives A Myth or Reality? University Students’ Use of Technologies”, Computers & Education, Vol. 56, pp. 429‐440.
Martin, A. (2006) “A European Framework for Digital Literacy”, Digital Kompetanse, Vol. 2, pp. 151–161.
McKenzie, W.A., Perini, E., Rohlf, V., Toukhsati, S., Conduit, R. and Sanson, G. (2013) “A Blended Learning Lecture Delivery Model for Large and Diverse Undergraduate Cohorts”, Computers & Education, Vol. 64, pp. 116‐126.
Mohammadyari, S. and Singh, H. (2015) “Understanding the Effect of E‐Learning on Individual Performance: The Role of Digital Literacy”, Computers & Education, Vol. 82, pp. 11‐25.
Moskal, P., Dziuban, C. and Hartman, J. (2013) “Blended Learning: A Dangerous Idea?”, Internet and Higher Education, Vol. 18, pp. 15‐23.
Ng, W. (2012) “Can We Teach Digital Natives Digital Literacy?”, Computers & Education, Vol. 59, pp. 1065‐1078. Owston, R., York, D. and Murtha, S. (2013) “Student Perceptions and Achievement in a University Blended Learning
Strategic Initiative”, Internet and Higher Education, Vol. 18, pp. 38‐46.
Phillips, B. N., Turnbull, B. J. and He, F. X. (2015) “Assessing Readiness for Self‐Directed Learning within A Non‐Traditional Nursing Cohort”, Nurse Education Today, Vol. 35, pp. e1–e7.
Porter, W.W., Graham, C.R., Spring, K.A. and Welch, K.R. (2014) “Blended Learning in Higher Education: Institutional Adoption and Implementation”, Computers & Education, Vol. 75, pp. 185‐195.
Prior D. D., Mazanov, J., Meacheam, D., Heaslip, G. and Hanson J. (2016) “Attitude, Digital Literacy and Self Efficacy: Flow‐ On Effects for Online Learning Behavior”, Internet and Higher Education, Vol. 29, pp. 91‐97.
Segars, A.H. (1997) “Assessing the Unidimensionality of Measurement: A Paradigm and Illustration within the Context of Information Systems Research”, Omega, Vol. 25, No. 1, pp. 107‐121.
Staker, H. and Horn, M.B. (2012) Classifying K–12 Blended Learning, Innosight Institute, Lexington.
Straub, D., Boudreau, M. and Gefen, D. (2004) “Validation guidelines for IS positivist research”, Communications of AIS, Vol. 13, pp. 380‐427.
Tabachnick, B.G. and Fidell, L.S. (2006) Using Multivariate Statistics (5th ed.), Pearson, Boston.
Ting, Y. (2015) “Tapping into Students' Digital Literacy and Designing Negotiated Learning to Promote Learner Autonomy”, Internet and Higher Education, Vol. 26, pp. 25‐32.
Tyran, C.K. (2010) “Designing the Spreadsheet‐Based Decision Support Systems Course: An Application of Bloom's Taxonomy”, Journal of Business Research, Vol. 63, No. 2, pp. 207–216.
Waycott, J., Bennett, S., Kennedy, G., Dalgarno, B. and Gray, K. (2010) ”Digital Divides? Student and Staff Perceptions of Information and Communication Technologies”, Computers & Education, Vol. 54, pp. 1202‐1211.