Int. J. Food System Dynamics 8 (2), 2017, 130-145
DOI:http://dx.doi.org/10.18461/ijfsd.v8i2.824Perception of Performance Indicators in an Agri-Food Supply
Chain: A Case Study of India’s Public Distribution System
Shweta Chopra
1, Chad Laux
2, Edie Schmidt
2, and Prashant Rajan
31Agriculture and Biosystems Engineering, Iowa State University , USA 2Technology Leadership & Innovation, Purdue University, USA 3
English Department, Iowa State University, USA
[email protected], [email protected], [email protected], [email protected] Received September 2016, accepted February 2016, available online April 2017
ABSTRACT
Availability of nutritious, safe food, and guaranteed resources for a hou sehold to acquire food at all times results in food security. Availability of food at affordable price remains the greater challenge. Currently, the Indian government runs the Public Distribution System to provide commodity subsidies to households. Various government and private stakeholders are involved in making this procurement, storage, processing and distribution process work. The involvement of a large number of stakeholders, each with different interests, increases the complexity and difficulty to identify performance indicators of the supply chain. Current research evaluates the relationship among the participating stakeholders in the public distribution system and ways in which these stakeholders construct the definition of performance measurements. This is done by utilizing a case study of Public distribution system: rice supply chain management in Chhattisgarh, India. To investigate the role and relationship of the stakeholders, first the rice supply chain is mapped. Once the stakeholders are ident ified, the study then focuses on comprehending relevant performance indicators and how they are defined in the supply chain.
Keywords: Supply chain management, performance indicators, Public Distribution System, agri -food supply chain, India
1
Introduction
Every product that reaches a customer represents the cumulative effort made by each stakeholder in the supply chain. Effective management of a supply chain is important to maximize the value derived by customers (Beamon, 1999). An effective supply chain helps gain customers and allows the stakeholders to stay competitive in the market while reducing the cost of logistics (Gunasekaran, Patel, & Ronald, 2004). In this study, we identified key indicators that are essential to measure the performance of a publically owned supply chain. We utilized a case study approach to investigate and to identity the key stakeholders in the rice supply chain in the state of Chhattisgarh, India, and to demonstrate how individual stakeholders perceive the importance of performance indicators in this supply chain.
Food Security and the Public Distribution System
The Indian government runs various programs to feed its citizens. The Public Distribution System (PDS) is one of the programs run by Indian government to provide commodity subsidies to beneficiary households. The PDS provides each beneficiary household with predetermined quantities of grains (rice and wheat), sugar, and kerosene (Khera, 2011). An estimated 160 million beneficiary households purchase their subsidized monthly entitlement of commodities through a network of 480,000 fair price shops (FPSs). The efficacy of the PDS as an enabler of food security has been hampered by the diversion of commodities to the open market as well as by leakages during procurement and transportation of commodities. The majority of the leakage is due to unethical stakeholder practices, distribution and transportation of commodities, and inventory errors. Chhattisgarh has tried to address these problems of diversion and leakages through the use of technological interventions (Dhand, Srivastav, Somasekhar, & Jaiswal, 2008; Khera, 2011). In this study, we identified performance indicators for individual stakeholders in the PDS supply chain.
Rationale
The purpose of this study was to: (a) develop and evaluate performance measurement indicators of the PDS and (b) determine how performance-related concepts become meaningful for different PDS stakeholders. Authors investigated (a) the relationship among participants within the stakeholder organizations, (b) the interaction of participants within the PDS supply chain, and (c) the relationship among performance indicators in the supply chain process. The overall goal of the current study is to evaluate the conceptual framework developed by Aramyan et al., (2006) by utilizing data from Chhattisgarh rice supply chain. Based on collected data analysis authors identified relationship of performance indicators in the various steps of supply chain and stakeholders relation to the perfor mance indicator.
Researchers have utilized qualitative methods of research design to focus on agri -food supply chain performance indicators (Aramyan et al., 2006; Van der Spiegel, Luning, Ziggers, & Jongen, 2003; Van der Vorst, 2000). In this study, a case study research design method (Yin, 2003) was utilized for the sampling, data collection, analysis, and reporting.
2
Literature Review
Supply chain management focuses on the process management within and beyond organizational boundaries. Evaluating performance of various processes effecting supply chain is one of the key criteria for the effective management of the supply chain. Due to the presence of multiple stakeholders in a supply chain with varied interests, it becomes extremely difficult to measur e overall supply chain performance (Lambert & Cooper, 2000). There is no single approach to measure the supply chain performance (Beamon, 1999). Individual stakeholders in a supply chain tend to focus on improving the particular performances aspect of supply chain, which impacts them the most. Independent stakeholders in a supply chain cannot compete with each other. In fact, they need to work together to improve the performance of whole supply chain for increasing the benefits associated within the chain, staying competitive and maximizing profit (Chopra & Meindl, 2007; Christopher, 2005; Cox, 1999; Lambert & Cooper, 2000).
Supply chain management is the integration of business processes and relationships at different stages within (a) an organization, (b) an immediate supplier, (c) tier-one and tier-two suppliers, and (d) the entire supply chain. The objective of supply chain management is to “maximize the overall value generated” (Chopra & Meindl, 2007, p. 5) and to increase the competitive advantage of the entire supply chain rather than increasing the competitive advantage of a single firm. Each stakeholder in the supply chain has its own goals, which makes it difficult to understand the performance indicators and optimizing criteria as
well as to manage the entire supply chain (Aramyan, Lansink, Van Der Vorst, & Van Kooten, 2007). A performance measurement mechanism should be able to (a) identify supply chain performance, (b) focus attention on areas of improvement, and (c) detect any problems in the supply chain (Cohen & Roussel, 2005; Gunasekaran et al., 2004). Performance measurement helps with the allocation of resources to reach strategic goals (Ittner & Larcker, 2003) and also helps managers recognize positive and negative results and balance resources (Neely, Gregory, & Platts, 1995). Performance measurement plays a vital role in managing business as it provides information essential for decision-making and actions. Performance measurement is also effected by politics, emotions and various behavioral issues as well. Well-developed performance measurement metrics will enable transparent and clear communication among different stakeholders and enable improved organization performance (Gunasekaran & Kobu, 2007). Overall performance measurement will provide a process for quantifying efficiency and effectiveness of an action.
Even though there is a rising awareness about performance measurement, there is still a lack of universal performance measurement instruments for various types of supply chains (Beamon, 1999; Gunasekaran et al., 2004). More recently, researchers have attempted to include both financial and nonfinancial indicators of supply chain performance that may be applied at different levels of the organizational hierarchy (Gunasekaran et al., 2004). Customer, owners and personnel are described as the main interest group which should be included in the supply chain management systems by combining operational and financial data, operational objectives and critical success factors for the firm (Korpela et al., 2002). Customer satisfaction, flexibility and efficiency was considered main categories of performance indicators which will include quality, time and cost within this main categories (Korpela et al., 2002). Efficiency and effectiveness was considered important factor for measuring the supply chain performance (Lai et al., 2002). Lai et al (2002) identified responsiveness, reliability, costs and assets as four performance indicators. Li and O’Brien (1999) identified in order to improve the efficiency of the supply chain focus should be on reducing lead times, reducing manufacturing stages, and working interactively with diff erent stakeholders in the supply chain.
The literature on supply chain performance has historically been dominated by nonagricultural sectors such as manufacturing, transportation, and steel production (Aramyan, Christien, Olaf, & Alfons, 2006). Agri-food supply chain is similar to traditional supply chains but with the product being agriculture/horticulture based. In agri-food supply chain, people from different organizations work together on different processes and activities in order to bring product o r service to market, with the purpose of satisfying customer demand (Christopher, 2005). An agri-food supply chain may be defined as a supply chain involved with the production and distribution of agricultural products along with the flow of information (Aramyan et al., 2006; Christopher, 2005). There are two types of agri -food supply chains: (a) fresh food supply chains, which deal with commodities having a limited shelf life, and (b) processed food supply chain in which the shelf life of the commodity is increased with processing (Aramyan et al., 2006). Product availability, quality, responsiveness, delivery reliability, and total supply chain costs are the five performance indicator suggested by Van de Vorst (2000) in food supply chain level. An agri -food supply chain is easily effected by government policy changes and environmental variability. Variability and environment and policy can change the lead time of the supply chain effecting food quality such as freshness, food safety, etc. Thus all the above described factor should be considered along with financial and non-financial factor while developing agri-food supply chain performance measurement system (Aramyan et al., 2006)
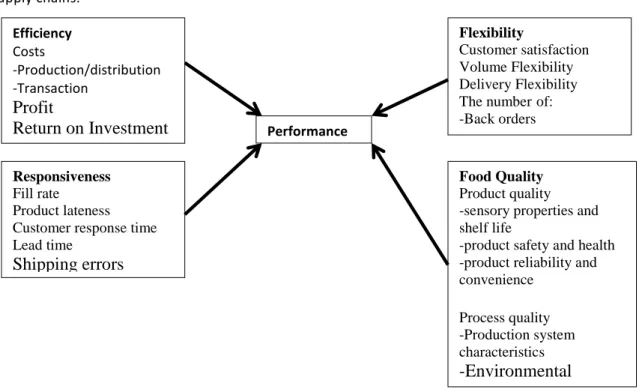
For this research, we utilized the conceptual framework developed by Aramyan et al. (2006) (shown in figure 1) for a performance measurement system of agri-food supply chains. Conceptual framework for agri-food supply chain was developed using specific characteristics of agri -food supply chains. This framework addresses the characteristics of the agri-food supply chain and consists of four main categories: (a) efficiency, (b) flexibility, (c) responsiveness, and (d) food quality (Aramyan et al., 2006). Three categories efficiency, flexibility and responsivenessis chosen based on previously used indicators of supply chain performance measures in wide variety of field such as steel prod uction (Eppen, 1979); Manufacturing such as computer, mechanical products (Beamon, 1998, 1999; Lee, 2010; Lee & Billington, 1992; Olhager, Persson, Parborg, & Linkoping, 2002); Transport such as air and sea transport, freight forwarding, and third-party logistics services (Lai, Ngai, & Cheng, 2002); Different mechanical industries based in Europe (Gunasekaran et al., 2004) and agri-food supply chain (Aramyan, Lansink et al., 2007; Aramyan et al., 2006; Van Der Vorst, Beulens, & Beek, 2005; Van Der Vorst, 2 006). Food quality is an additional indicator added to measure the intrinsic quality (physical property: texture, flavor, appearance nutritional value and shelf life) and extrinsic quality (production system: pesticide use, packaging material, and biotechnology (Jongen, 2000). Luning et al. (2000) further described food quality into three aspects 1) food safety and health, 2) sensory properties and shelf life, 3) product reliability and convenience. Adding food quality into the three indicators derived from literature helped in develop a framework for agri-food
supply chains.
Figure 1. Conceptual framework of ASC performance indicators (adopted from Aramyan et al.).
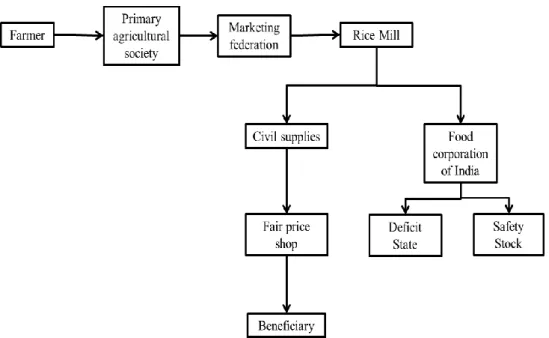
To understand performance indicators in the agri-food supply chain, a case study of the rice supply chain in Chhattisgarh was conducted. The rice supply chain of Chhattisgarh, a processed food supply chain, may be defined as one linking each element of the production and supply process from farmer through consumer and encompassing several organizational boundaries. It has the following characteristics: (a) it is an agri-food supply chain, (b) it is government administered, (c) it is seasonal, (d) it deals with a food commodity with a long shelf life, (e) it is public-policy rather than consumer driven, and (f) it has mixed public–private ownership. The members of the Chhattisgarh agri-food supply chain comprise farmers; various governmental agencies, such as the Chhattisgarh Marketing Federation (also referred to as the marketing federation); Chhattisgarh State Civil Supplies Corporation (also referred to as civil supplies); and the Food Corporation of India (FCI), all of which take part in procurement, storage, and distribution of the food grain. Processors, private rice millers, and FPS retailers all have a role in delivering food grain to consumers (aka beneficiaries).
The focus of the present study is on the objective of understanding how extant indicators of agri -food supply chain performance assume significance for a set of stakeholders in a supply chain contextualized by geographical location (Chhattisgarh), product category (rice), and policy imperatives (control by government of most supply chain operations). These categories were adopted for this study to evaluate the rice supply chain performance indicators of the PDS in Chhattisgarh.
3
Methodology
Sampling Criteria and Data Collection
Given the complexity of the PDS and the exploratory nature of this study, an on -site field study was conducted to collect data through semi-structured in-depth interviews with, presentations to, and observation of PDS participants. The first step in field work involved choosing a representative and reliable sample, defined as participants from the organizations under study. Gaining access was the first obstacle to overcome and involved securing entry into these organizations (Shenton & Hayter, 2004). Archival research helped to identify the role of the individual stakeholders before the field work commenced. From the literature review, stakeholder documents were identified and then collected and analyzed to support the development if the sample. In addition, using an existing relationship between one of the researchers and a rice mill owner, we gained access to a rice millers orga nization’s database, which was utilized to identify other stakeholders.
To achieve a purposive sample, participants in the field were selected through snowball sampling. Snowball sampling entails identifying stakeholders with specific attributes, in thi s case, private and public
Efficiency Costs
-Production/distribution -Transaction
Profit
Return on Investment
Inventory
Food Quality Product quality -sensory properties and shelf life
-product safety and health -product reliability and convenience Process quality -Production system characteristics
-Environmental
aspects
-Marketing
Responsiveness Fill rate Product lateness Customer response time Lead timeShipping errors
Customer Complaints
Flexibility Customer satisfaction Volume Flexibility Delivery Flexibility The numberof: -Back orders-Lost Sales
representation of the PDS (Creswell, 2009). After gaining access, 20 rice mill owners were interviewed along with production workers across the Chhattisgarh districts. With the help of rice millers, other stakeholders were identified in both directions of the PDS supply chain and were approached. These stakeholders included senior officials from the National Informatics Center, the Planning Commission of India, and the governments of India and Chhattisgarh.
The type of interviews conducted in this study follow Yin (2003). Interviews consisted of open -ended questions inquiring about (a) firm operations, (b) challenges and benefits associated with participating in the PDS, and (c) how the organization integrates within the PDS supply chain. The purpose of the interviews was to understand the participants’ construct of PDS performance measurement indicators. Other data collected included videos and photographs of various PDS processes for analysis, all resulting in comprehensive field notes (see Table 1).
Data Analysis and Validation
The data collected through multiple stakeholders were organized based on the category of each stakeholder group and subsequently on relevant performance indicators so that we could search for patterns in the data (Denzin & Lincoln, 2005). A descriptive orientation was utilized with the objective of understanding how agri-food supply chain performance indicators become relevant across the different organizations, representing the various stakeholders constituting the PDS rice supply chain in Chhattisgarh (Yin, 2003).
Table 1.
Stakeholder Data Collected from within the Supply Chain
Stakeholder No. of
Participants
Data Collection
Duration (hours)
Video Audio Photographs Field
Notes Meeting Place
Multiple Visits
Technology Used Prior to August 2012
Rice millers 20 40 Process Yes Machinery Yes Rice mills Yes Machines for
processing, smart phones, computer,
Marketing federation 4 8 No No No Yes Office Yes Computer
Civil supplies 7 14 No Yes Yes Yes Office Yes Computer
Primary agricultural society
5 2.5 No Yes Yes No Procurement
center
No Computer
Food Corp. of India 2 4 No No No Yes Office No Computer
Fair price shop (FPS) 10 20 No Yes Yes No FPS Yes No, some are now
using POS machine
Farmers 25 10 No Yes No No Village and
home
Yes No
Beneficiaries 25 7.5 No Yes Yes No FPS and
municipality
Yes No
Total 98 101.5 hours 4 clips 40 clips 42 ~200
4
Case Study: Stakeholders of the Rice Supply Chain
Beneficiaries
The beneficiaries the rice supply chain are low-income residents who get an ~11.66 USD per month subsidy for purchasing under from the PDS (Khera, 2011). There are 5.4 million beneficiaries in the Chhattisgarh state (Dhand et al., 2008). Beneficiaries are required to obtain a rati on card to receive their food rations. Ration cards are issued to the head of the household by the state government after assessing the family’s land holdings and other belongings (such as jewelry, house, etc.).
Farmer
Two-thirds of India’s population earns its livelihood by farming, and a majority has low or medium income (Patel, 2010). Due to a lack of storage facilities and the requirement of cash to repay loans, it is in the farmers’ best interest to sell and move their product as soon as it is harves ted, which makes them vulnerable to exploitation through market manipulation (Dhand et al., 2008). Farmers may be forced to sell their product for less than market value or to sell to a middleman who has storage capacity, reducing margins.
To mitigate manipulation and market fluctuations, the Indian central government operates a system to purchase the product from farmers at a minimum support price, precalculated by the central government. In Chhattisgarh, the government procures rice only during the Kharif marketing season. Farmers selling a field (paddy) to the government receive several benefits: (a) higher profits, as the government sets a minimum support price; (b) a guaranteed customer in the form of the government; (c) payment at time of sale; and (d) local procurement and storage capacity to minimize travel.
The rice paddy is the main agricultural product in Chhattisgarh, produced by approximately three million farmer families, approximately half of which have landholdings smaller than two hect ares (Dhand et al., 2008). There are two harvest seasons in Chhattisgarh: Kharif (winter crop) and Rabi (summer crop). Most farmers grow only during the Kharif season, when better irrigation is available. For this study, we focused on the Kharif season, during which the majority of the paddy is procured by the state government on behalf of the central government for PDS beneficiary distribution. Any remaining rice may be sold by the farmers in the open market or directly to millers.
Chhattisgarh Primary Agricultural Cooperative Society
The Chhattisgarh Primary Agricultural Credit Society (also referred to as the primary agricultural society) plays a crucial role in the improvement of social and economic conditions of the farmers in Chhattisgarh (Dhand et al., 2008). The society provides reasonable-rate loans to farmers for purchasing, storing, and processing of their agricultural products. The primary agricultural society also procures the paddy from the farmers on behalf of a marketing federation.
Chhattisgarh Marketing Federation
he marketing federation is responsible for procurement, storage, and milling of the paddy, and for the distribution of the rice for civil supplies and FCI, both public organizations in the PDS (Dhand et al., 2008). Local, open storage centers keep the paddy under cover and plinth (aka CAP, an indigenous storing method). Once millers process the rice, it is inspected for quality, transported, and stored. The federation is also responsible for monetary transactions for the rice and FCI for payment to the primary agricultural society.
Rice Millers
Rice millers are private participants in the PDS. In Chhattisgarh, by state government policy, rice millers are required to devote a minimum of 50 percent of their milling capac ity to government paddy processing. This is referred to as custom milled rice. Millers may also process rice during the summer season for open sale or export. Custom milled rice profit margins are very low, as millers find it difficult to procure paddies at a reasonable (miller) price for open sale or export given that the government procures all Kharif season paddies at the minimum support prices.
Food Corporation of India
The FCI is the central government organization responsible to Chhattisgarh fo r procurement and transportation of excess inventory of rice to other Indian states for emergencies. Other FCI responsibilities include the enforcement of Kharif minimum support prices and storage and distribution of food for the PDS.
Chhattisgarh State Civil Supplies Corporation Limited
Civil supplies is a Chhattisgarh organization (Dhand et al., 2008) responsible for procuring and storing rice and other commodities such as wheat, peas, salt, sugar, and kerosene oil for distribution to the PDS via the 11,032 FPSs in Chhattisgarh state. Civil supplies is responsible to the FPSs for FPS inventory levels, along with physical food inspection audits. Civil supplies mandates a two -month buffer of supplies in the PDS and arranges transportation and labor for the distribution of the PDS commodities from FCI and civil supply warehouses to individual FPSs.
Fair Price Shop
The FPS is a place where a beneficiary, on behalf of the household, comes to purchase the subsidized commodities based on a ration card (Khera, 2011). FPSs are typically administered by self-help groups, female-led organizations, or cooperatives to improve accountability and reduce leakage (Puri, 2012). There are no privately owned FPSs in Chhattisgarh state. The government provides a stipen d (approximately one dollar per 100 kgs of commodities distributed) to the FPS and pays all transportation costs.
5
Findings and Discussion
The initial purpose of the study was to map the PDS stakeholders and describe their relationships; this is shown in Figure 2. Second research question focuses on defining the understanding of performance indicators by each stakeholders based on conceptual framework developed by Aramyan et al ., 2006. The current research reports how our informants discussed issues parti cularly related to performance related challenges and opportunities in Chhattisgarh’s rice supply chain. Specifically, current research discussed how performance related concepts that are derived from the literature become salient for members of key stakeholder groups participating in the various stages of the rice supply chain in Chhattisgarh. Table 2 represents role of each stakeholders in the rice supply chain and performance indicators relevant for those stakeholders.
Table 2.
Key Performance Indicators for the Individual Stakeholders of the PDS in Chhattisgarh
Step Stakeholder Key Performance Indicators Identified
Procurement
Farmers Flexibility, efficiency
Marketing federation Responsiveness, food quality Processing
Rice millers Flexibility, efficiency, responsiveness, food quality Storage
Civil supplies Responsiveness, food quality Food Corporation of India Food quality
Distribution
Fair price shop Flexibility, efficiency, responsiveness, food quality Beneficiaries Flexibility, responsiveness, food quality
Flexibility
Flexibility in agri-food supply chains may be understood as “the degree to which the supply chain can respond to a changing environment and extraordinary customer service requests” (Aramyan et al., 2007, p. 308) and includes: (a) customer satisfaction, (b) volume flexibility, and (c) delivery flexibility (Beamon, 1998). Each of these components is interpreted differently by individual stakeholders and is discussed below.
Customer satisfaction. Customer satisfaction is the extent of satisfaction with products and services experienced or reported by customers (Aramyan et al., 2007). During interviews with public representatives, participants clarified that they did not conceive of relationships among government agencies in terms of customer service. Rather, each agency perceived itself as an independent provider of public services rather than part of a supply chain, transacting with other organizations. As a district marketing officer of the marketing federation in Chhattisgarh stated, “We work for the government. Our mission is to serve the people.” Similarly, the depot manager of the FCI stated, “I act in an independ ent capacity as a representative of a central government institution. Our interest is in safeguarding the interests of the farmers.”
Due to government monopolization of procurement, storage, processing, and distribution of rice during the Kharif season, dissatisfied nongovernmental stakeholders cannot exit from the supply chain without exiting from the region altogether. Under these circumstances, the voice of the customer becomes salient primarily for two nongovernmental stakeholders—rice millers and beneficiaries—but not for farmers. Rice millers were perhaps the most vocal due to the organization of their private interests against heavy -handed government behavior. This behavior included: (a) high variability in procured rice quality, (b) unspecified and high variability in paddy harvest and delivery time to millers, (c) unpredictability in milling capacity expected to be processed for the PDS, (d) high variability in paddy harvest yield information supplied by the marketing federation, (e) unspecified and highly variable lead times for government procurement of processed rice, and (f) annual policy changes. As there are no formal procedures for millers to register customer dissatisfaction, millers strike by refusing to participate in the PDS and raise the above issues through the Chhattisgarh Rice Millers Association.
Beneficiary concerns are approached differently, as the beneficiaries remain geographically dispersed and lack resources. Nonetheless, the government has implemented a number of technolo gical interventions to empower beneficiaries based upon their role also as citizens. Customer service improvements include the computerization of FPS operations to display of FPS–beneficiary transactions, text message updates of expected FPS delivery of commodities, and creation of a call center for registering complaints. Regardless, interviews with beneficiaries indicated a lack of awareness and utilization of these efforts despite beneficiary awareness of their PDS entitlements.
Volume flexibility. Volume flexibility is defined as the ability of stakeholders to “change the output levels of products produced” (Aramyan et al., 2007, p. 308). Volume flexibility for farmers, defined as paddy yield, is dictated by the government and based on acreage and tonnage. For millers, volume flexibility is limited because of civil supplies and FCI processing stipulations of the Kharif season. At distribution, FPSs contend with regulations to link inventory and beneficiary transactions to mitigate leakage and maint ain stock. Implementation of an electronic PDS (ePDS) gives each FPS the ability to reorder when its inventory level reaches 50 percent. The ePDS is a state government intervention that allows beneficiaries to use a smart card and FPSs to use a point-of-sale device to conduct transactions. All sales transactions are recorded on a government-hosted server.
Delivery flexibility. Delivery flexibility is defined as “the ability to change planned delivery dates” (Aramyan et al., 2007, p. 308). During procurement, farmers enjoy limited delivery flexibility for two key reasons. First, farmers have a window of 3 months, from November to January, to deliver their Kharif season harvest to storage centers noted above. The delivery window has removed the farmers’ ability and interest to search for higher market prices. Furthermore, not all farmers harvest and deliver at the end of the 3 months. Because the government window is fixed annually, the cost of harvesting, storage, and transportation is higher as farmers compete to rent harvesting equipment and hire in a tight labor market. Smaller farmers are more likely to be negatively impacted by the higher operational costs imposed by this arbitrary seasonal constraint on delivery flexibility. Second, because many farmers lack their own storage capacity, the government’s minimum support price is more attractive. Delivery flexibility for millers depends on the availability of storage space at FCI or civil supplies warehouses. Millers prefer early completion of PDS milling responsibilities. Historically, millers have completed PDS milling before the monsoon season in early June, during Rabi season. The stricter government enforcement of PDS food quality has led to widespread storage shortages and delayed milling. Paddy purchases by the government has increased threefold since 2004 (Sharma, 2012). For FPSs, delivery flexibility varies depending on the consistency of delivery from civil supplies warehouses.
Efficiency
Efficiency may be understood as a measure of resource utilization. Efficiency measures include costs of production, inventory and distribution, transaction costs, profit, and return on investment (Aramyan et al., 2007). Because the government does not identify performance through customer service, as noted above, considerations of efficiency are limited to farmers, millers, and FPSs, all private, independent organizations, resulting in limited or no discussion of PDS supply chain efficiency.
Production and distribution costs. These are fixed and variable costs that include those related to raw materials, labor, transportation, distribution, and handling costs. During procurement, production costs for farmers are higher because of the competition noted above due to the fixed Kharif season window. However, distribution costs are lower due to government-supported local storage centers. Because the government promises to purchase the majority of Kharif season rice within estimated yield limits, farmers’ production costs do not extend to ensuring the highest quality. During processing, miller production costs extend to operations to meet the rice quality mandates enforced by the government. Production and distribution costs are also dependent on the negotiated milling amount for the PDS set by the government. Nevertheless, opportunities for “free sale” of surplus rice in the open domestic and international markets present strong incentives for millers to incur significant production costs. Thus, several affluent millers have invested in advanced technology, such as optical sorting, to increase the grain milling efficiency through improved grading by identifying and removing visual defects (e.g., discoloration) and foreign matter (e.g., stones, glass), polishing to improve grain appearance, and obtaining uniform grain length. FPSs do not incur production and distribution costs as they act only as distributors and these costs are borne by the government.
Profit and return on investment. Notions of profit and return on investment for the PDS (defined as the ratio of net profit to total assets) are absent from government organization communications. A key distinguishing characteristic of agricultural supply chains is that members enter into conditional agreements that restrict their ability to supply to others outside the supply chain; for example, growers are proscribed from selling to wholesalers who are not supply chain members (Armayan et al., 2006). In contrast, farmers producing rice in Chhattisgarh are free to sell their harvest to the bidder of t heir choice but choose to sell most of their Kharif season crop to the government for the PDS. Because the transaction costs accrued by the farmer are mitigated by a government -mandated minimum price support, it becomes the de facto maximum price support. Again, because the government identifies with mission, rather than customer service, a consequence is that farmers may lack financial literacy, defined as understanding market prices and costs, because they lack the motivation due to government
intervention. As Kishore Chopra, a prosperous farmer–businessman from Mahasamund, explained, “farmers may not pay attention to their [production costs] as long as they are muzzled by the minimum support price offered by the state” (Personal communication, July 12, 2013). However, the Rabi crop sells on the open market for less than the minimum price-supported Kharif crop (Kishore Chopra, personal communication, August 1, 2013). Thus, the lack of farmer transaction costs during the sale of the Kharif crop, combined with a lack of financial literacy, may lead to lower profits and return on investments in the long term.
Rice millers are affluent stakeholders and have good understanding of the market. Their profit depends on not only just custom milling but also on selling by-products, such as husk for brick manufacturing, bran for oil production, broken rice for alcohol production or open market, and cattle feed. Millers receive a high return on investment as they have multiple sources of revenue along with strong infrastructure investment.
Fair price shops receive fixed compensation based on the number of beneficiaries served. This has remained unchanged for decades, and only recently has compensation increased due to administrative reforms in 2001–2004. In 2012, with the implementation of the ePDS, compensation increased the competition among the FPS, resulting in changes in profit margins, as it is now driven by the quality of service to beneficiaries and, consequently, the volume of beneficiaries served.
Inventory costs matter less to farmers during the Kharif season due to the government storage support noted above, but the fixed delivery window has resulted in a scarcity of storage capacity toward the end of the Kharif season, resulting in unfavorable conditions for farmers who lack their own storage. For rice millers, the fluctuation in inventory levels due to the government’s response to storage scarcity is the mandate of millers to take higher volumes of PDS rice. Higher inventory increases miller costs incurred exclusively by the businesses. During interviews, millers mentioned that, due to these higher levels of inventory, they have to shut down milling operations due to lack of storage. Their concerns included theft and quality deterioration of stored, milled rice. Inventory costs for FPSs are borne by individual shops but are low due to high volume flexibility.
Responsiveness
A responsive supply chain is one that has a short lead time for the product. A responsive supply chain can address variations in the chain smoothly and efficiently. Responsive measures include fill rate, product delay, customer response time, lead time, shipping errors, and customer complaints.
Fill rate. Fill rate is defined as “the percentage of units ordered that are sh ipped on a given order” (Aramyan et al., 2007, p. 308). Fill rates matter in the processing and storage stages. Millers must fulfill the processing agreement of a paddy in a given contract as soon as possible and can deliver only the complete lot size. A lot size consists of 540 bags (i.e., 270 metric tons) delivered to the FCI or civil supplies warehouse.
Product delay. Product delay is defined as the difference in time between the actual delivery date and the promised delivery date. This affects mainly the FPSs and beneficiaries. The government requires each FPS to receive the commodity from civil supplies for distribution to beneficiaries under PDS by the first week of every month at the latest so that it can be distributed to beneficiaries on tim e.
Customer response time. Customer response time is the length of time between when an order is placed and when it is delivered. Customer response time didn’t seem to matter to most of the stakeholders because of the seasonal nature of the product, and none of the stakeholders discussed it much. However, this is relevant to beneficiaries because they prefer to get their commodities from the FPS only once or twice (for example, some of them don’t want to carry kerosene oil with other food commodities). Otherwise, beneficiaries have to make multiple visits to the FPS.
Lead time. Lead time is the total time required to produce an item. Because paddy procurement occurs only during a 3-month period, this time is fixed for the Kharif season. During proce ssing and storage, lead times are negotiated between the individual millers and FCI/civil supplies. Lead time varies across FPSs depending on delivery of the commodity from civil supplies. This delivery date affects the ability of FPSs to service beneficiaries on time. With the adoption of point-of-sale devices, lead time has become much more important because FPSs can reorder commodities in the middle of a monthly cycle, whenever the stock levels drop below 50 percent. If the order fulfillment is delay ed, it directly affects the beneficiary and the FPS will lose customers.
Customer complaints. Customer complaints matter most to the FPSs and beneficiaries, as both these stakeholders have the ability to complain through proper government channels. For b eneficiaries and FPSs, the ability to lodge complaints serves as a deterrent to grain being stolen by FPS owners. However,
beneficiaries mentioned that much of the time their complaints remained unheard. Rice millers are able to exercise informal complaints regarding paddy quality. Similarly, FPSs complained about the late receipt of rice. Rice millers use their association to reach out to the government and to raise their voices, as they believe it is more effective. Customer complaints may be traditionally understood as the degree to which the expectations of the receivers or buyers are met. However, in the case of the rice supply chain of Chhattisgarh for PDS during procurement, it is the suppliers/growers/farmers who also act as customers of the government given that they are the source of raw material. They have access to a complaint recording system.
None of the stakeholders, with the exception of the FPSs, mentioned much about shipping errors. The FPSs mentioned that if they receive an incorrect order—for example if they get two allotments of rice instead of wheat—they cannot provide the correct commodity to the beneficiaries. As a result, the civil supplies needs to work on reducing shipping errors so that commodities can be delivered to the beneficiaries on time.
Food Quality
Food quality is the performance category that is most relevant to agri -food supply chains (Aramyan et al., 2007). Food quality comprises both product quality and process quality (Luning & Marcelis, 2006). Product quality includes (a) physical characteristics, such as the appearance, taste, and shelf life of the product; (b) alimentary and safety attributes, including the nutritional value afforded by the product and the extent of chemical or pathogenic contamination; and (c) product reliability, as measured by the extent to which product composition matches its description and whether useful information is provided on packaging (Aramyan et al., 2007). Process quality refers to characteristics of (a) the production syst em, such as food traceability, conditions in which product is stored and transported, and conditions in which product is handled; (b) environmental aspects, referring to the amount of energy, water, pesticides, and extent of recycling involved; and (c) factors associated with promoting and marketing the product and providing service to customers (Aramyan et al., 2007). Across the rice supply chain, indicators of product quality, such as appearance and taste, matter more than the shelf life because both the raw material (i.e., paddy) and the processed product are quite resilient to spoilage. Next, we present how the indicators listed above become salient across the various stages of the rice supply chain in Chhattisgarh.
Assessment of food quality begins during procurement with marketing federation “pointers” who are trained to apply the “method of analysis for food grains” specified by the Bureau of Indian Standards for cereals and pulses. The quality of paddy procured is predetermined by the central gov ernment and should be dry; clean; uniform in color and size; and free from molds, weevils, and any obnoxious smells. Overall, paddy should be in saleable condition and have wholesome, good food value.
The marketing federation is responsible for assessing the quality of paddy at the time of procurement so that the proper rice yield can be obtained. This analysis of paddy also ensures product safety and reliability for human consumption. Through our interviews with the marketing federation pointers and observations at the procurement facility, we found that a visual analysis of paddy is performed. However, due to the large inflow of paddy, sometimes the analysis of paddy is very abrupt. Once the paddy is procured, it is either lifted by the rice millers for processing or moved to the storage facility for proper storage. We observed that paddy is stored in an open field with a cap and gown cover. Rice millers reported that paddy quality is affected by the way it is stored, which may affect yield.
All indicators of product quality are measured by the marketing federation, rice millers, and the FCI/civil supplies. Interviews with rice millers revealed that they believe that the FCI conducts a more rudimentary analysis of rice compared to that of civil supplies even though both use the same refractions for the analysis. With regard to process quality, paddy is not traced, but rice millers are required to provide information about the lot number assigned by the government, the date of processing, and the mill ID so that the rice can be traced. Other stakeholders didn’t measure this or gave low importance to traceability. Other indicators of process quality are storage and transportation conditions, working conditions, energy use, water use and reuse, pesticide use, recycling use, promotions, customer service, and store display, all of which were given low importance by almost every stakeholder in practice. Some marketing is done by the government to encourage farmers to grow paddy and sell it to the government. Furthermore, the government provides some bonuses to farmers for their paddy, making it a lucrative market. FPSs do not market their commodities, as they have a fixed number of beneficiaries being served. However, the ePDS has created competition among the FPSs. As a result, the FPSs want to treat customers properly and/or provide additional services, such as drinking water and shade, to attract more beneficiaries so they can generate more income. Beneficiaries do not have the opportunity to assess the quality of the commodities they receive, as they are forced to purchase the commodities from the FPS to fulfill their dietary requirements. However, with the introduction of ePDS system, beneficiaries
are free to choose from which FPS they purchase their commodities.
There is considerable movement of paddy and rice along the entire chain. Rice is always stored in closed warehouses, packed in sacks, and protected through proper pesticide fumigation. However, we observed that, in some cases, rice was spoiled by birds, mice, and insects due to improper storage, handling, packaging, and movement. Moreover, paddy that is stored in open lots under cap cover for protection from rain and the sun undergoes spoilage, similar to that of rice. At the di stribution end, the commodities are stored in a small warehouse at every FPS location from where the commodities are distributed. First in, first out is practiced by each stakeholder to ensure uniform movement of paddy, rice, and commodities. The various performance indicators and their perceived importance by the different stakeholders in the rice supply chain of Chhattisgarh are shown in Figure 2.
6
Summary and future work
This research, using case study methodology, evaluated the understanding of perfo rmance measurement by individual stakeholders operating in a monopolistic agri-food supply chain with government and private sectors utilizing a conventional supply chain framework. Stakeholders were first identified and their understanding of performance indicators was evaluated. The context was the rice supply chain of Chhattisgarh, which is in a turnaround state for food security. Specifically, the analysis examined how four primary performance indicators, flexibility, efficiency, responsiveness, and food quality that were obtained from past theoretical and empirical work on identifying and measuring agri-food supply chain performance assumed relevance for stakeholders across the different stages of the supply chain studied here.
Findings indicate that stakeholders in the PDS rice supply chain do not identify, measure or, perceive as equally important, key performance indicators in the agri-supply chain framework as conceptualized and measured by researchers., as shown in Table 3. We observed that no stakeholders in the chain had all four performance indicators in common (see Table 2). Furthermore, rice millers and the FPSs were the only two stakeholders for whom all four performance indicators were relevant.
Table 3.
Relevant Performance Indicator for Rice Supply Chain of Chhattisgarh
Category Performance Indicator
Efficiency
Costs
Production/distribution Transaction
Profit
Return on Investment Inventory
Flexibility
Customer satisfaction Volume Flexibility Delivery Flexibility Responsiveness
Fill rate Product delay Lead time
Customer response time Customer complaints Food Quality
Product quality
● Sensory properties and shelf life ● Product safety and health
● Product reliability and convenience Process quality
● Production system characteristics ● Marketing
Flexibility and efficiency are measured in the procurement stage among farmers, in the processing stage by rice millers, and in the distribution stage among the FPSs and beneficiaries. No measurement is included in storage stage. Responsiveness is measured for the marketing federation in the procurement stage, the rice millers in the processing stage, the civil supplies in the storage stage, the FPS in the distribution stage, and the beneficiaries. Food quality is measured among all the stak eholders’ at all four stages of the supply chain, with the exception of farmers in the procurement stage. This performance indicator framework may be adjusted for each member of the supply chain.
Given the highly focused, descriptive, and exploratory nature of this research effort, the case study was bounded in terms of (a) the literature reviewed; (b) the geographical settings, product category, and policy framework addressed; (c) the period of time during which data were collected; (d) the sampling procedures employed and resulting breadth and depth of coverage across stakeholder groups and supply chain stages; and (e) the methods employed for data collection and analysis. These delimitations helped orient the researchers toward the unique attributes of the PDS rice supply chain stakeholders and helped sensitize the researchers as the primary instruments of data collection and analysis toward their specific needs and experiences.
For example, the review of literature pertaining to agri-food supply chain performance was constrained to include only those conceptual and empirical studies that were derived or constructed from performance measures specific to agri-food supply chains.
Findings from the present study are not intended to be generalizable outsi de the specified geographical context, and they remain limited in terms of their transferability to geographical settings beyond these locations, given the region-specific implementation of food security policies in India, the significant variation in food surplus across states, and the variability in supply chain characteristics within states. For this study, we did not investigate how farmers obtain seeds and fertilizers or delve into the economic issues they face during the cultivation of the paddy. Interviews with the different categories of farmers (subsistence, business, and prosperous) led to a realization that subsistence farmers remain locked into a debt cycle that carries forward into each successive season with the income generated from harvest sales in one season merely underwriting the costs of purchasing seeds and fertilizers for the next. Future researchers must examine negative implications of the increased use of seeds, chemical fertilizers, and equipment sold by transnational corporations for the livelihoods of subsistence farmers and the sustainability of the rice supply chains in emerging economies. Such studies may yield new metrics for measuring the performance of food supply chains in the “last leg” as food traverses the supply chai n from farm to table.
References
Ahumada, O., Villalobos, J. (2009). Application of planning models in the agri-food supply chain: A review. European Journal of Operational Research, 196(1): 1–20.
Apaiah, R., Linnemann, A., and van der Kooi, H. (2006). Exergy analysis: A tool to study the sustainability of food supply chains. Food Research International, 39(1): 1–11.
Aramyan, L., Christien, O., Olaf, K., and Alfons, O. (2006). Performance indicators in agri-food production chains. In C. J. M. Ondersteijn, J. H. M. Wijnands, R. B. M.Huirne, & O. van Kooten (Eds.),Quantifying the agri-food supply chain (pp. 49–66). Dordrecht, The Netherlands: Springer.
Aramyan, L., Lansink, A., Van Der Vorst, J., and Van Kooten, O. (2007). Performance measurement in agri-food supply chains: A case study. Supply Chain Management,12(4): 304–315.
Beamon, B.M., (1998). Supply chain design and analysis: models and methods. International Journal of Production Economics, 55(3): 281-294.
Beamon, B. (1999). Measuring supply chain performance. International Journal of Operations & Production Management, 19(3): 275–292.
Chopra, S., Meindl, P. (2007), Supply chain management. Strategy, planning & operation. Upper Saddle River, NJ: Prentice Hall.
Christopher, M. (2005). Logistics and supply chain management. Upper Saddle River, NJ, Prentice Hall.
Cohen, S., Roussel, J. (2005). Strategic supply chain management: The five disciplines for top performance. New York, NY: McGraw-Hill.
Creswell, J. (2009). Research design: Qualitative, quantitative, and mixed methods approaches. Thousand Oaks, CA: Sage.
Denzin, N., Lincoln, Y. (2005). The Sage handbook of qualitative research. Thousand Oaks, CA: Sage.
Dhand, V., Srivastav, D., Somasekhar, A., and Jaiswal, R. (2008). Computerization of paddy procurement and Public Distribution System in Chhattisgarh. E-Governnance in Practice, Retrieved from www.iceg.net/2008/books/3/26_216-223.pdf
Eppen, G.D., (1979). Effects of centralization on expected costs in a multi-location newsboy problem. Management Science, 25 (5): 498-501.
Fearne, A., Hornibrook, S., and Dedman, S. (2001). The management of perceived risk in the food supply chain: A comparative study of retailer-led beef quality assurance schemes in Germany and Italy. International Food and Agribusiness Management Review,4(1): 19–36.
Gunasekaran, A., Patel, C., and Ronald, M. (2004). A framework for supply chain performance measurement. International Journal of Production Economics,87: 333–347.
Gunasekaran, A., and Kobu, B. (2007). Performance measures and metrics in logistics and supply chain
management: a review of recent literature (1995–2004) for research and applications. International journal
of production research, 45(12): 2819-2840.
Hobbs, J. (1996). A transaction cost approach to supply chain management. Supply Chain Management, 1(2): 15–27.
Ittner, C., Larcker, D. (2003). Coming up short on nonfinancial performance measurement. Harvard Business Review, 81(11): 88–95.
Kelepouris, T., Pramatari, K., and Doukidis, G. (2007). RFID-enabled traceability in the food supply chain. Industrial Management & Data Systems, 107(2): 183–200.
Korpela, J., Kyläheiko, K., andLehmuswaara, A., et al., (2002). An analytic approach to production capacity allocation and supply chain design. International Journal of Production Economics, 78 (2 Special Iss.): 187-195.
Khera, R. (2011). India's public distribution system: Utilisation and impact. Journal of Development Studies, 47:
1038–1060.
Laux, C., Hurburgh, C. (2010). Using quality management systems for food traceability. Journal of Industrial Technology,26(3): 1–10.
Lai, K.H., Ngai, E.W.T., and Cheng, T.C.E., (2002). Measures for evaluating supply chain performance in transport logistics. Transportation Research. Part E Logistics and Transportation Review, 38 (6): 439-456. Lee, H.L. and Billington, C., 1992. Supply chain management: pitfalls and opportunities. Sloan Management
Review, 33: 65-73.
Lee, H. L. (2010). Don't tweak your supply chain: Rethink it end to end. Harvard Business Review, 88(10).
Luning, P., Marcelis, W. (2006). A techno-managerial approach in food quality management research. Trends in Food Science & Technology,17(7): 378–385.
Meuwissen, M., Van Der Lans, I., and Huirne, R. (2007). Consumer preferences for pork supply chain attributes. NJAS-Wageningen Journal of Life Sciences,54(3): 293–312.
Neely, A., Gregory, M., and Platts, K. (1995). Performance measurement system design: A literature review and research agenda. International Journal of Operations & Production Management, 15(4):80–116.
Olhager, J., Persson, F., Parborg, B., and Linkoping, S. R. (2002). Supply Chain impacts at Ericsson-from
production units to demand-driven supply units. International Journal of Technology Management, 23(1-3):
40-59.
Opara, L. (2003). Traceability in agriculture and food supply chain: A review of basic concepts, technological implications, and future prospects. Journal of Food Agriculture and Environment,1(1): 101–106.
Patel, N. (2010). Not your average farmer: Designing for lead users in ICT4D research. Interactions,17(5): 50– 52.
Puri, R. (2012). Reforming the public distribution system: Lessons from Chhattisgarh. Economic & Policy Weekly, 47(5): 1–2.
Salin, V. (1998). Information technology in agri-food supply chains. International Food and Agribusiness Management Review, 1(3): 329–334.
Sharma, V. (2012). Food subsidy in India: Trends, causes and policy reform options (working paper), Ahmedabad, India: Indian Institute of Management.
Shenton, A., Hayter, S. (2004). Strategies for gaining access to organisations and informants in qualitative studies. Education for Information,22(3): 223–231.
Swinnen, J. (2007), Global supply chains, standards and the poor: How the globalization of food systems and standards affects rural development and poverty. Oxfordshire, UK: CABI.
Thakur, M., Hurburgh, C. (2009). Framework for implementing traceability system in the bulk grain supply chain. Journal of Food Engineering, 95(4): 617–626.
Van der Spiegel, M., Luning, P., Ziggers, G., and Jongen, W. (2003). Towards a conceptual model to measure effectiveness of food quality systems. Trends in Food Science & Technology,14(10): 424–431.
Van der Vorst, J. (2000). Effective food supply chains. Generating, modelling and evaluating supply chain scenarios,(Unpublished doctoral thesis). Wageningen University, Wageningen, The Netherlands.
Van der Vorst, J.G.A.J., Van Dijk, S.J. and Beulens, A.J.M., (2001). Supply chain design in the food industry. The International Journal on Logistics Management, 12 (2): 73-85.